Multicenter Study
. 2023 Oct 4;15(1):157.
doi: 10.1186/s13148-023-01570-1.

Serum methylation of GALNT9, UPF3A, WARS, and LDB2 as noninvasive biomarkers for the early detection of colorectal cancer and advanced adenomas

Affiliations
Multicenter Study

Serum methylation of GALNT9, UPF3A, WARS, and LDB2 as noninvasive biomarkers for the early detection of colorectal cancer and advanced adenomas

María Gallardo-Gómez et al. Clin Epigenetics. .

Abstract

Background: Early detection has proven to be the most effective strategy to reduce the incidence and mortality of colorectal cancer (CRC). Nevertheless, most current screening programs suffer from low participation rates. A blood test may improve both the adherence to screening and the selection to colonoscopy. In this study, we conducted a serum-based discovery and validation of cfDNA methylation biomarkers for CRC screening in a multicenter cohort of 433 serum samples including healthy controls, benign pathologies, advanced adenomas (AA), and CRC.

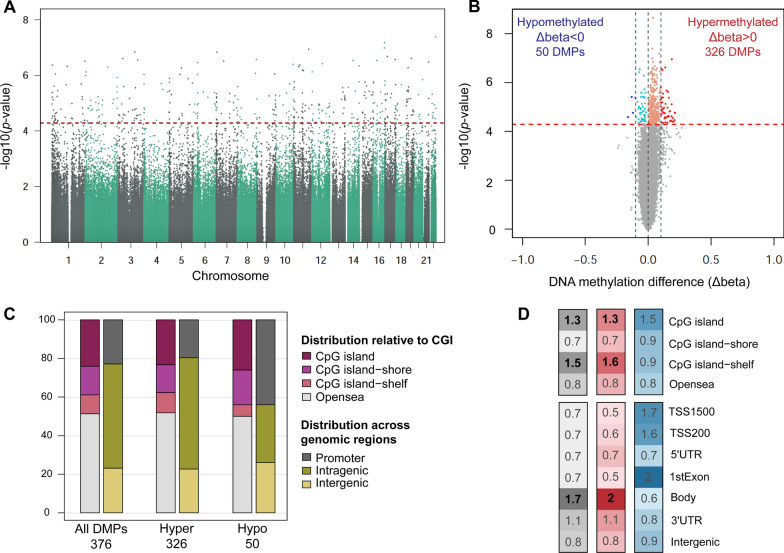
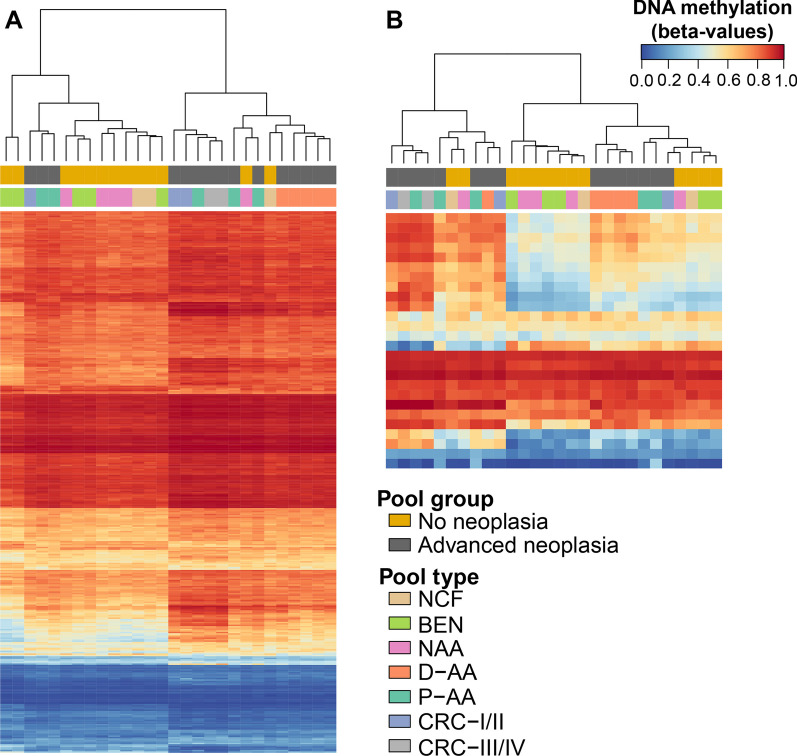
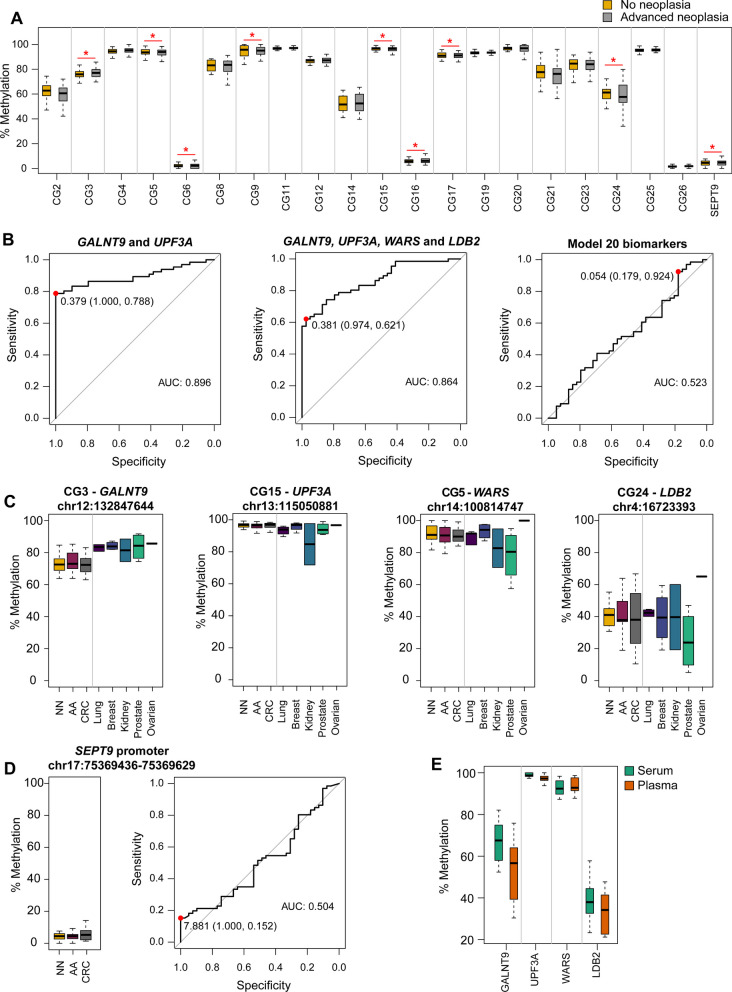
Results: First, we performed an epigenome-wide methylation analysis with the MethylationEPIC array using a sample pooling approach, followed by a robust prioritization of candidate biomarkers for the detection of advanced neoplasia (AN: AA and CRC). Then, candidate biomarkers were validated by pyrosequencing in independent individual cfDNA samples. We report GALNT9, UPF3A, WARS, and LDB2 as new noninvasive biomarkers for the early detection of AN. The combination of GALNT9/UPF3A by logistic regression discriminated AN with 78.8% sensitivity and 100% specificity, outperforming the commonly used fecal immunochemical test and the methylated SEPT9 blood test.

Conclusions: Overall, this study highlights the utility of cfDNA methylation for CRC screening. Our results suggest that the combination methylated GALNT9/UPF3A has the potential to serve as a highly specific and sensitive blood-based test for screening and early detection of CRC.

Keywords: Advanced adenomas; Cancer prevention; Circulating cell-free DNA; Colorectal cancer; DNA methylation; Liquid biopsy; Screening; Serum.


Conflict of interest statement

The authors declare that they have no competing interests.

Figures

Fig. 1
Fig. 1
Study workflow. The study was divided into (i) a biomarker discovery phase, (ii) a candidate biomarker evaluation phase, and (iii) a selected biomarker validation. cfDNA: cell-free DNA; CRC: colorectal cancer; IBD: inflammatory bowel disease; NCF: no colorectal findings; BEN: benign pathology; NAA: non-advanced adenomas; D-AA: distal advanced adenomas; P-AA: proximal advanced adenomas; NN: no neoplasia; AN: advanced neoplasia; DMP: differentially methylated position; and RRBS: reduced representation bisulfite sequencing
Fig. 2
Fig. 2
Distribution and annotation of differentially methylated positions (DMPs) between advanced neoplasia and no neoplasia pools. A Manhattan plot for differential methylation. The -log10(p value) for the 741,310 probes analyzed are sorted by chromosome location. Significant DMPs (376) appear above the red dashed line (FDR 10%) B Volcano plot showing the -log10(p value) versus differences in methylation levels (Δbeta: obtained by subtracting the DNA methylation levels (beta-values) of NN from AN). Significant hypermethylated (Δbeta > 0) and hypomethylated (Δbeta < 0) positions appear highlighted in color and above the red dashed line (FDR 10%). C Distribution of the DMPs relative to CpG islands and functional genomic locations. D Enrichment of DMPs in relation to CpG island annotation and functional genomic regions. The color scale indicates the fold enrichment of all DMPs (gray), hypermethylated (red), and hypomethylated (blue) positions. The bolded numbers indicate annotations that are enriched with respect to the distribution of probes on the MethylationEPIC array (one-sided Fisher’s exact test p value < 0.05). Functional characterization of probes according to the Methylation EPIC Manifest: CpG island: region of at least 200bp with a CG content > 50% and an observed-to-expected CpG ratio ≥ 0.6; CpG island-shore: sequences 2 kb flanking the CpG island, CpG island-shelf: sequences 2 kb flanking shore regions, opensea: sequences located outside these regions, promoter regions (5′UTR, TSS200, TSS1500, and first exons), intragenic regions (gene body and 3′UTR), and intergenic regions. TSS200, TSS1500: 200 and 1500 bp upstream the transcription start site, respectively
Fig. 3
Fig. 3
Unsupervised clustering analyses of the 28 cfDNA pooled samples. A Hierarchical clustering and heatmap showing the methylation levels across all samples for the 376 DMPs. B Hierarchical clustering and heatmap showing the methylation levels across all samples for the 26 candidate biomarkers. Each column represents one pool, while rows correspond to CpG sites. Dendrograms were computed and reordered using Euclidean distance and a complete clustering agglomeration. Methylation levels are expressed as beta-values ranging from 0 (blue, unmethylated) to 1 (red, fully methylated)
Fig. 4
Fig. 4
Methylation levels of the 26 candidate biomarkers. A Methylation levels of the 26 candidate CpG sites in the 28 pooled cfDNA samples, with the corresponding MethylationEPIC CpG probe ID. Average methylation of the probes targeting the v2 promoter region of the SEPT9 gene (cg02884239, cg20275528, and cg12783819) is also shown. Methylation is shown as beta-values ranging from 0-unmethylated to 1-fully methylated (**differential methylation p value < 0.01; *differential methylation p value < 0.05). B Methylation levels of the 26 candidate CpG sites and SEPT9 promoter in the biomarker evaluation cohort (n = 48) of individual serum cfDNA samples. Methylation percentage was obtained through bisulfite pyrosequencing (*Wilcoxon rank-sum test p value < 0.05). C Strip-plot showing the concordance of methylation levels between pooled and individual samples. Each dot represents the methylation level of one sample. D Scatterplot shows the positive significant correlation between methylation in pooled and individual cfDNA samples for the 26 candidate CpG sites
Fig. 5
Fig. 5
Diagnostic performance of the models and methylation levels in the model validation cohort (n = 105). A Methylation levels of the final 20 selected biomarkers in the model validation cohort (*Wilcoxon rank-sum test p value < 0.05). B ROC curve analysis and AUC for the three models evaluated for CRC screening, derived by leave-one-out cross-validation (GALNT9: CG3; UPF3A: CG15; WARS: CG5; and LDB2: CG24). The red dots indicate the sensitivity and specificity values for the best cutoffs based on the Youden index method. C Serum methylation levels of CG3-GALNT9, CG15-UPF3A, CG5-WARS, and CG24-LDB2 in the model validation cohort (n = 105), and in lung, breast, kidney, prostate, and ovarian cancer cases (n = 16). D Methylation levels and classification performance (ROC curve) of the SEPT9 promoter. The red dot indicates the best sensitivity and specificity values (Youden index). E Comparison of methylation levels between matched serum and plasma samples. AUC: area under the curve; NN: no neoplasia; AA: advanced adenomas; and CRC: colorectal cancer
Fig. 6
Fig. 6
Schematic representation of the potential implementation of a blood-based test in CRC screening. To target different sample preferences and improve participation rates, a blood test could be offered to individuals refusing FIT (left arm). In combination with FIT, the blood test may improve selection for follow-up colonoscopy after a positive FIT (right arm). A FIT test would be offered every two years to individuals rejecting both the FIT and the blood test, and to individuals with a previous negative result in either FIT or blood-based test

References

    1. Bray F, Ferlay J, Soerjomataram I, Siegel RL, Torre LA, Jemal A. Global cancer statistics 2018: GLOBOCAN estimates of incidence and mortality worldwide for 36 cancers in 185 countries. CA Cancer J Clin. 2018;68(6):394–424. doi: 10.3322/caac.21492. - DOI - PubMed
    1. Siegel RL, Miller KD, Jemal A. Cancer statistics, 2019. CA Cancer J Clin. 2019;69(1):7–34. doi: 10.3322/caac.21551. - DOI - PubMed
    1. Ladabaum U, Dominitz JA, Kahi C, Schoen RE. Strategies for colorectal cancer screening. Gastroenterology. 2020;158(2):418–432. doi: 10.1053/j.gastro.2019.06.043. - DOI - PubMed
    1. Senore C, Basu P, Anttila A, Ponti A, Tomatis M, Vale DB, et al. Performance of colorectal cancer screening in the European union member states: data from the second European screening report. Gut. 2019;68(7):1232–1244. doi: 10.1136/gutjnl-2018-317293. - DOI - PubMed
    1. Lee JK, Liles EG, Bent S, Levin TR, Corley DA. Accuracy of fecal immunochemical tests for colorectal cancer: systematic review and meta-analysis. Ann Intern Med. 2014;160(3):171. doi: 10.7326/M13-1484. - DOI - PMC - PubMed

Publication types