. 2023 Oct 26;186(22):4834-4850.e23.
doi: 10.1016/j.cell.2023.09.002. Epub 2023 Oct 3.

SND1 binds SARS-CoV-2 negative-sense RNA and promotes viral RNA synthesis through NSP9

Affiliations

SND1 binds SARS-CoV-2 negative-sense RNA and promotes viral RNA synthesis through NSP9

Nora Schmidt et al. Cell. .

Abstract

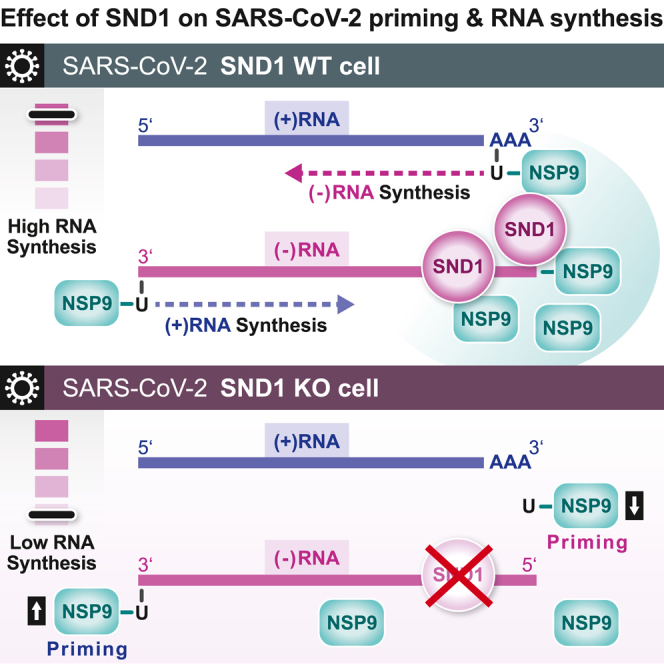
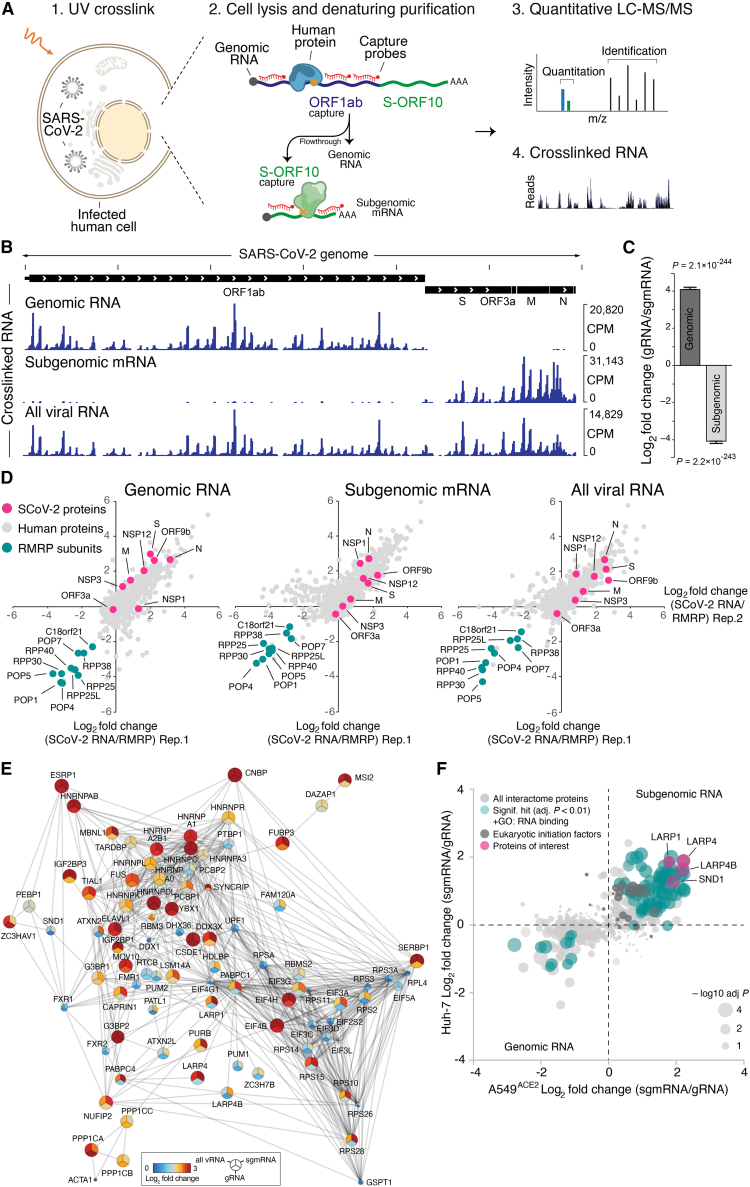
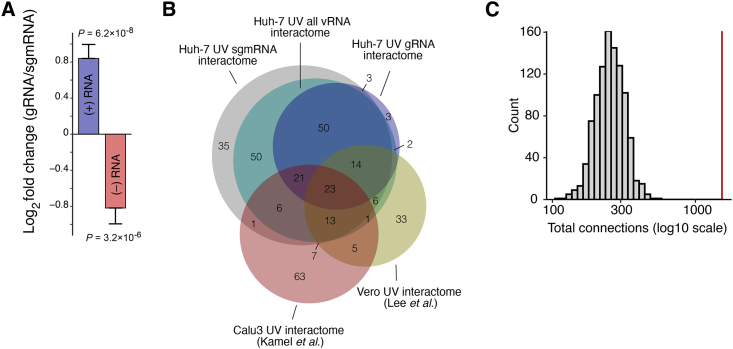
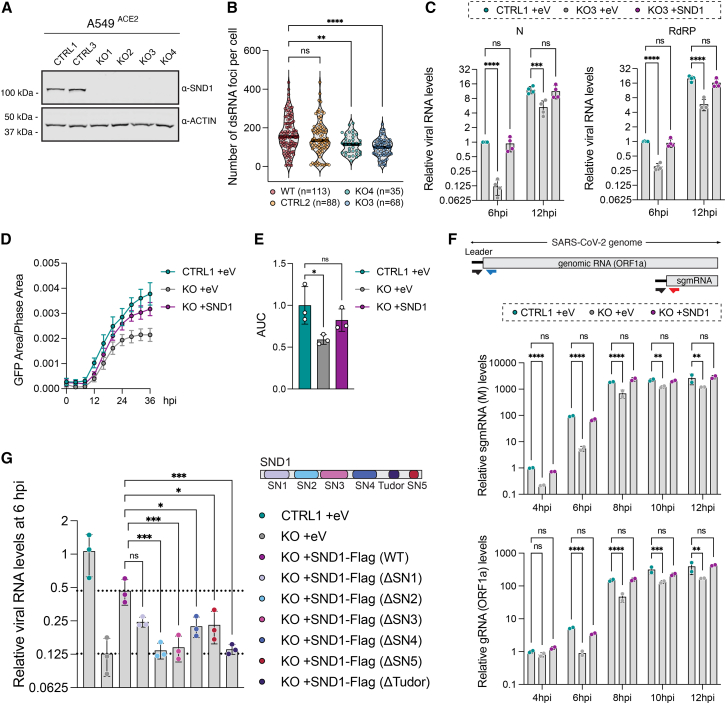
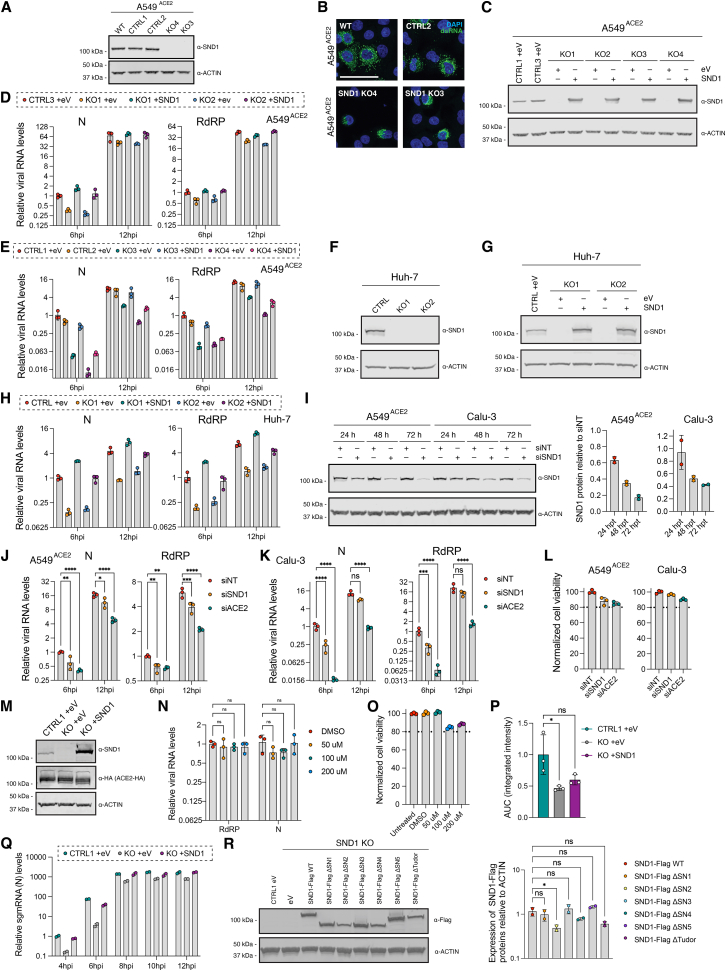
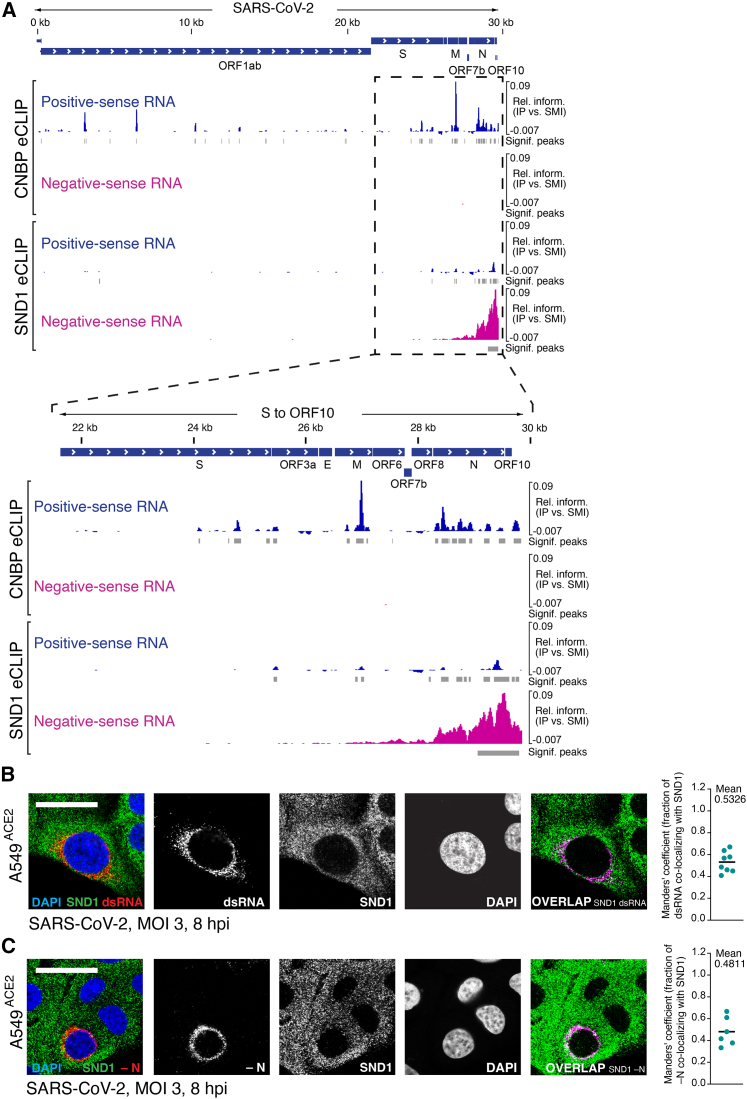
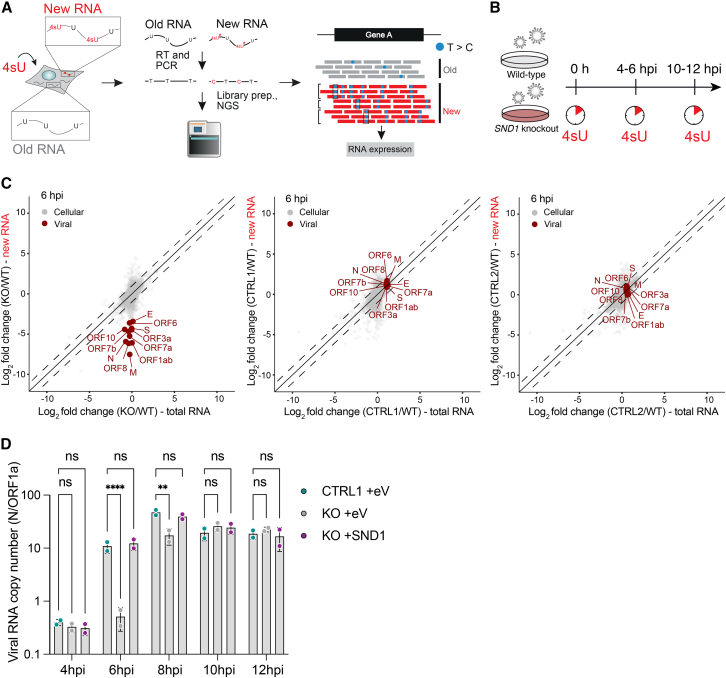
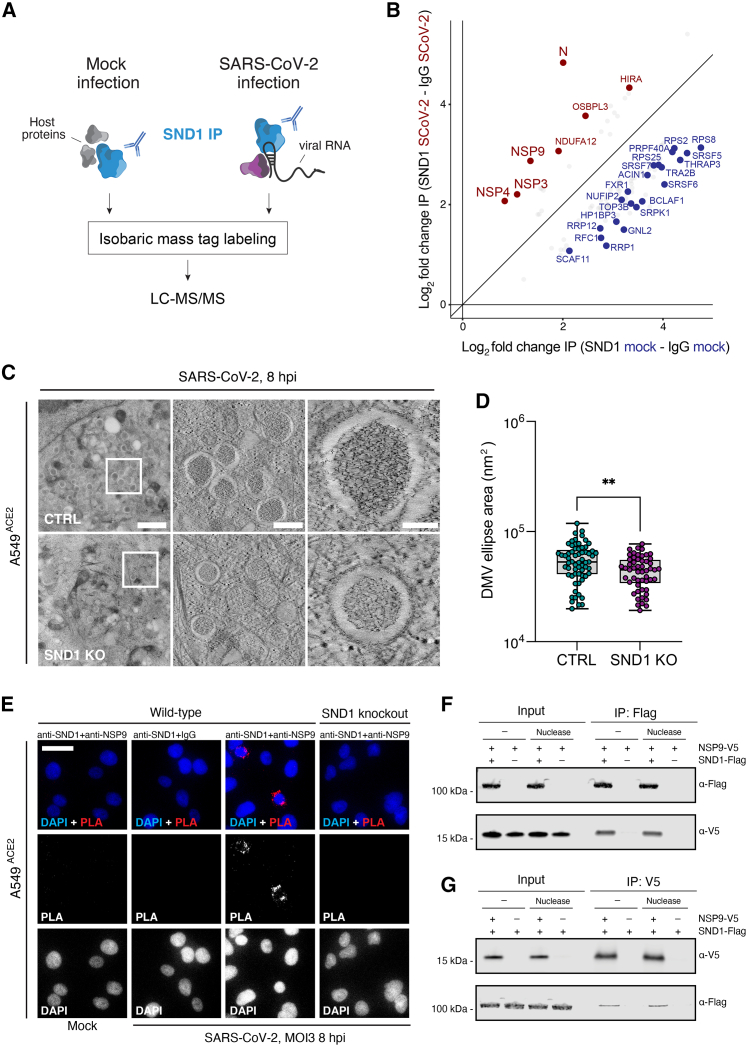
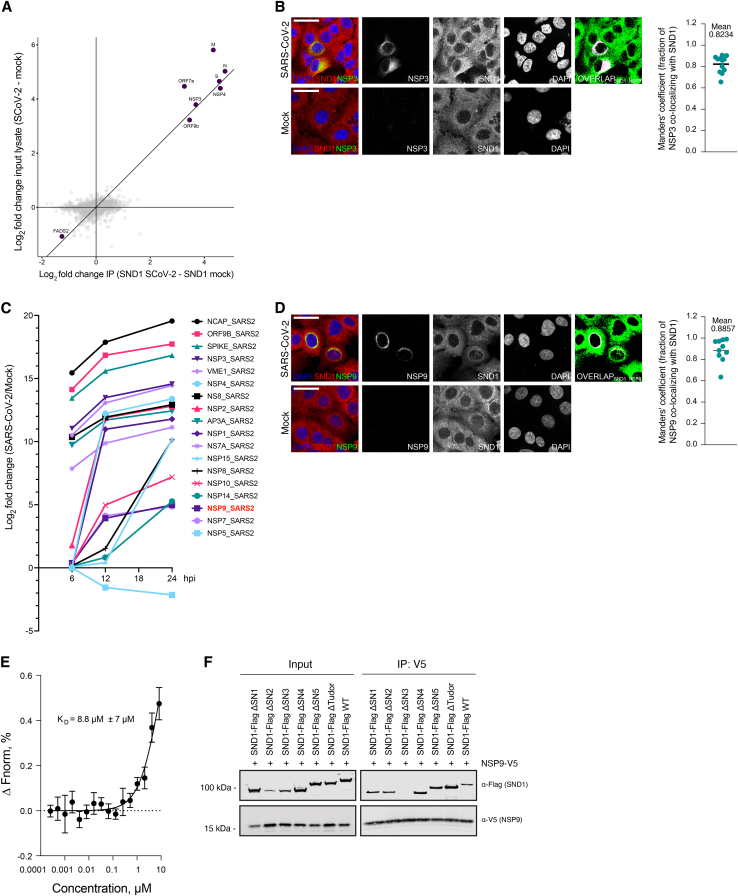
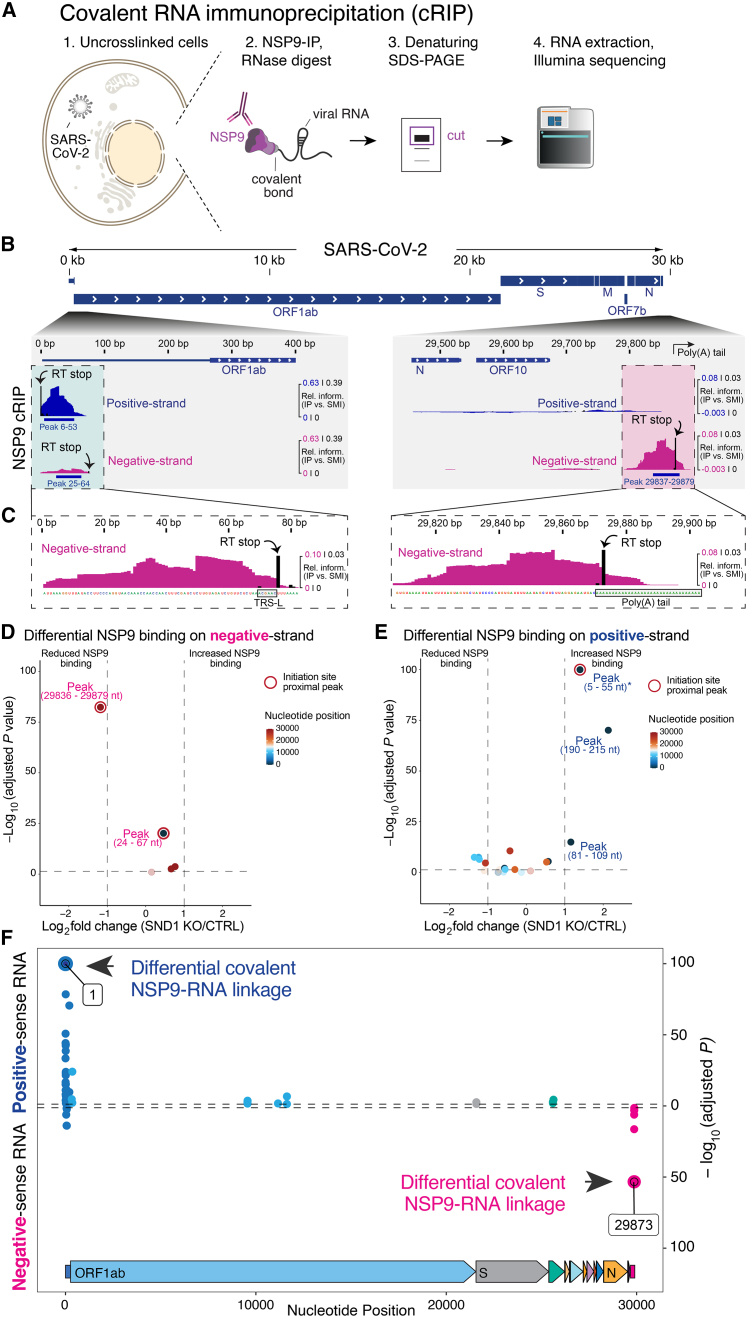
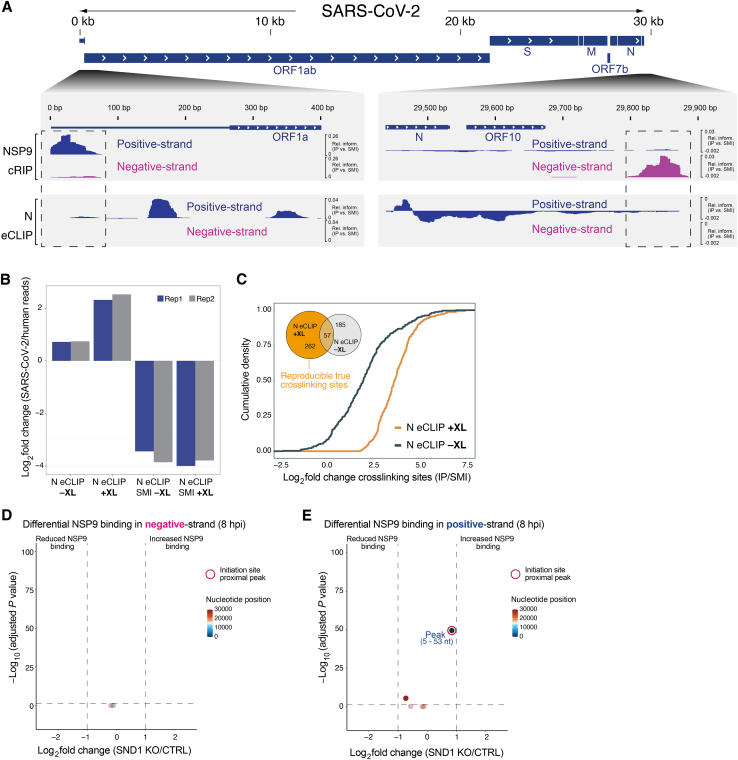
Regulation of viral RNA biogenesis is fundamental to productive SARS-CoV-2 infection. To characterize host RNA-binding proteins (RBPs) involved in this process, we biochemically identified proteins bound to genomic and subgenomic SARS-CoV-2 RNAs. We find that the host protein SND1 binds the 5' end of negative-sense viral RNA and is required for SARS-CoV-2 RNA synthesis. SND1-depleted cells form smaller replication organelles and display diminished virus growth kinetics. We discover that NSP9, a viral RBP and direct SND1 interaction partner, is covalently linked to the 5' ends of positive- and negative-sense RNAs produced during infection. These linkages occur at replication-transcription initiation sites, consistent with NSP9 priming viral RNA synthesis. Mechanistically, SND1 remodels NSP9 occupancy and alters the covalent linkage of NSP9 to initiating nucleotides in viral RNA. Our findings implicate NSP9 in the initiation of SARS-CoV-2 RNA synthesis and unravel an unsuspected role of a cellular protein in orchestrating viral RNA production.

Keywords: RNA binding proteins; RNA biology; RNA interactome; RNA virus; SARS-CoV-2; host factors; omics technologies; proteomics; systems biology; virus host interactions.


Conflict of interest statement

Declaration of interests The authors declare no competing interests.

Figures

None
Graphical abstract
Figure 1
Figure 1
The SARS-CoV-2 RNA-protein interactome at subgenome resolution (A) Outline of RAP-MS workflow to identify proteins bound to SARS-CoV-2 genomic RNA (gRNA) and subgenomic mRNA (sgmRNA). (B) Sequencing of RNA crosslinked to proteins purified with RAP-MS. (C) Enrichment of reads mapping to SARS-CoV-2 genomic and subgenomic RNA in gRNA relative to sgmRNA purifications ± SE. p values determined by Wald test. (D) Quantification of SARS-CoV-2 RNA interacting proteins relative to RMRP interacting proteins in antisense purifications of indicated RNA species. Log2 fold changes from two biological replicates in Huh-7 cells are shown. Gray, all detected proteins; magenta, SARS-CoV-2 proteins; teal, RMRP components. (E) Protein-protein association network for consensus SARS-CoV-2 RNA interactome based on interactions in STRING v11. Coloring indicates RAP-MS enrichment in Huh-7 cells. Nodes are scaled to significance. (F) Quantification of sgmRNA relative to gRNA interactomes. Average log2 fold changes in A549ACE2 cells (x axis) and Huh-7 cells (y axis) are shown. Circles are scaled to significance. Keratins and carboxylases were removed. (E and F) Combined p values calculated using Fisher’s method for combined probability and adjusted using Benjamini-Hochberg procedure. See also Figure S1 and Tables S1 and S2.
Figure S1
Figure S1
Analysis of subgenome-resolved SARS-CoV-2 RNA-protein interactions, related to Figure 1 (A) Enrichment of reads mapping to SARS-CoV-2 positive-sense or negative-sense RNA in gRNA purifications relative to sgmRNA purifications ± SE. p values determined by Wald test. (B) Venn diagram comparing two UV-based SARS-CoV-2 RNA interactomes, to the subgenome-resolved RNA interactome presented in this study (Huh-7 cells, FDR < 5%, Table S2). Only human proteins are shown. (C) Total number of connections observed in protein-protein association network constructed based on consensus SARS-CoV-2 RNA interactome (red line, 1,280 connections), compared to number of connections observed in random networks of equal size (gray bars, mean 259.9 connections) using random sampling of proteins detected in proteome measurements (1,000 permutations).
Figure 2
Figure 2
SND1 is a SARS-CoV-2 host dependency factor (A) Western blot analysis of SND1 knockout (KO) and control (CTRL) cell lines (A549ACE2). Actin serves as control. (B) Analysis of dsRNA foci in SND1 KO and CTRL cells compared to wild-type (WT) cells at 8 hpi. Median value indicated by black line. Representative images are shown in Figure S2B. p values determined by one-way ANOVA. (C) RT-qPCR of SARS-CoV-2 RNA levels in SND1 KO and CTRL cells transduced with empty vehicle (+eV) or SND1 (+SND1) as indicated. Quantification relative to 18S rRNA and CTRL at 6 hpi. Values are mean ± SD (n = 4 independent experiments; 3 technical replicates each). p values determined by two-way ANOVA with Dunnett’s test. (D) Time course of SARS-CoV-2-GFP growth in SND1 KO and CTRL cells transduced with empty vehicle (+eV) or SND1 (+SND1) as indicated. Values are mean ± SEM. Representative of 3 independent experiments is shown. (E) Area under the curve (AUC) analysis of 3 independent time course measurements of SARS-CoV-2-GFP growth. Normalization relative to mean of control (CTRL1 +eV). Values are mean ± SD. p values determined by one-way ANOVA with Dunnett’s test. (F) RT-qPCR of M (top) and ORF1a (bottom) RNA levels at 4–12 hpi in SND1 KO and CTRL cells transduced with empty vehicle (+eV), or SND1 (+SND1) as indicated. Quantification relative to 18S rRNA and CTRL at 4 hpi. Values are mean ± SD (n = 2 independent infections). Schematic: primer design to quantify gRNA and sgmRNA expression. p values determined by two-way ANOVA with Dunnett’s test. (G) RT-qPCR of SARS-CoV-2 RNA levels (N) in SND1 KO and CTRL cells transduced with empty vehicle (eV), full-length SND1 (WT), or SND1 deletion mutants as indicated. Quantification relative to 18S rRNA and CTRL. Values are mean ± SD (n = 3 independent infections). p values determined by two-way ANOVA with Dunnett’s test. ∗∗∗∗p < 0.0001, ∗∗∗p < 0.001, ∗∗p < 0.01, p < 0.05, ns = not significant. All SARS-CoV-2 infections were performed in A549ACE2 cells at MOI 3 plaque-forming unit (PFU)/cell. See also Figure S2.
Figure S2
Figure S2
SND1 is a SARS-CoV-2 host factor, related to Figure 2 (A) Western blot analysis of SND1 knockout (KO), control (CTRL), and wild-type (WT) A549ACE2 cell lines. Expression of SND1 was evaluated relative to actin. (B) Representative images of IF staining for dsRNA (J2 antibody) using HCR detection in SARS-CoV-2 infected A549ACE2 cells at 8 hpi (MOI = 3 PFU/cell). Scale bars, 50 μm. (C) Western blot analysis of SND1 KO and CTRL cell lines (A549ACE2) transduced with empty vehicle (+eV), as well as SND1 KO cells transduced with SND1 (+SND1). Expression of SND1 was evaluated relative to actin. (D) RT-qPCR of SARS-CoV-2 RNA levels (left: N, right: RdRP) at 6 and 12 hpi in SND1 KO and CTRL cells transduced with empty vehicle (+eV) or SND1 (+SND1) as indicated. Two knockout clones shown in Figure 2A were analyzed. A549ACE2 cells were infected at MOI 3 PFU/cell. Quantification relative to 18S rRNA and CTRL at 6 hpi. Values are mean ± SD (n = 3 independent infections). (E) As in (D), but for two additional knockout clones shown in Figures 2A and S2A. (F) Western blot analysis of SND1 KO and CTRL cell lines (Huh-7). Expression of SND1 was evaluated relative to actin. (G) Western blot analysis of SND1 KO and CTRL cell lines (Huh-7), transduced with empty vehicle (+eV), as well as SND1 KO cells transduced with SND1 (+SND1). Expression of SND1 was evaluated relative to actin. (H) RT-qPCR of SARS-CoV-2 RNA levels (left: N, right: RdRP) at 6 and 12 hpi in SND1 KO and CTRL cells transduced with empty vehicle (+eV) or SND1 (+SND1) as indicated. Huh-7 cells were infected at MOI 3 PFU/cell. Quantification relative to 18S rRNA and CTRL at 6 hpi. Values are mean ± SD (n = 3 independent infections). (I) Western blot analysis of SND1 siRNA knockdown time course in A549ACE2 and Calu-3 cells at 24, 48, and 72 h post transfection. Expression changes are evaluated relative to non-targeting control and compared to changes in actin. Quantification of SND1 protein levels in two replicate experiments in A549ACE2 and Calu-3 cells is shown on the right. Values are mean ± SD (n = 2). (J) RT-qPCR of SARS-CoV-2 RNA levels (left: N, right: RdRP) at 6 and 12 hpi in A549ACE2 cells treated with SND1 siRNAs for 72 h. Cells were infected at MOI 3 PFU/cell. Quantification relative to 18S rRNA and CTRL at 6 hpi. Values are mean ± SD (n = 3 independent infections). p values determined by two-way ANOVA with Dunnett’s test. (K) As in (J), but for Calu-3 cells. (L) Cell viability assay of SND1 siRNA knockdown experiments at 72 h post transfection. Values are mean ± SD (n = 3). (M) Western blot analysis of SND1 KO and CTRL cell lines (A549ACE2) transduced with empty vehicle (+eV) or a constitutive lentiviral SND1 expression construct (+SND1). Expression of SND1 and ACE2-HA were evaluated relative to actin. (N) RT-qPCR of SARS-CoV-2 RNA levels at 6 hpi (left: RdRP, right: N) in A549ACE2 cells treated with DMSO or different concentrations of 2′-deoxythymidine-3′,5′-bisphosphate (pdTp) and infected with SARS-CoV-2 at MOI 3 PFU/cell. Quantification relative to 18S rRNA and DMSO treated cells. Values are mean ± SD (n = 3 independent infections). p values determined by two-way ANOVA with Dunnett’s test. (O) Cell viability assay of inhibitor treated and untreated cells shown in (N). Values are mean ± SD (n = 3 independent treatments). (P) Integrated fluorescence intensity-based analysis of three independent time course measurements of SARS-CoV-2-GFP reporter virus growth shown in Figure 2E. Normalization relative to mean of control (CTRL1 +eV). Values are mean ± SD. p values determined by ordinary one-way ANOVA with Dunnett’s test. (Q) RT-qPCR of N sgmRNA levels at 4–12 hpi in SND1 KO and CTRL cells transduced with empty vehicle (+eV) or SND1 (+SND1) as indicated. A549ACE2 cells were infected with SARS-CoV-2 at MOI 3 PFU/cell. Quantification relative to 18S rRNA and CTRL at 4 hpi. Primers to specifically quantify gRNA and sgmRNA expression levels (Figure 2F) were used. Values are mean ± SD (n = 2 independent infections). (R) Western blot analysis of SND1 KO and CTRL cells transduced with empty vehicle (eV) or a constitutive lentiviral expression construct encoding the indicated SND1 proteins. Expression of FLAG-tagged SND1 proteins was quantified in duplicates and evaluated relative to actin (right). Values are mean ± SD. p values determined by ordinary one-way ANOVA with Dunnett’s test. ∗∗∗∗p < 0.0001, ∗∗∗p < 0.001, ∗∗p < 0.01, p < 0.05, ns = not significant.
Figure 3
Figure 3
SND1 binds negative-sense viral RNA (A) Alignment of strand-separated eCLIP data for SND1 and CNBP to SARS-CoV-2 genome. Relative information in IP vs. size-matched input (SMI) is calculated at each position (STAR Methods) and displayed for positive-sense (blue) and negative-sense RNA (magenta). Peaks significantly enriched relative to SMI are indicated in gray. Lower panel displays zoom in to the S to ORF10 region. eCLIP was performed in Huh-7 cells at 24 hpi. (B) IF staining of SND1 and dsRNA in SARS-CoV-2 infected A549ACE2 cells at 8 hpi (MOI = 3 PFU/cell). Representative images are shown. Overlap is quantified by Manders’ co-localization coefficient (n = 8 images). Uninfected cells shown in Figure S3A. (C) HCR RNA-FISH for negative-sense RNA (−N) combined with HCR IF for SND1 in SARS-CoV-2 infected A549ACE2 cells at 8 hpi (MOI = 3 PFU/cell). Representative images are shown. Overlap is quantified by Manders’ co-localization coefficient (n = 6 images). Cells were denatured prior to −N RNA detection; non-denatured cells shown in Figure S3B. Scale bars, 25 μm. See also Figure S3 and Table S3.
Figure S3
Figure S3
Subcellular localization of SND1 and viral replication products, related to Figure 3 (A) IF staining of SND1 and dsRNA (J2 antibody) in uninfected A549ACE2 cells at 8 hpi. (B) HCR RNA-FISH for negative-sense RNA of the N gene (−N) in SARS-CoV-2 infected A549ACE2 cells without denaturation prior to probe hybridization. Scale bars, 25 μm. (C) Titers of virus stocks determined by plaque assays on Vero-E6-TMPRSS2 and A549ACE2 cells. Values are mean ± SD (n = 2).
Figure 4
Figure 4
SND1 is required for nascent SARS-CoV-2 RNA synthesis early during infection (A) Outline of SLAM-seq method. (B) Strategy to measure nascent SARS-CoV-2 RNA synthesis in SND1 knockout (KO) and control (CTRL) or wild-type (WT) cells. (C) SLAM-seq analysis at 6 hpi. Average log2 fold changes in total RNA (x axis) and newly synthesized RNA (y axis) are shown for SND1 KO and CTRL cells, relative to WT cells (n = 2 independent infections). (D) Absolute quantification of viral RNA copy numbers by digital droplet PCR. Ratio of sgmRNA (N) relative to gRNA (ORF1a) is shown at 4–12 hpi, in SND1 KO and CTRL cells transduced with empty vehicle (+eV) or SND1 (+SND1) as indicated. Cells infected with SARS-CoV-2 at MOI 3 PFU/cell. Values are mean ± SD (n = 2 independent infections). p values determined by two-way ANOVA with Dunnett’s test. ∗∗∗∗p < 0.0001, ∗∗p < 0.01, ns = not significant. See also Figure S4.
Figure S4
Figure S4
Measuring changes in viral RNA synthesis with SLAM-seq, related to Figure 4 (A) Mismatch frequencies observed in SLAM-seq libraries. (B) Principal component analysis of SLAM-seq experiments. (C) Analysis of SLAM-seq experiments at 12 hpi using GRAND-SLAM. Scatter plot of average log2 fold changes in total RNA (x axis) and newly synthesized RNA (y axis) is shown for SND1 knockout (KO) and control (CTRL) cells, relative to wild-type (WT) cells (n = 2 independent experiments). Insets show a zoom-in view on viral genes for improved visibility. (D) Bar graph visualization of log2 fold changes for new RNA (left) and total RNA (right) observed in SLAM-seq experiments shown in (C) and Figure 4C for viral genes at 6 (top) and 12 hpi (bottom).
Figure 5
Figure 5
SND1 interacts with RTC components involved in viral RNA biogenesis (A) Strategy to globally identify SND1 protein-protein interactome changes upon SARS-CoV-2 infection. (B) Fold change correlation plot displaying SND1 interacting proteins enriched over IgG control in SARS-CoV-2 infected (SCoV-2, y axis) and uninfected (mock, x axis) A549ACE2 cells (n = 2 independent experiments). Candidates with a fold change > 1.5 or < 0.66 and FDR < 0.2 in infected relative to uninfected cells are displayed. Proteins with a substantial SND1 interaction change (absolute log2 fold change > 1, FDR < 0.05) are highlighted in red and blue. (C) Computational slices of representative electron tomograms of SND1 knockout (KO) and control (CTRL) cells infected with SARS-CoV-2. Zoom in to region containing DMVs is shown at different magnifications. Left: scale bars, 1 μm; center: scale bars, 250 nm; right: scale bars, 100 nm. (D) Quantification of cross-sectional DMV area in SND1 KO and CTRL cells. Box: 25th and 75th percentiles. Whiskers: minimum to maximum. Median indicated by line. p value determined by t test, ∗∗p < 0.01. (E) Proximity ligation assay for SND1 and NSP9. Mock-infected cells are compared to SARS-CoV-2 infected cells. Scale bars, 30 μm. (F) CoIP western blot analysis for epitope-tagged SND1 and NSP9 proteins expressed in uninfected HEK293T cells with and without nuclease (benzonase) treatment. SND1-FLAG served as bait. Input lysates are shown on the left. (G) As in (F), but using NSP9-V5 as bait. See also Figure S5 and Table S4.
Figure S5
Figure S5
Expression, localization, and interaction analyses for virus and host proteins, related to Figure 5 (A) Scatter plot displaying average log2 fold changes in SND1 coIP experiments (x axis) and average log2 fold changes in total proteome measurements of input lysates used for coIP experiments (y axis). SARS-CoV-2 infected cells are compared relative to uninfected cells in coIPs and total proteome measurements (n = 2 independent infections). Proteins that display a significant interaction and expression change (absolute log2 fold change > 1, FDR < 0.05) upon SARS-CoV-2 infection cells are highlighted. (B) IF staining of SND1 and NSP3 proteins in SARS-CoV-2 infected A549ACE2 cells at 8 hpi (MOI = 10 PFU/cell). Mock-infected cells were stained as controls. Representative images are shown. Overlap between NSP3 and SND1 is quantified by Manders’ co-localization coefficient (right, n = 12 images). Scale bars, 30 μm. (C) Log2 fold changes for viral proteins observed in total proteome measurements of SARS-CoV-2 infected A549ACE2 cells at different infection time points, as previously reported. (D) As in (B), but for SND1 and NSP9. Overlap between NSP9 and SND1 is quantified by Manders’ co-localization coefficient (right, n = 10 images). (E) Microscale thermophoresis (MST) assay to monitor binding of recombinant NSP9 protein to recombinant SND1 protein in vitro. Unlabeled NSP9 protein (254 pM to 8.33 μM) was titrated against site-specific cysteine-labeled SND1 (10 nM) and thermophoresis was recorded. Change in fluorescence (ΔFnorm) was measured at MST on-time of 10 s. Values are mean ± SD (n = 3 independent measurements). (F) CoIP western blot analysis for epitope-tagged SND1 and NSP9 proteins exogenously expressed in uninfected HEK293T cells. SND1-FLAG constructs are deleted for indicated protein domains. NSP9-V5 served as bait. Input lysates are shown on the left. Anti-FLAG and anti-V5 antibodies are used to detect tagged SND1 and NSP9 proteins, respectively. SN, SNase.
Figure 6
Figure 6
NSP9 is covalently linked to SARS-CoV-2 RNA and SND1 modulates NSP9 occupancy and its covalent linkage to viral RNA (A) Schematic of covalent RNA immunoprecipitation (cRIP) to map covalent RNA-protein linkages formed in the absence of UV-crosslinking. (B) Alignment of strand-separated NSP9 cRIP data to SARS-CoV-2 genome. Relative information in IP vs. SMI is calculated at each position (STAR Methods) and displayed for positive-sense (blue) and negative-sense (magenta) RNA. Zoom-in views of 5′ and the 3′ end of the viral RNA genome are shown for representative experiment in A549ACE2 cells at 8 hpi. NSP9 peaks significantly enriched relative to SMI (log2 fold change > 2, p < 0.05, one-sided Fisher test) are indicated. RT stops are denoted in black (relative information in IP vs. SMI). Green and red boxes indicate regions of interest. Scale: colored numbers relate to normalized coverage (IP vs. SMI); black numbers relate to normalized RT stops (IP vs. SMI). (C) Zoom-in view of NSP9 cRIP signal and RT stops (relative information in IP vs. SMI) in negative-sense RNA at 5′ and 3′ end of the viral genome. Gray boxes indicate TRS-L region and poly(A/U) tail. Sequence corresponds to positive strand. (D) SND1-dependent changes in NSP9 binding on peak regions relative to non-peak regions in negative-sense RNA in A549ACE2 cells (SND1 KO vs. CTRL) at 12 hpi. Color scale reflects localization of peaks. Peaks with strongest NSP9 binding change are annotated. Initiation site-proximal peaks are encircled. (E) As in (D) but for positive-sense RNA. Actual p value of peak (5–55 nt) was computed as p < 4.9 × 10−324; for visualization this p value was set to p = 1.0 × 10−100. (F) SND1-dependent changes in covalent NSP9-RNA linkages across the SARS-CoV-2 genome in positive and negative-sense RNA. Representative experiment in A549ACE2 cells (SND1 KO vs. CTRL) at 12 hpi is shown. Actual p value of nucleotide 1 was computed as p < 4.9 × 10−324; for visualization this p value was set to p = 1.0 × 10−100. See also Figure S6 and Tables S3, S5, and S6.
Figure S6
Figure S6
Analysis of N and NSP9 RNA binding on viral RNA, related to Figure 6 (A) Comparison of the viral RNA binding pattern observed for NSP9 (cRIP, top) and N (eCLIP, bottom) at 12 hpi in A549ACE2 cells. Alignment of strand-separated cRIP and eCLIP data to the SARS-CoV-2 RNA genome is shown. Relative information in IP vs. SMI is calculated at each position (STAR Methods) and displayed for positive-sense RNA (blue) and negative-sense RNA (magenta). Zoom-in views of the 5′ end (left) and the 3′ end (right) of the viral RNA genome are shown and regions of interest are highlighted by dashed box. (B) Enrichment of reads mapping to the SARS-CoV-2 genome relative to the human genome in N eCLIP experiments with (+XL) and without (−XL) UV-crosslinking, as well as corresponding SMI libraries. (C) Cumulative density function displaying enrichment of crosslinked nucleotides in N IP relative to SMI experiments with and without UV-crosslinking. Inset shows Venn diagram displaying the overlap of true crosslinking sites reproducibly found in N eCLIP experiments with sites found in N eCLIP experiments without UV-crosslinking. (D) Volcano plot displaying SND1-dependent changes in NSP9 binding on peak regions relative to non-peak regions in negative-sense RNA at 8 hpi (SND1 KO vs. CTRL). Color scale reflects localization of peak region relative to the 5′ and 3′ end of the viral RNA genome. Peaks with the statistically most pronounced NSP9 binding change are annotated. Initiation site-proximal peaks are encircled. (E) As in (D), but for positive-sense RNA.

References

    1. V’kovski P., Kratzel A., Steiner S., Stalder H., Thiel V. Coronavirus biology and replication: implications for SARS-CoV-2. Nat. Rev. Microbiol. 2021;19:155–170. doi: 10.1038/s41579-020-00468-6. - DOI - PMC - PubMed
    1. Malone B., Urakova N., Snijder E.J., Campbell E.A. Structures and functions of coronavirus replication–transcription complexes and their relevance for SARS-CoV-2 drug design. Nat. Rev. Mol. Cell Biol. 2022;23:21–39. doi: 10.1038/s41580-021-00432-z. - DOI - PMC - PubMed
    1. Snijder E.J., Decroly E., Ziebuhr J. The nonstructural proteins directing coronavirus RNA synthesis and processing. Adv. Virus Res. 2016;96:59–126. doi: 10.1016/bs.aivir.2016.08.008. - DOI - PMC - PubMed
    1. Sola I., Almazán F., Zúñiga S., Enjuanes L. Continuous and discontinuous RNA synthesis in coronaviruses. Annu. Rev. Virol. 2015;2:265–288. doi: 10.1146/annurev-virology-100114-055218. - DOI - PMC - PubMed
    1. Maranon D.G., Anderson J.R., Maranon A.G., Wilusz J. The interface between coronaviruses and host cell RNA biology: novel potential insights for future therapeutic intervention. Wiley Interdiscip. Rev. RNA. 2020;11 doi: 10.1002/wrna.1614. - DOI - PMC - PubMed

Publication types