. 2023 Oct 11;31(10):1604-1619.e10.
doi: 10.1016/j.chom.2023.09.002. Epub 2023 Oct 3.

An early-life microbiota metabolite protects against obesity by regulating intestinal lipid metabolism

Affiliations

An early-life microbiota metabolite protects against obesity by regulating intestinal lipid metabolism

Catherine D Shelton et al. Cell Host Microbe. .

Abstract

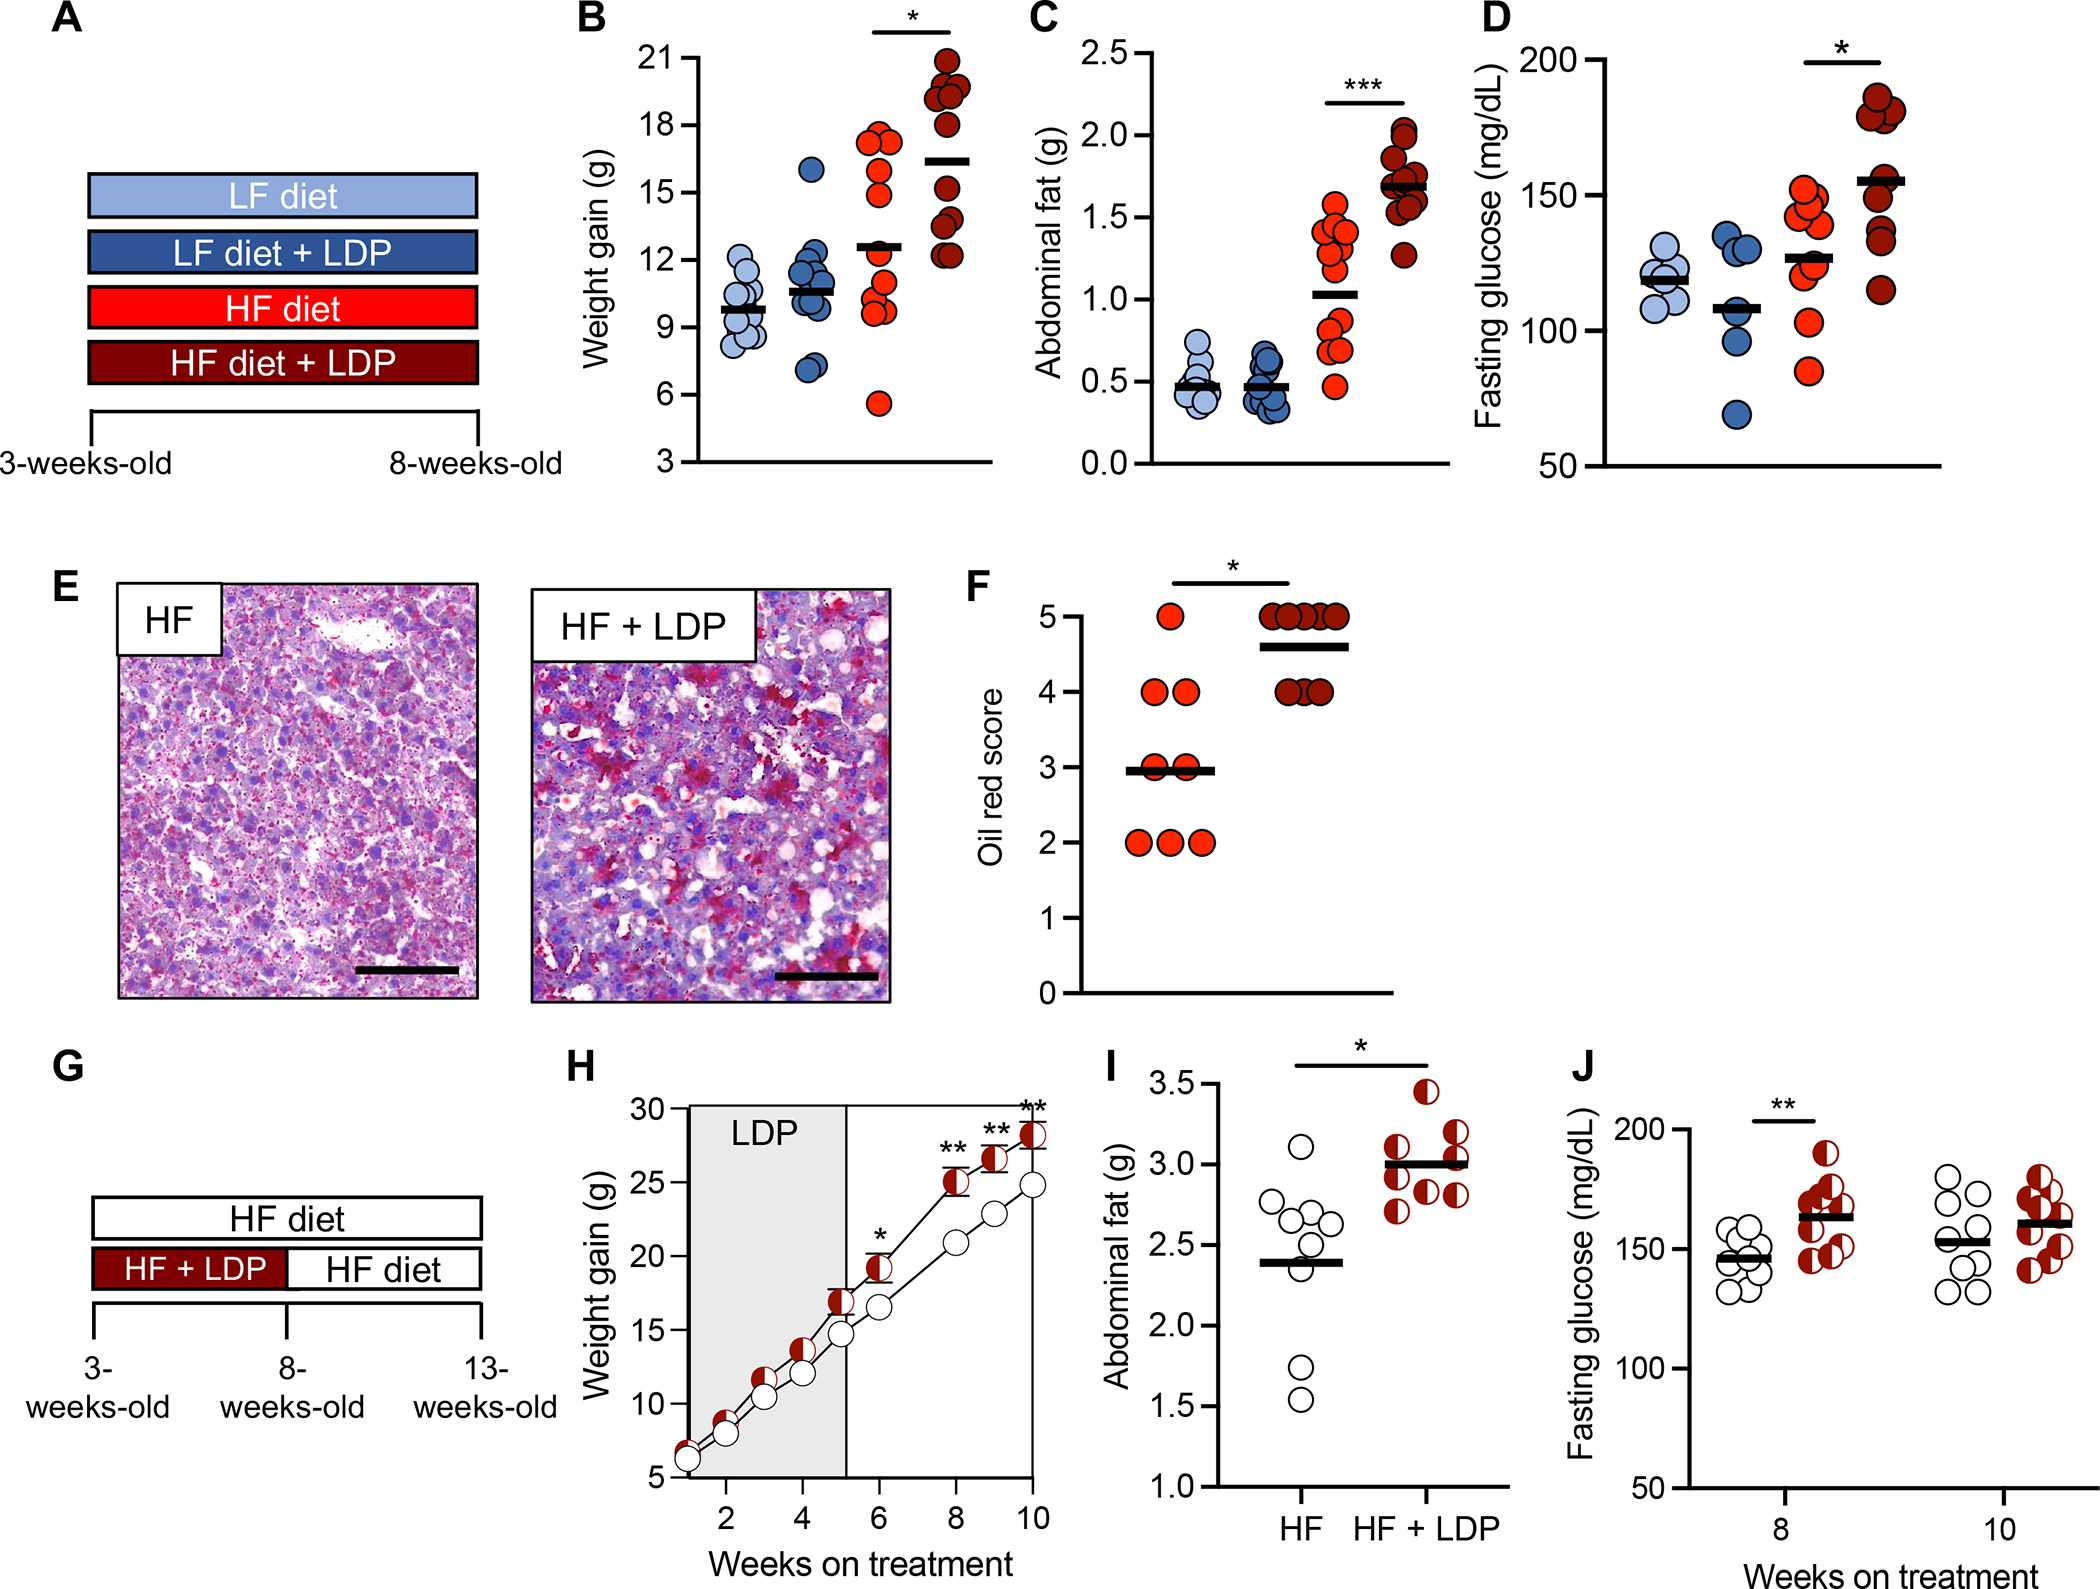
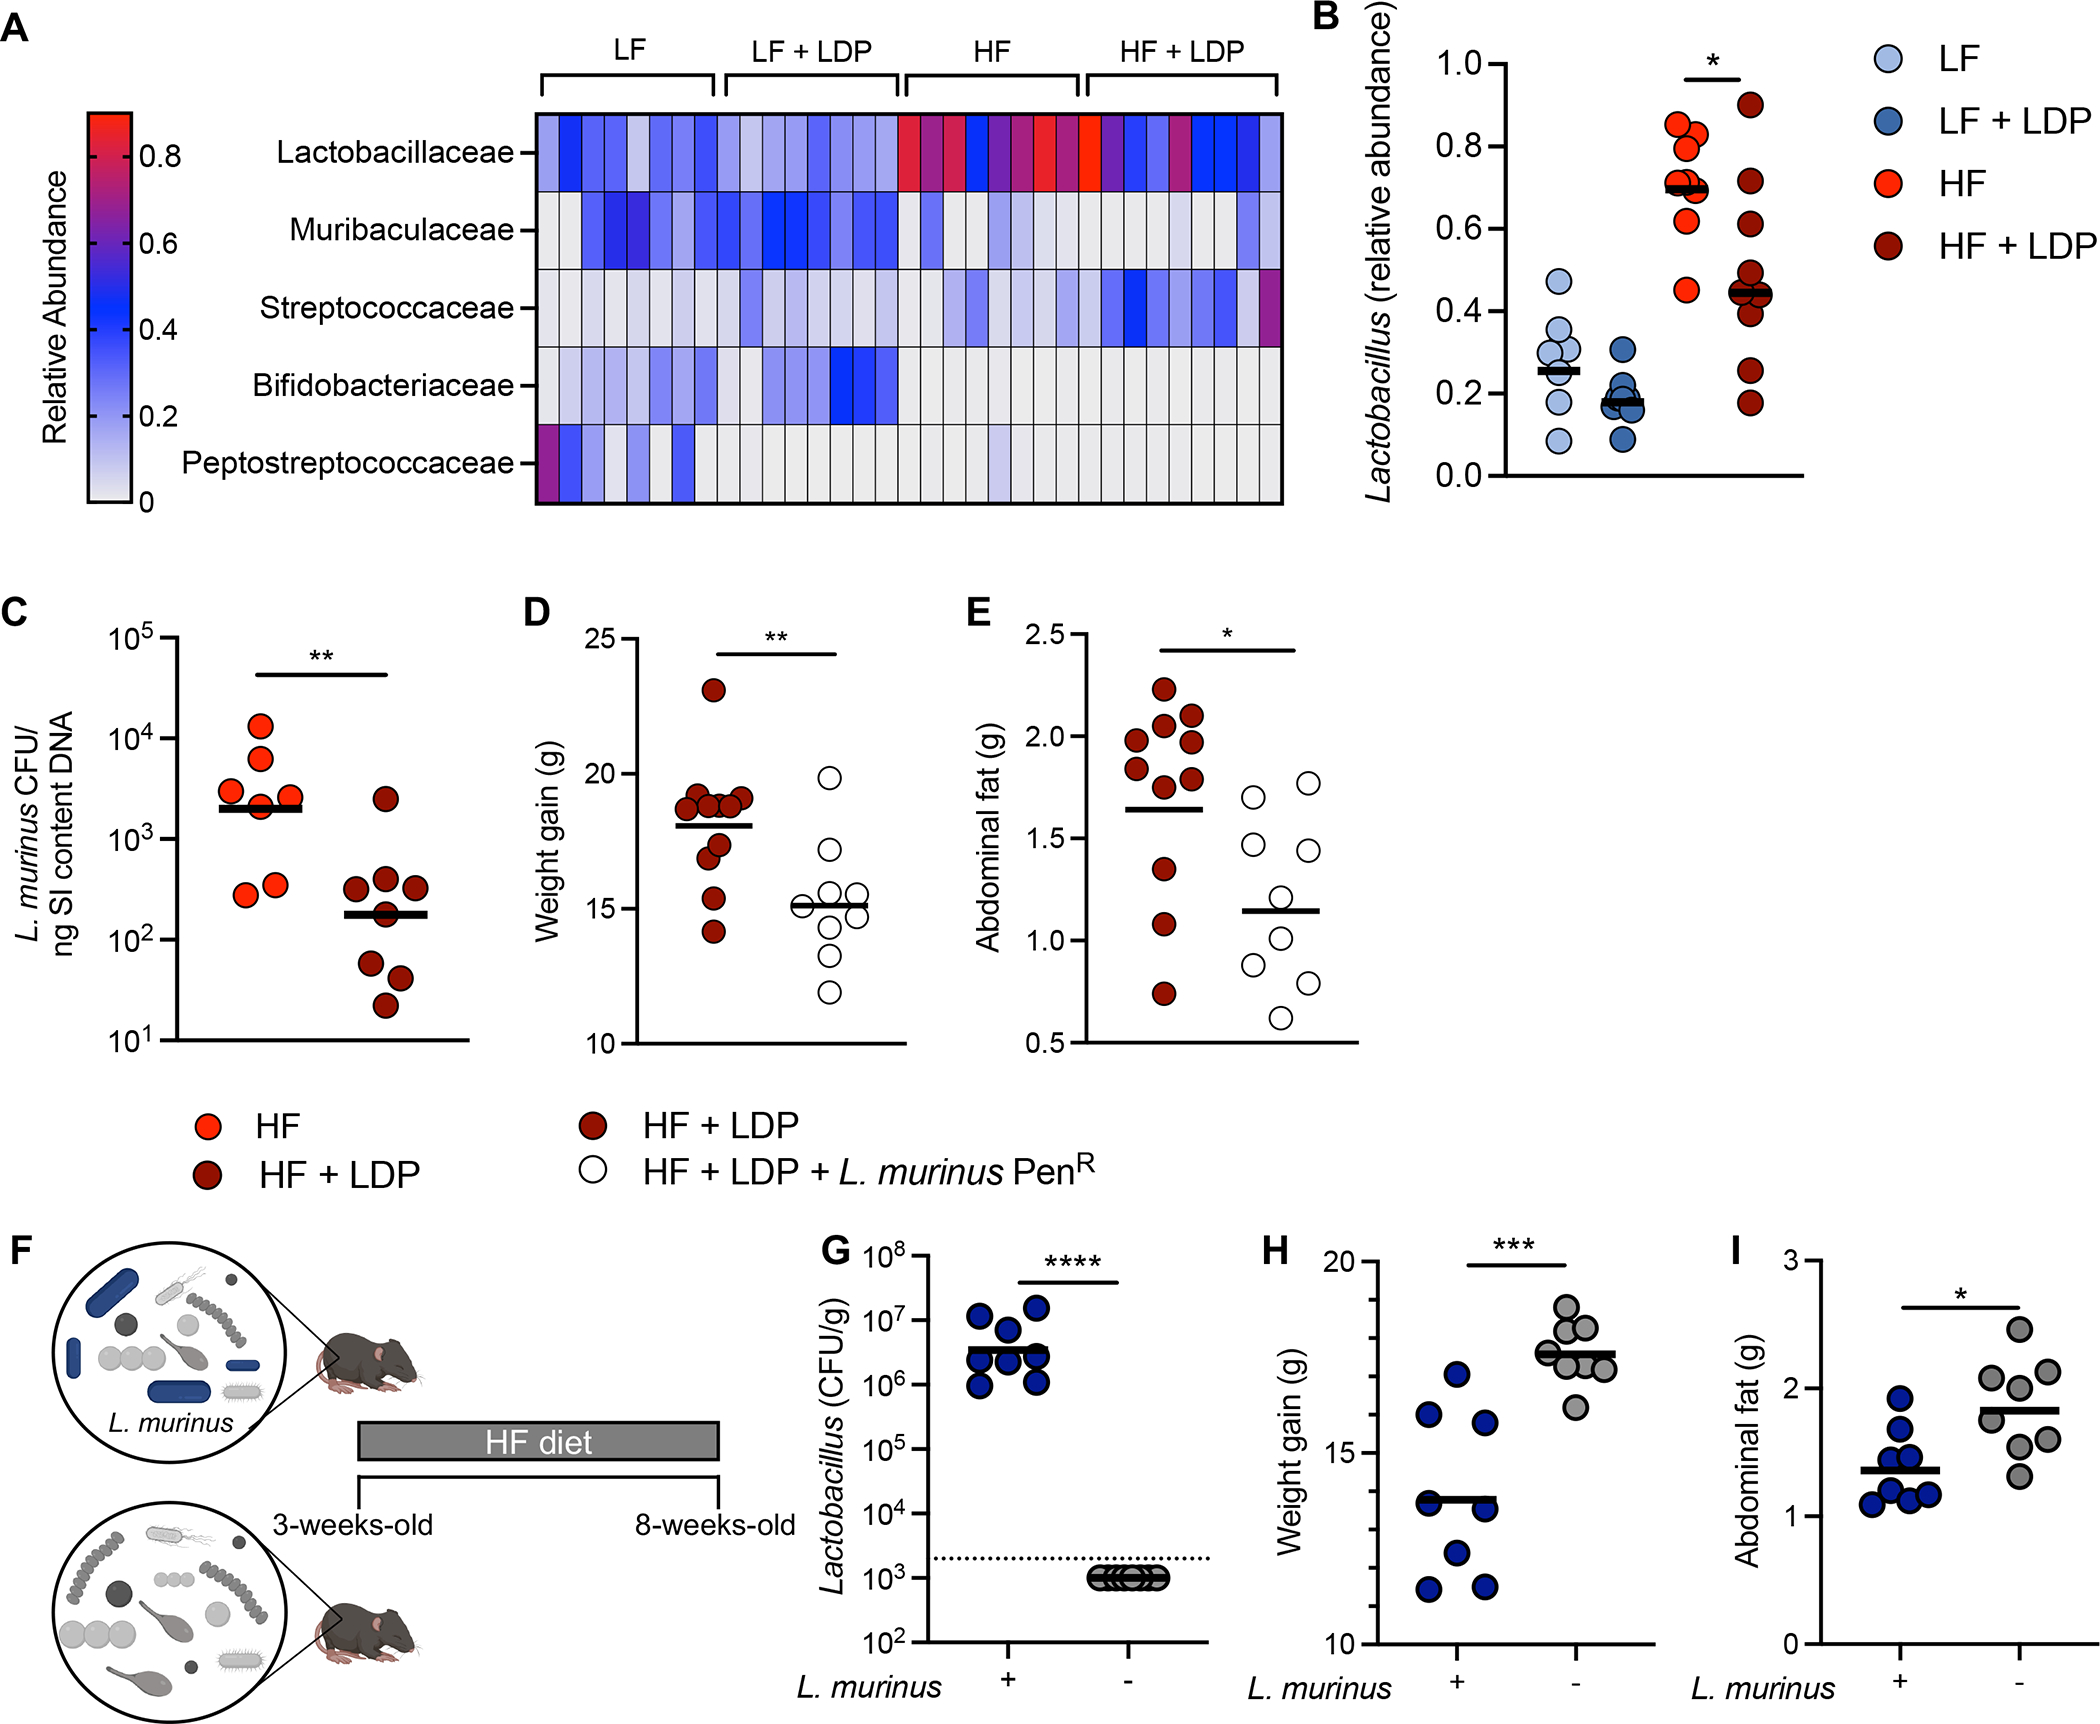
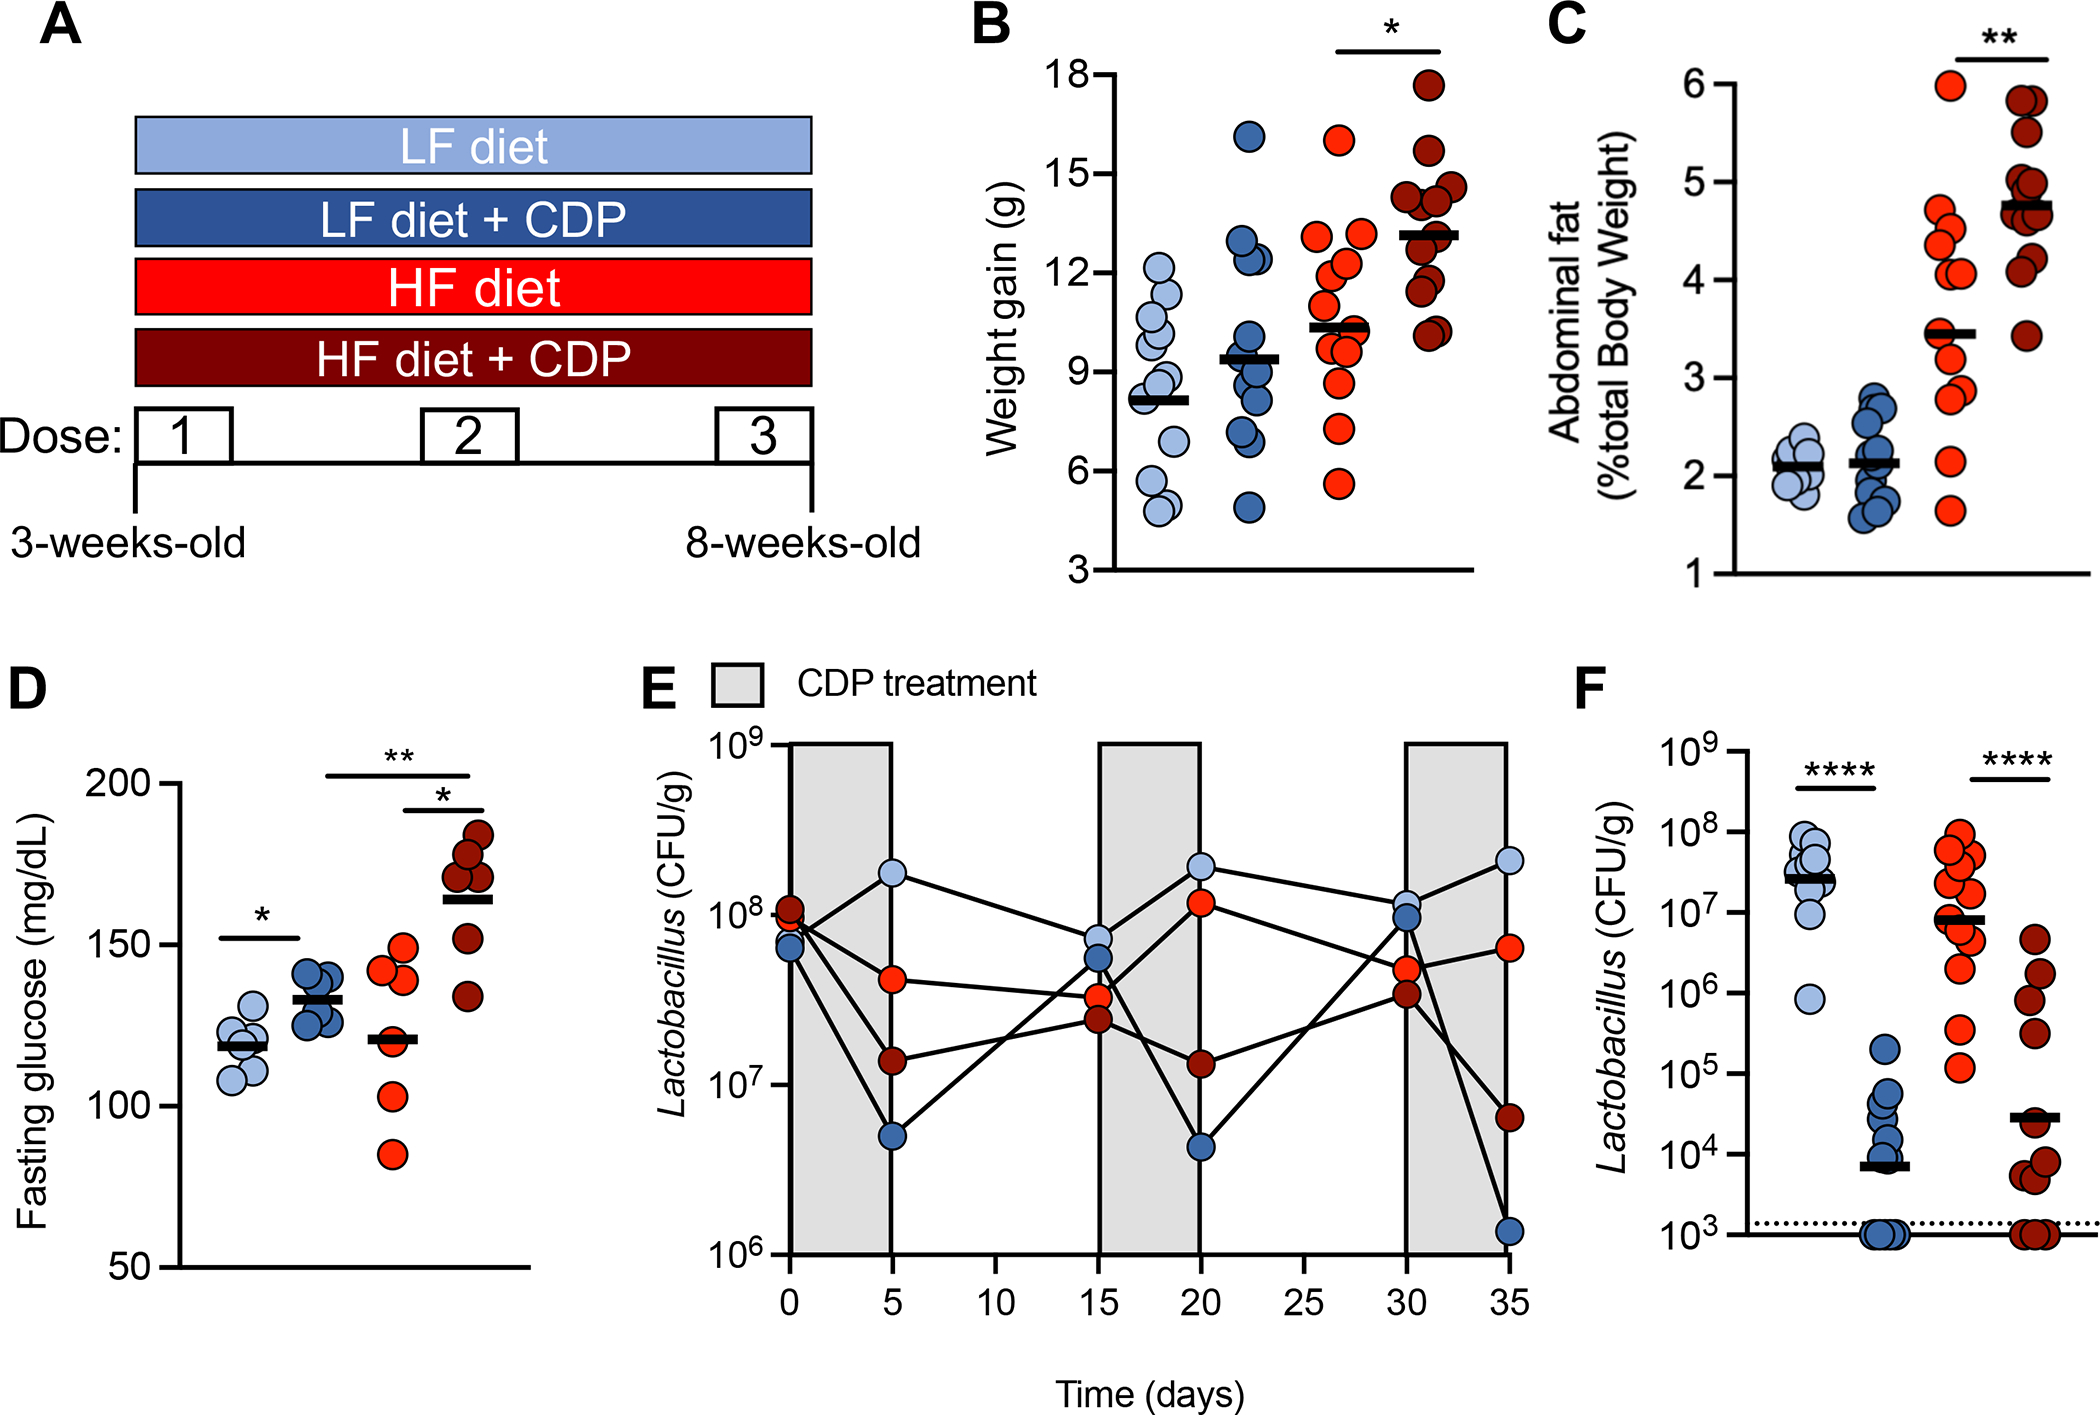
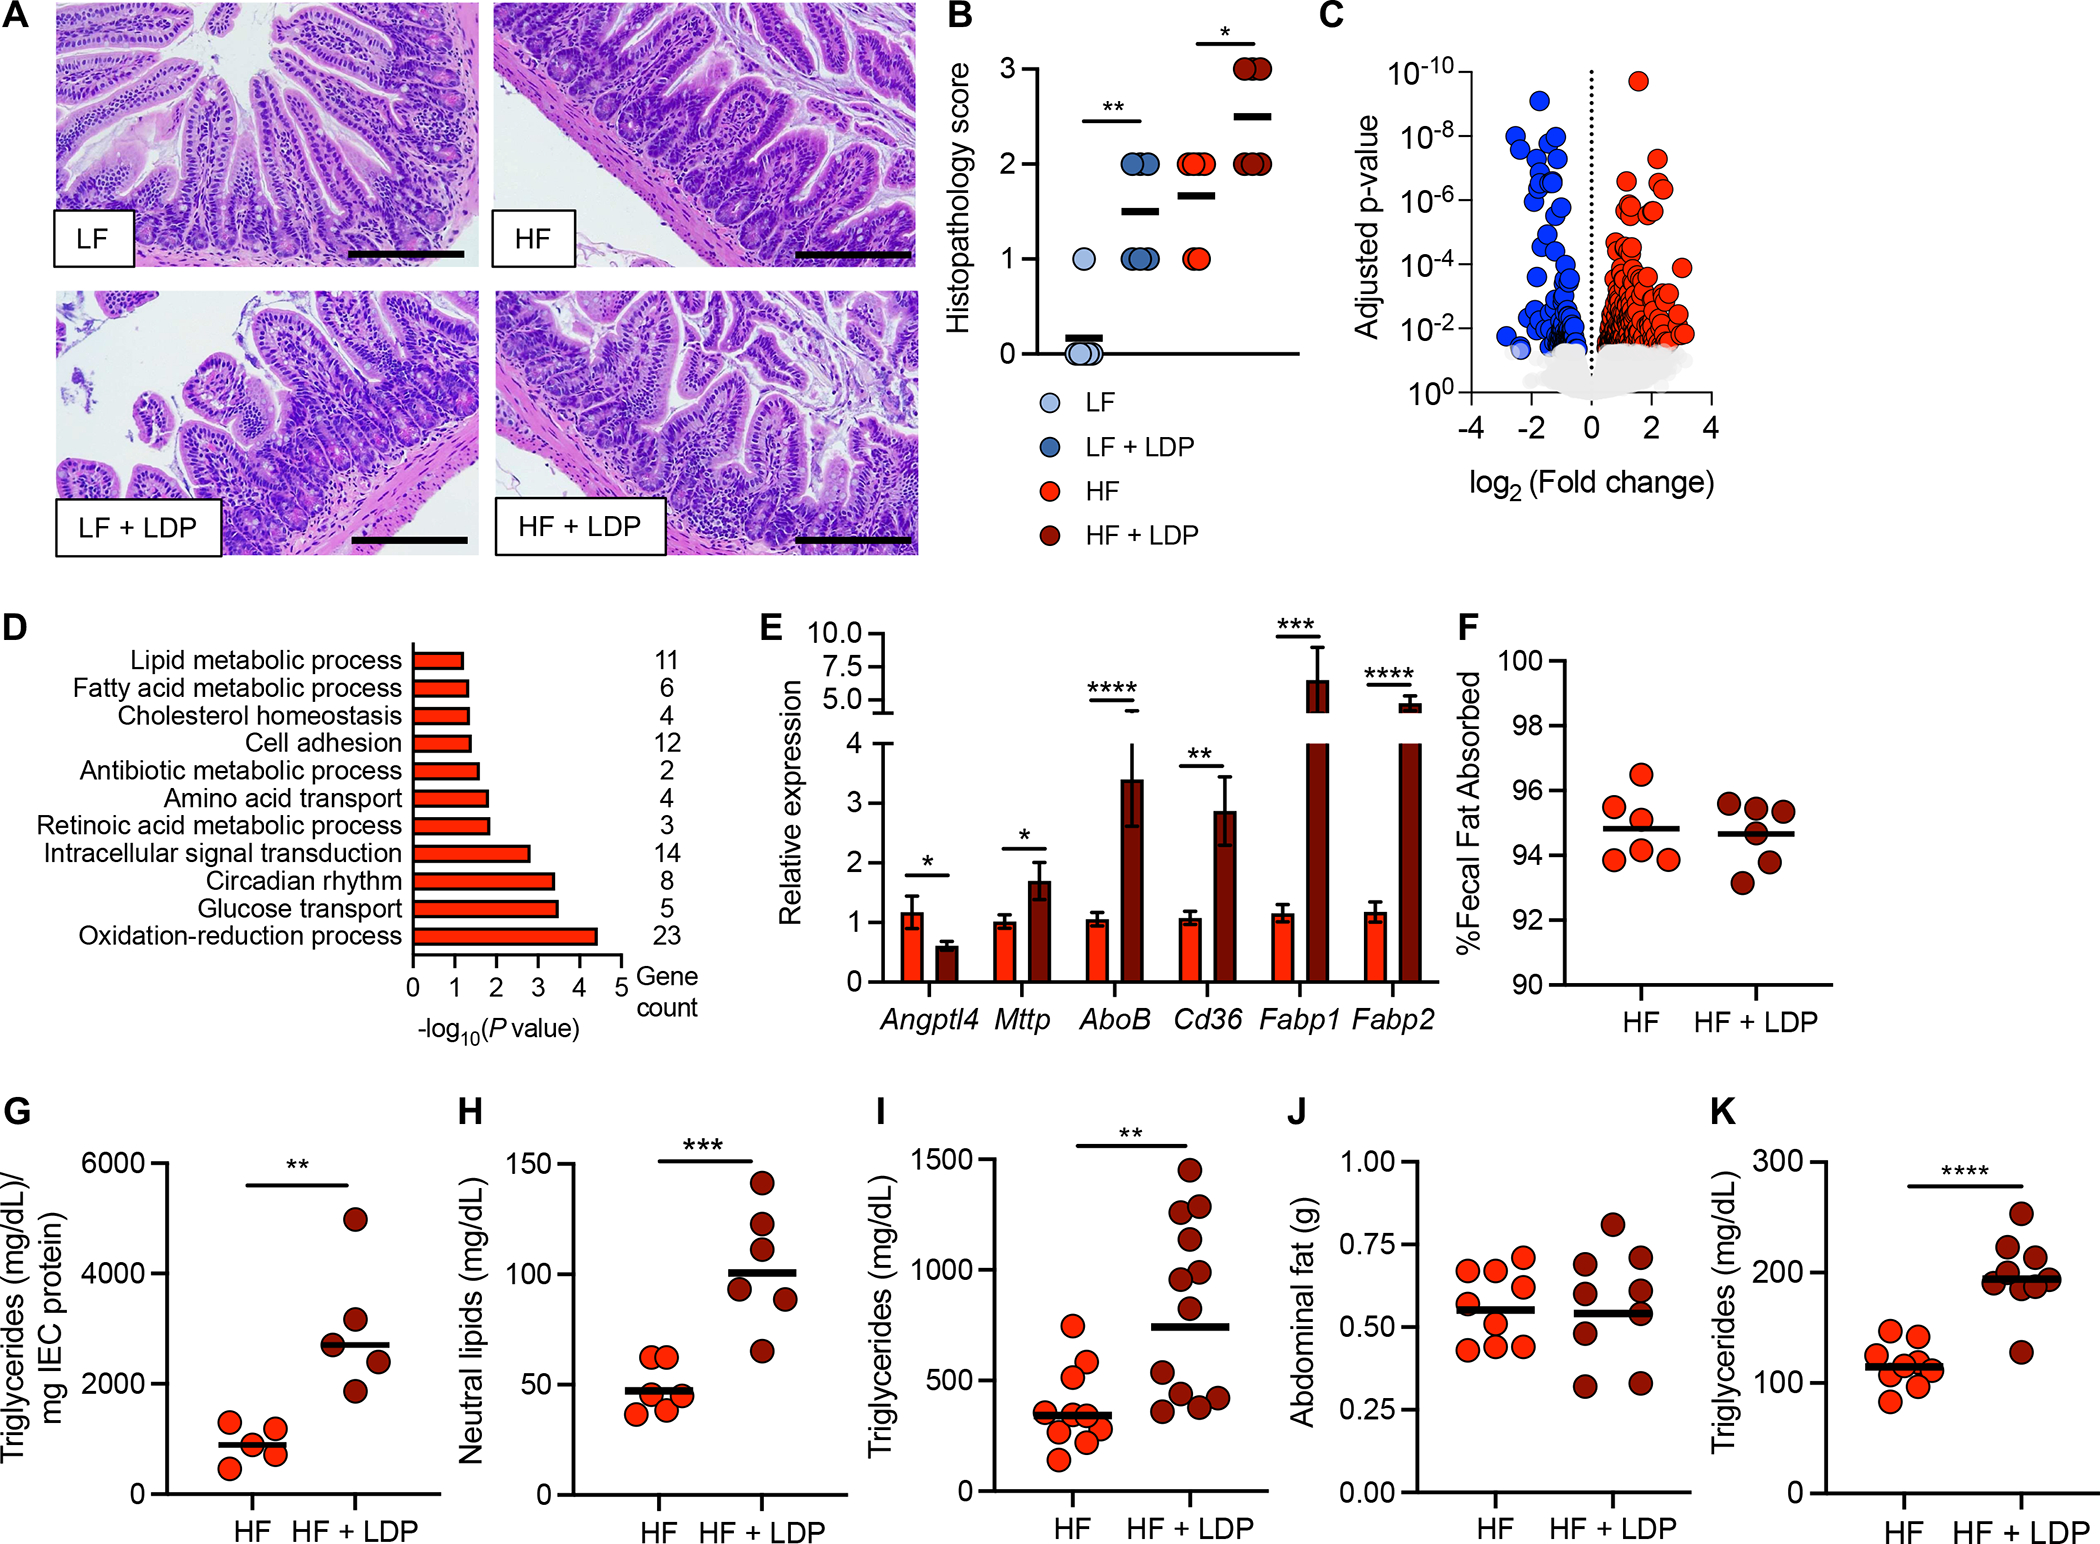
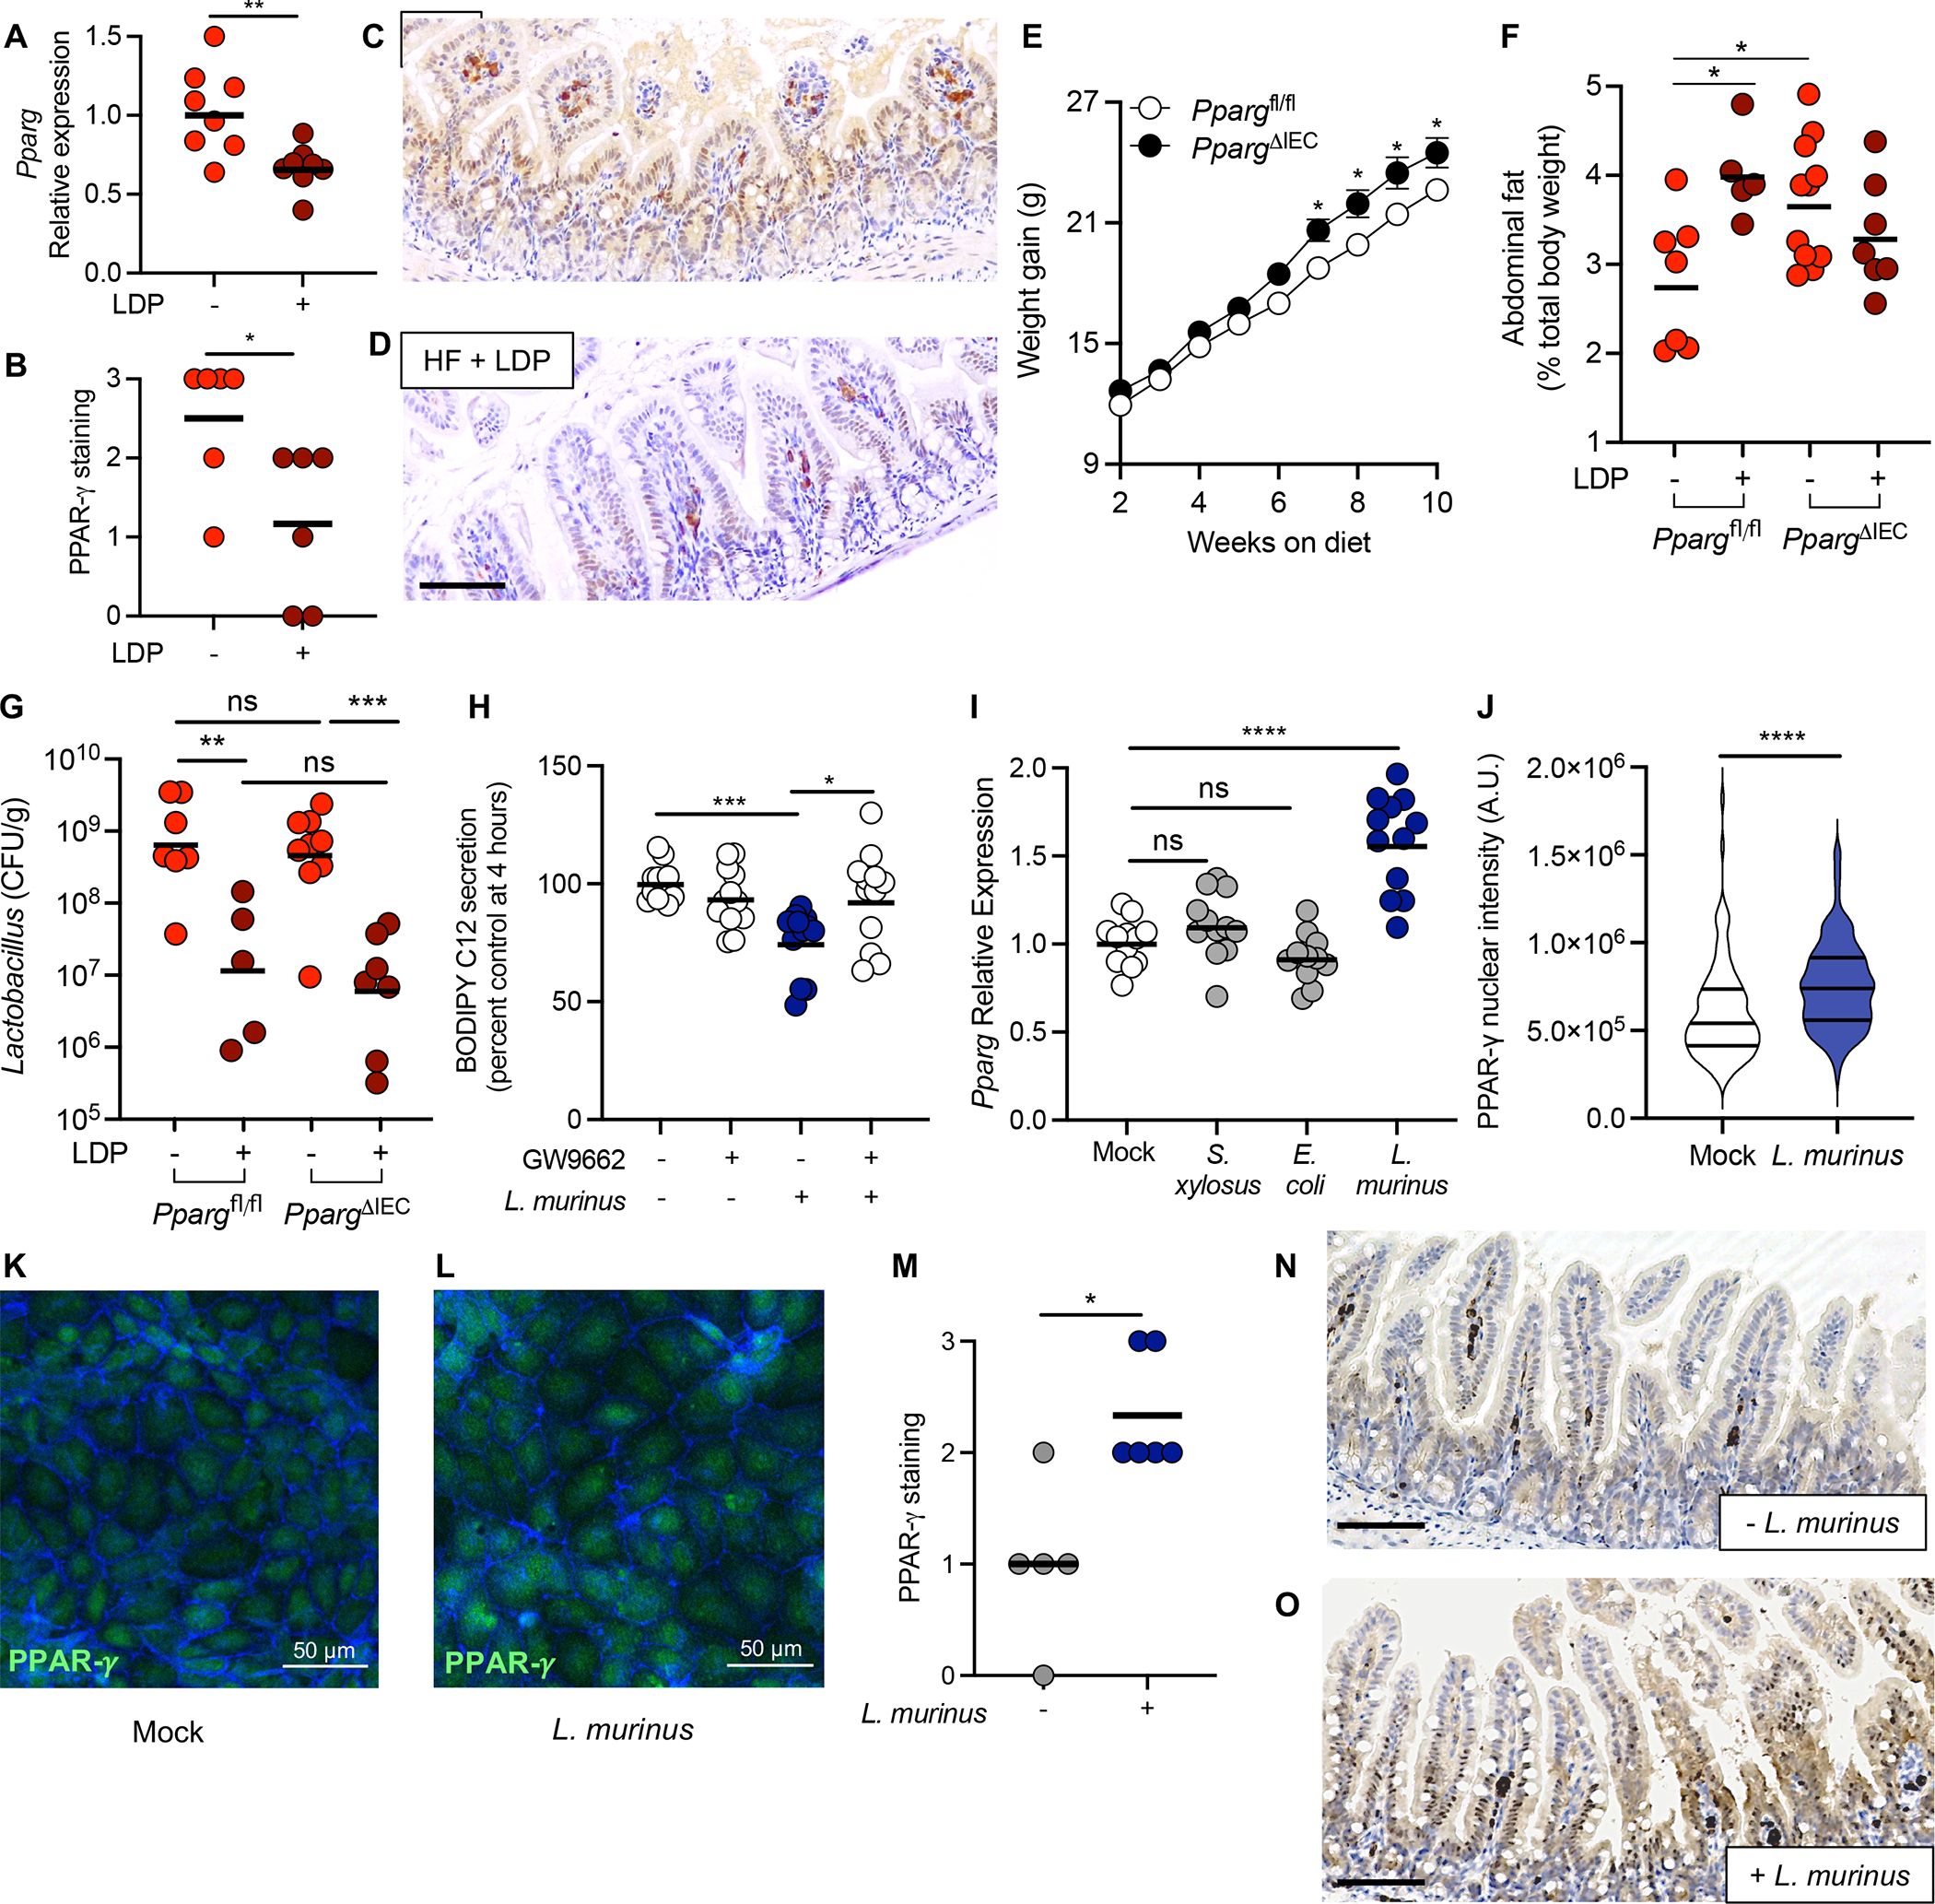
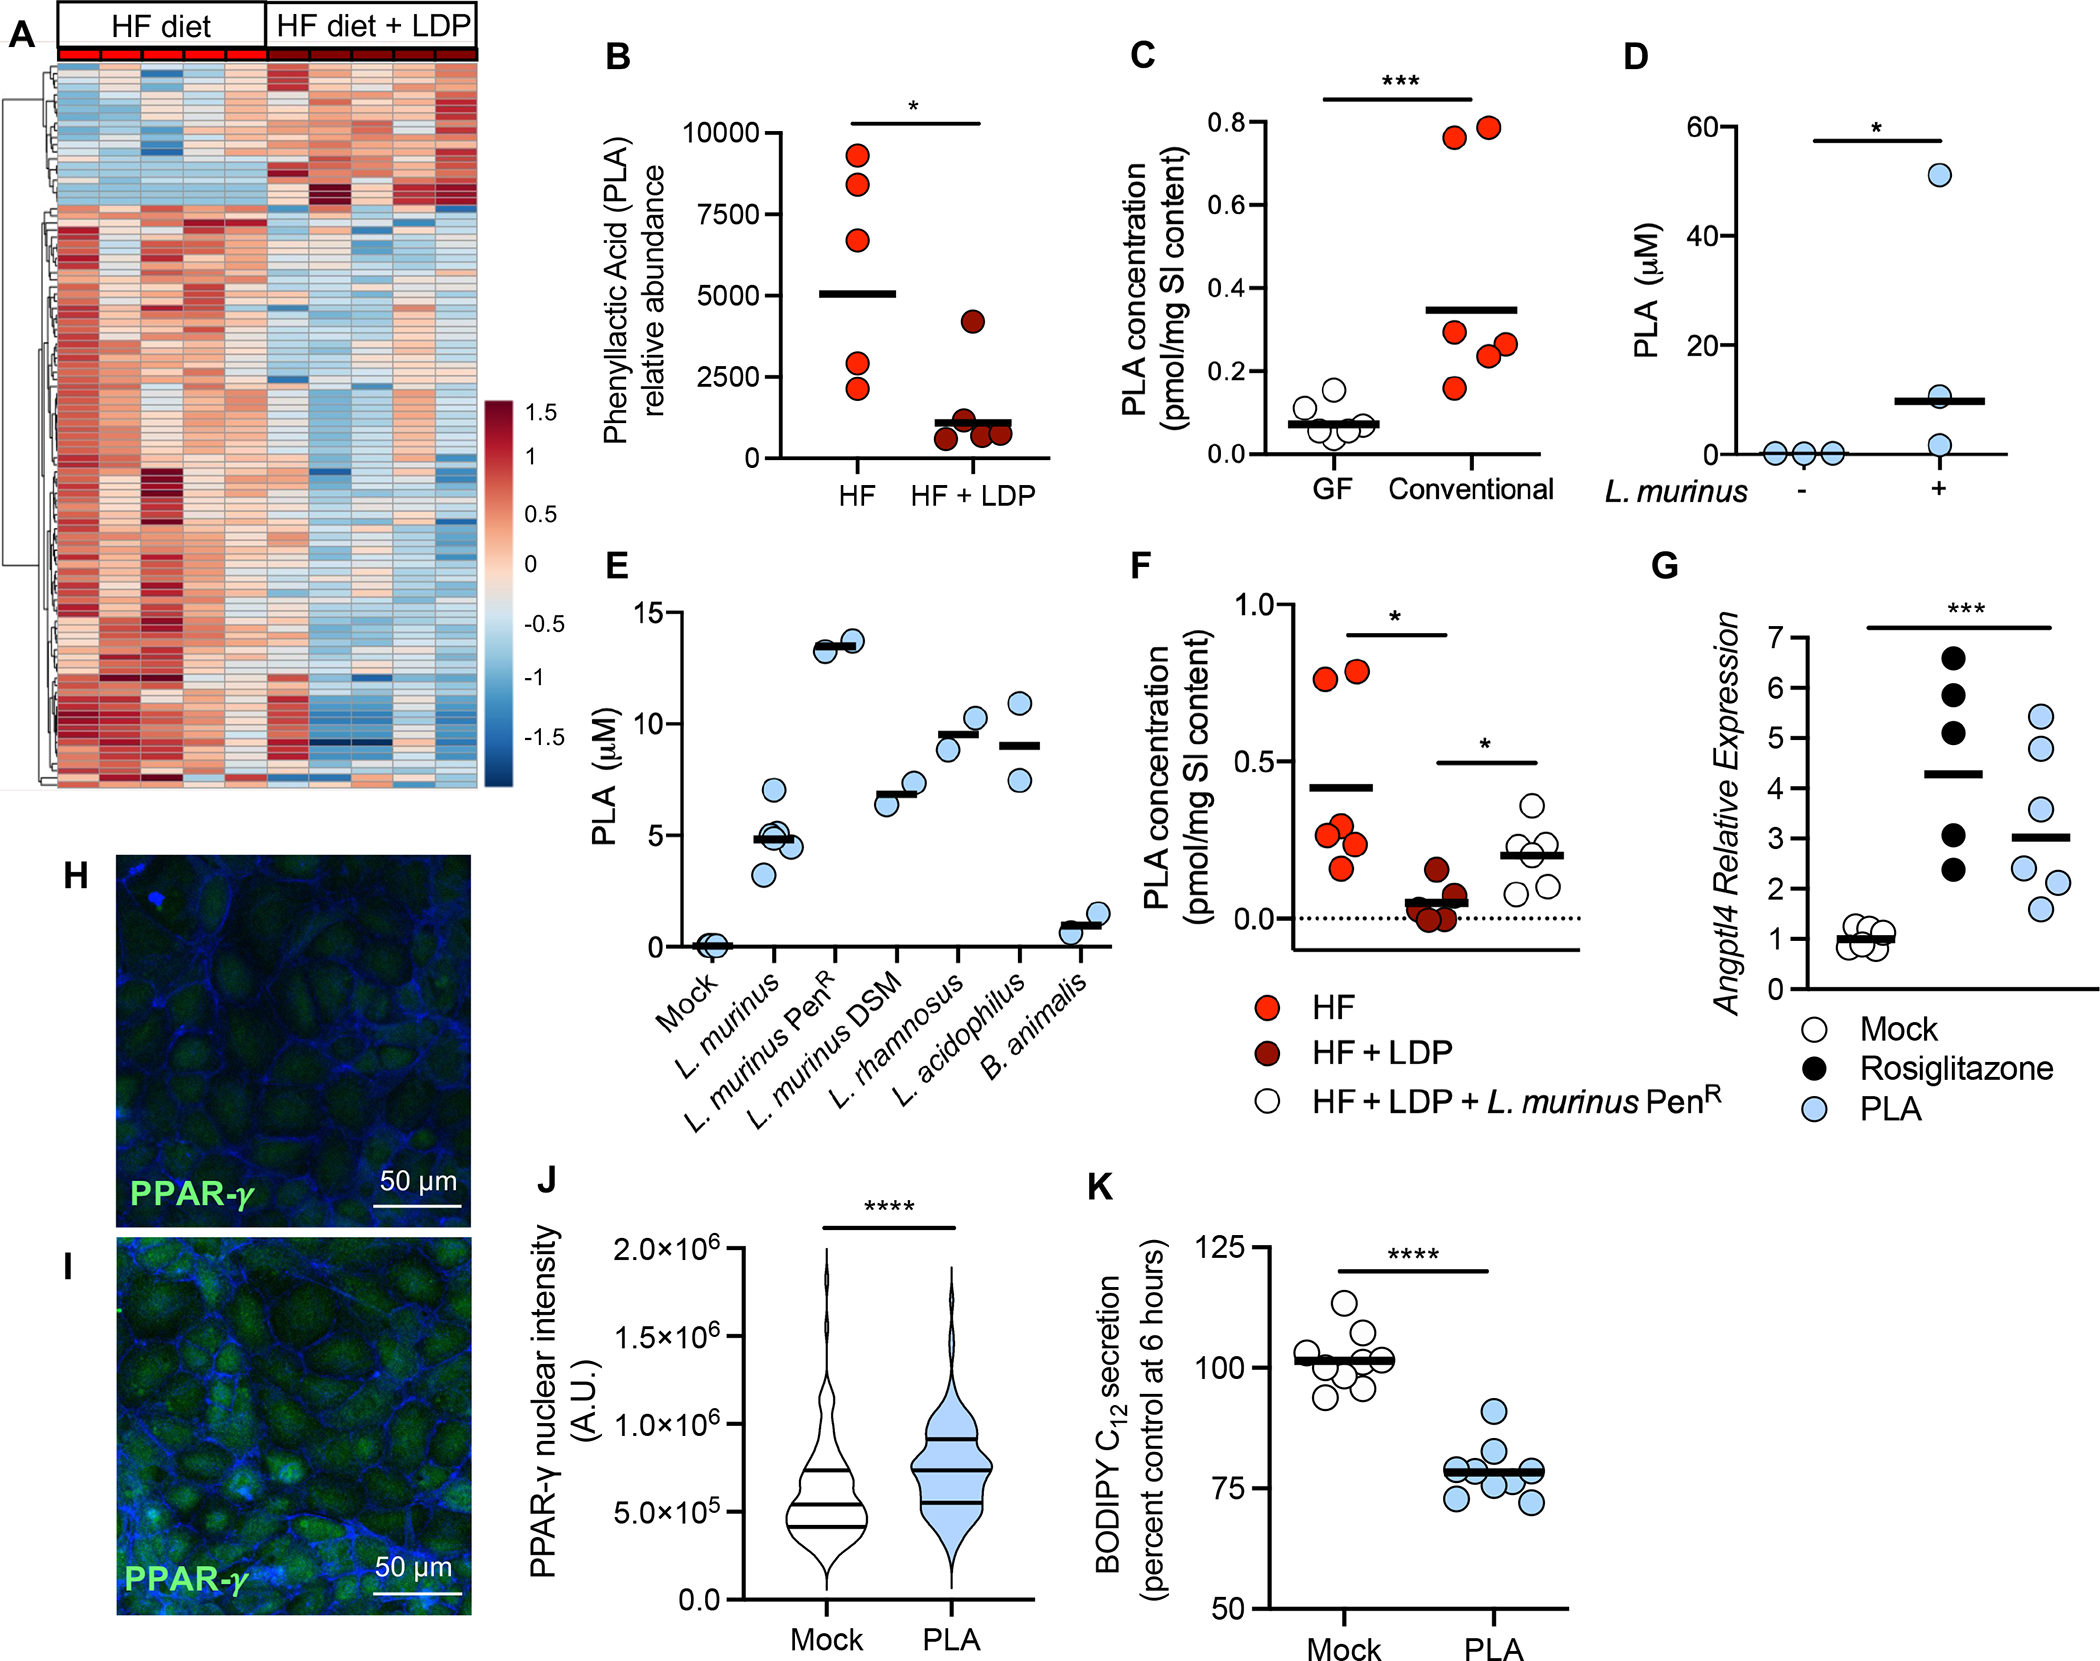
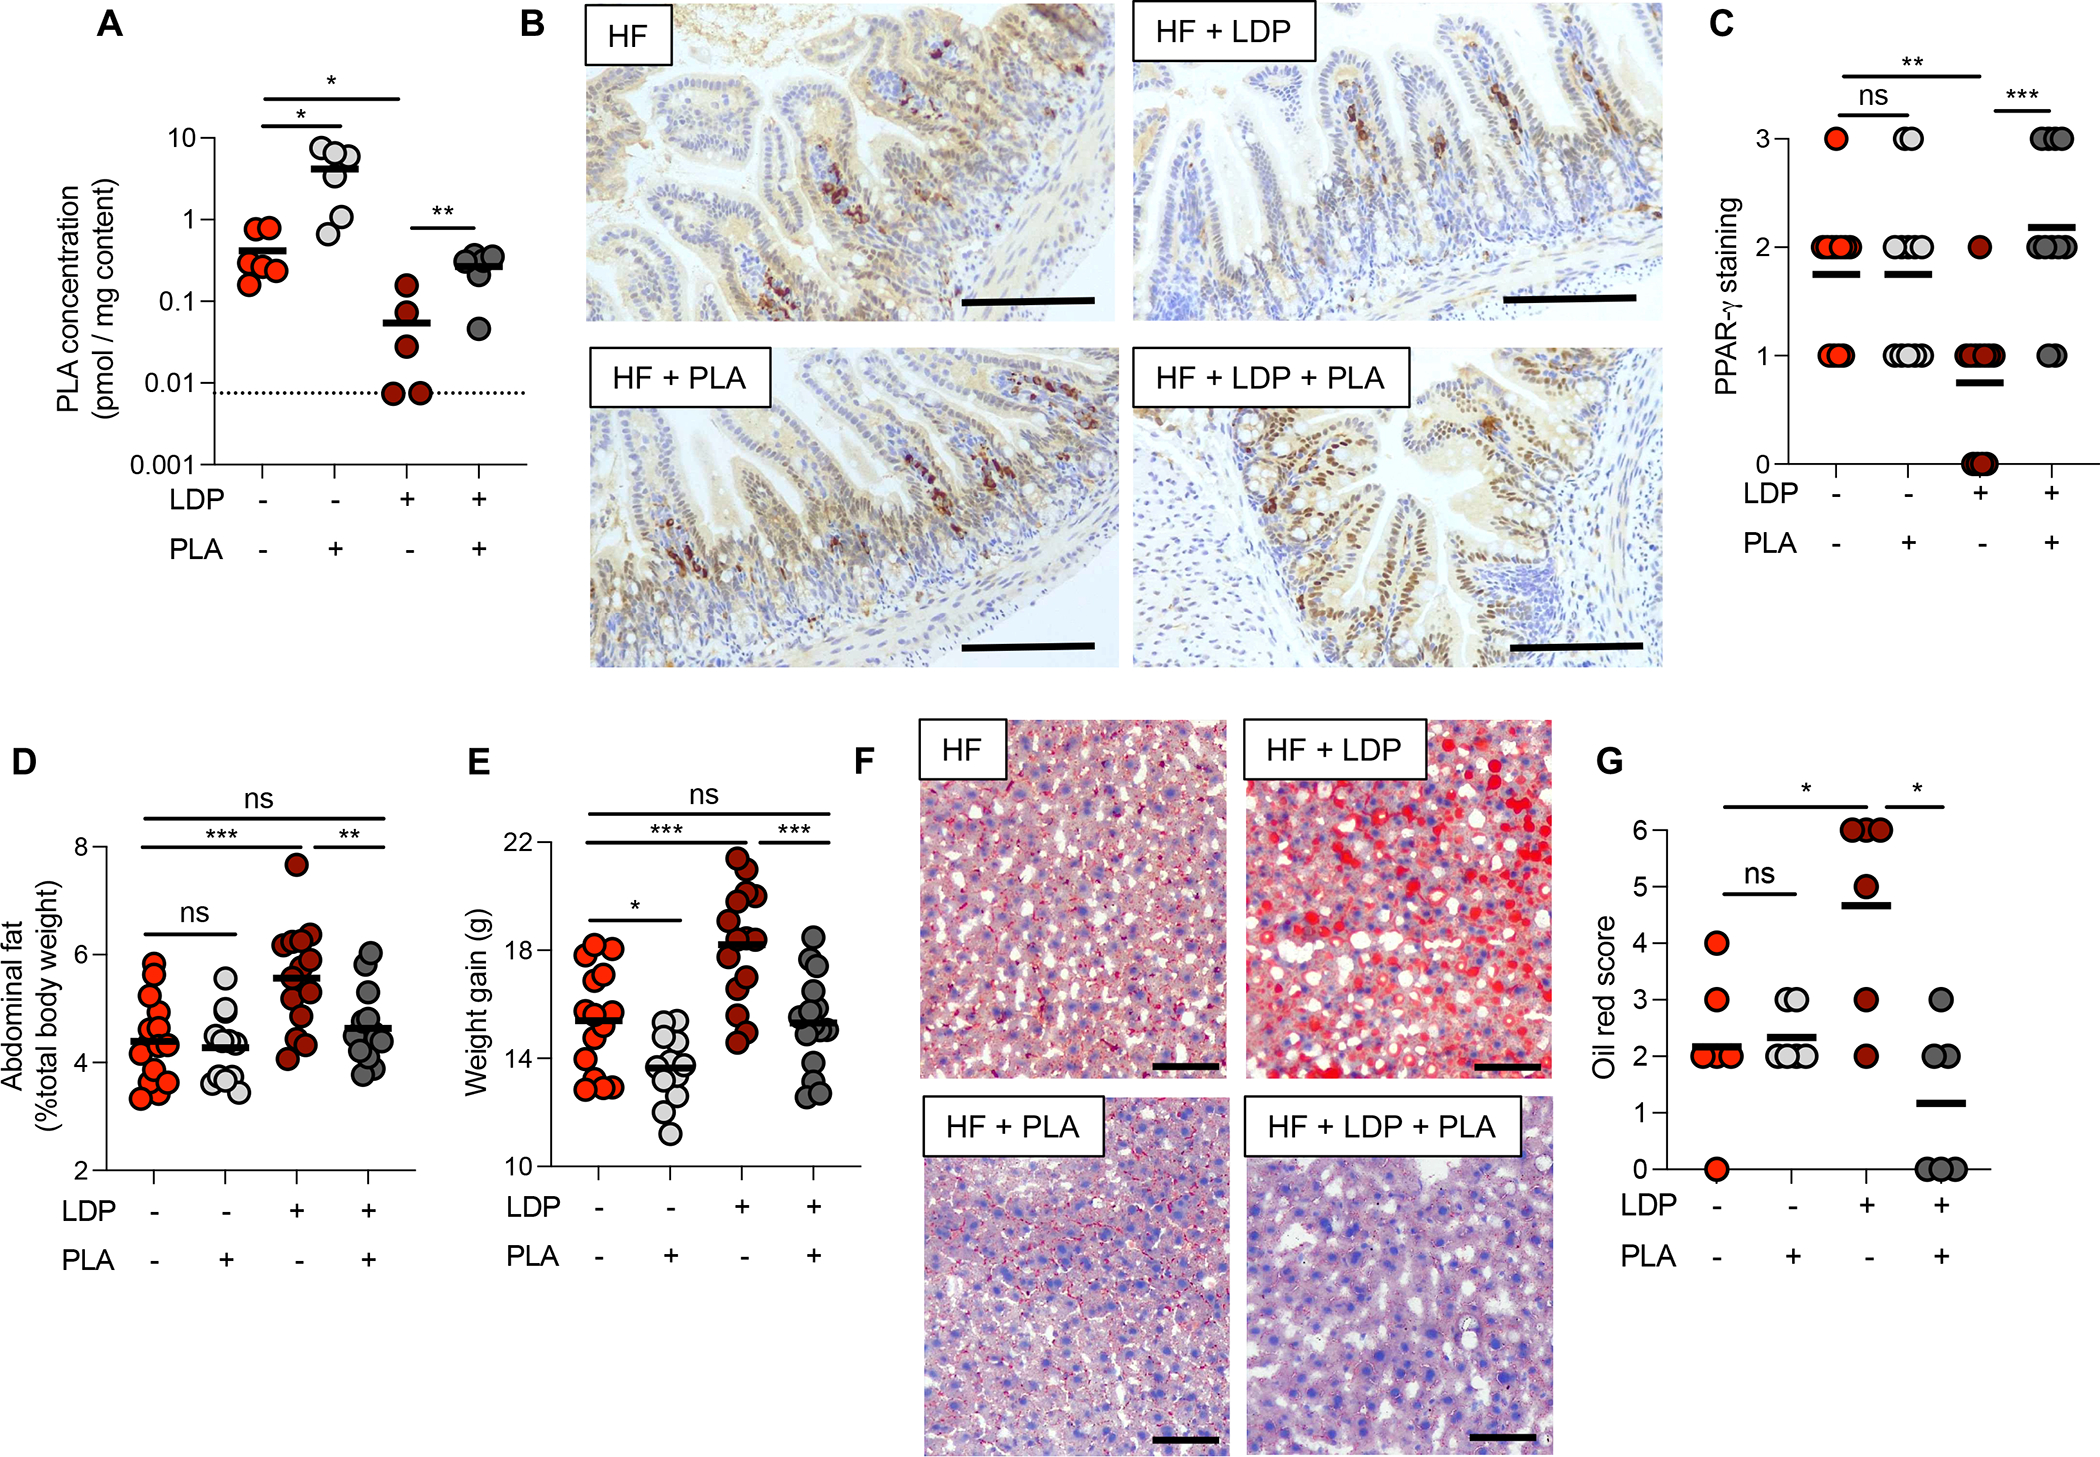
The mechanisms by which the early-life microbiota protects against environmental factors that promote childhood obesity remain largely unknown. Using a mouse model in which young mice are simultaneously exposed to antibiotics and a high-fat (HF) diet, we show that Lactobacillus species, predominant members of the small intestine (SI) microbiota, regulate intestinal epithelial cells (IECs) to limit diet-induced obesity during early life. A Lactobacillus-derived metabolite, phenyllactic acid (PLA), protects against metabolic dysfunction caused by early-life exposure to antibiotics and a HF diet by increasing the abundance of peroxisome proliferator-activated receptor γ (PPAR-γ) in SI IECs. Therefore, PLA is a microbiota-derived metabolite that activates protective pathways in the small intestinal epithelium to regulate intestinal lipid metabolism and prevent antibiotic-associated obesity during early life.

Keywords: Lactobacillus; antibiotics; arachnoid barrier; brain fibroblasts; early-life; intestinal epithelium; leptomeninges; metabolism; microbiota; obesity; single-cell RNA sequencing; tricellular junction.


Conflict of interest statement

Declaration of interests The authors declare no competing interests.

Figures

Figure 1.
Figure 1.. Early-life exposure to low dose penicillin (LDP) and a high fat (HF) diet promotes metabolic dysfunction.
(A, G) Schematics of the experimental models and the groups used. (B) Weight gain, (C) abdominal fat (g), and (D) fasting glucose levels of mice in each group after 5 weeks. (E) Representative images of oil red O-stained sections of liver from HF diet and HF diet + LDP-treated mice. Scale bar represents 100 μm. (F) Combined oil red scores from livers of mice given a HF diet or a HF diet + LDP. (H) Weight gain of mice in each group over the course of the 10-week experiment. (I) Abdominal fat (g) measured after the 10-week diet and antibiotic manipulations. (J) Fasting glucose levels were measured after 8 and 10 weeks on a HF diet. (B – D, F, I, and J) Each dot represents one animal. Bars represent geometric mean. (H) Dots represent mean ± standard error of the mean. (B, C) N = 12 mice/group. Data representative of two independent cohorts (D, F, H – J) N = 9 mice/group. Data representative of one independent cohort. (B-D, I - J) *, p < 0.05; **, p < 0.01; ***, p < 0.005 using an unpaired two-tailed Student’s t test. (F) *, p < 0.05 using Mann-Whitney test. (H) *, p < 0.05; **, p < 0.01 using multiple unpaired two-tailed Student’s t tests.
Figure 2.
Figure 2.. Ligilactobacillus murinus protects against adiposity during early-life consumption of a HF diet.
(A) Heat map showing differential abundance of the 5 most abundant families in the small intestine microbiota of mice after 5 weeks of treatment. (B) Relative abundance of the genus Lactobacillus in the small intestine microbiota as determined by 16S rRNA sequencing. (C) The abundance of L. murinus in the small intestine as determined by qPCR. (D) Weight gain and (E) abdominal fat of mice given a HF diet and LDP alone or gavaged with a penicillin resistant strain of L. murinus (L. murinus PenR) after 5 weeks. (F) A schematic representation of the gnotobiotic experiment. (G) Lactobacillus abundance (colony forming unit (CFU) / gram) in small intestine (SI) after 5 weeks on a HF. Dotted line indicates limit of detection for Lactobacillus species in this experiment. (H) Weight gain and (I) abdominal fat (g) of mice after 5 weeks. Each dot represents one animal. Bars represent geometric mean. (A) N = 5 mice/group; (B) N = 9 mice/group; (C) N = 7 – 8 mice/group; (D – E) N = 12 mice/group; (G – H) N = 8 mice/group. Data representative of two independent cohorts. *, p < 0.05; **, p < 0.01; ***, p < 0.005; ****, p < 0.001 using an unpaired two-tailed Student’s t test.
Figure 3.
Figure 3.. Repeated treatment with clinical doses of penicillin (CDP) and a high fat diet promote increased adiposity.
(A) A schematic of the experimental model and the groups used. (B) Weight gain, (C) percent abdominal fat, and (D) fasting glucose levels of mice after 5 weeks. (E) Lactobacillus abundance (Colony forming unit (CFU) / gram in the feces of treated mice over the course of the 5-week experiment. (F) Lactobacillus abundance in the small intestine was determined after 5 weeks. (A – D, F) Each dot represents one animal. Bars represent geometric mean. N = 12 mice/group. (E) Dots indicate geometric mean of abundances from six mice. *, p < 0.05; **, p < 0.01; ****, p < 0.001 using an unpaired two-tailed Student’s t test.
Figure 4.
Figure 4.. Exposure to early-life antibiotics alters the response of the intestinal epithelium to a high fat diet.
(A) Hematoxylin and eosin-stained sections of the ileum from mice after 5 weeks of exposure to a LF or HF diet ± LDP. (B) Histopathology scores of ileum sections. Scale bar represents 200 μm. (C and D) RNA-sequencing analysis of epithelial cells isolated from the ileum (IECs) of mice after 5 weeks of exposure to a HF diet or a HF diet + LDP. (C) Volcano plot of genes significantly (an adjusted p-value < 0.05) upregulated (red) and downregulated (blue) in mice exposed to a HF diet + LDP compared to mice given only a HF diet. (D) Enriched GO (gene ontology) categories in IECs of mice fed a HF diet + LDP-treatment. (E) Epithelial transcripts of the indicated genes measured by qPCR in mice given a HF diet or a HF diet and LDP. (F) Fecal fat absorption was measured after exposure to a HF diet or HF diet and LDP for 5 weeks. (G - I) Mice exposed to a HF diet or a HF diet and LDP for 5 weeks were fasted and (G) triglyceride abundance in IECs and (H) neutral lipids in the serum were measured. (I) An oral fat tolerance test was performed in mice given a HF diet or a HF diet and LDP for 5 weeks. Serum triglyceride concentration was measured two hours after the bolus of olive oil. (J) Abdominal fat (g) and (K) fasting triglycerides of mice given a HF diet or a HF diet and LDP for 2 weeks. (B and E) Bars represent mean ± standard error of the mean (SEM). (F – K) Bars represent geometric mean. Each dot represents one animal. (B) N = 6 mice/group. Data representative of one independent cohort; (C – D) N = 3 mice/group. (E) N = 14 mice/group. Data representative of 2 independent cohorts. (F – H) N = 5–6 mice/group. Data representative of one independent cohort. (I) N =12 mice/group. Data representative of one independent cohort. (J– K) N = 9 mice/group. Data representative of one independent cohort. (B)*, p < 0.05; **, p < 0.01 using a one-tailed Mann-Whitney test. (E – K) *, p < 0.05; **, p < 0.01; ***, p < 0.005; ****, p < 0.001 using an unpaired two-tailed Student’s t test.
Figure 5.
Figure 5.. Loss of intestinal PPAR-γ signaling promotes increased adiposity due to exposure to LDP and a HF diet.
(A) Expression of Pparg in the ileum epithelium of HF diet or HF diet + LDP-treated mice measured by qPCR. (B) PPAR-γ abundance in the epithelium was quantified by scoring stained sections of the ileum. (C – D) Representative images of PPAR-γ staining in HF diet fed mice (C) and HF diet fed + LDP-treated mice (D). Scale bar represents 200 μm. (E) 3-week-old Ppargfl/flVillincre/− mice (PpargΔIEC) and littermate control Ppargfl/flVillin−/− mice (Ppargfl/fl) were fed a HF diet for 10 weeks and weight gain was determined weekly. (F) Abdominal fat (% total body weight) and (G) Lactobacillus abundance (colony forming unit (CFU) / gram) in the small intestine (SI) of PpargΔIEC and Ppargfl/fl measured after the 6-week diet and antibiotic manipulations. (H - L) Intestinal epithelial cells were infected with Ligilactobacillus murinus (L. murinus) at an MOI of 100. (H) Amount of BODIPY C12 secreted by treated Caco-2 cells was measured 4 hours after addition of lipid micelles. (I) Immortalized mouse small intestinal epithelial (MSIE) cells were mock-treated or treated with E. coli Mt1B1, S. xylosus 33-ERD13C, or L. murinus, before expression of Pparg was measured using qPCR. (J - L) MSIE cells were treated with L. murinus (L) or left untreated (K) and incubated for 16 hours. Cells were subsequently stained with anti-PPAR-γ and phalloidin to stain for F-actin. (J) PPAR-γ nuclear intensity was quantified using ImageJ; 15 cells were selected from 2 images from 3 independent experiments. (M - O) Germ-free mice were colonized with a defined microbiota with or without L. murinus and placed on a HF diet for 5 weeks. (M) PPAR-γ abundance in the epithelium was quantified by scoring stained sections of the ileum. Representative images of PPAR-γ staining in mice colonized with (O) or without (N) L. murinus. Scale bar represents 200 μm. (A, F, G) Each dot represents one animal. Bars represent geometric mean. N = 5 – 7 mice/group. (B and M) Each dot represents one animal. Bars represent mean. N = 6 – 7 mice/group. Data representative from one independent cohort. (E) Dots represent mean +/− SEM (N = 8 – 9/ genotype). (H and I) Each dot represents one technical replicate (Data shown from 3 biological replicates). Bars represent geometric mean. (J) Violin plot showing the distribution of PPAR-γ nuclear intensity (n = 90 cells). (A, G, H, I, J) *, p < 0.05; **, p < 0.01; ***, p < 0.001; ****, p < 0.0001 an unpaired two-tailed Student’s t test. (B, M) *, p < 0.05 using a two-tailed Mann-Whitney test. (E) *, p < 0.0332 using a two-way ANOVA with Šídák’s multiple comparisons test. (F) *, p < 0.05 using a one-way ANOVA with Šídák’s multiple comparisons test.
Figure 6.
Figure 6.. Exposure to a HF diet and LDP depletes phenyllactic acid, an activator of intestinal PPAR-γ, from the small intestine.
(A and B) Untargeted metabolomics was performed on ileum content from mice given a HF diet or a HF diet + LDP (N = 5/phenotype). (A) Heat map clustering of the experimental sample groups and metabolites. Samples (columns) are clustered by group and relative abundance (rows) across different groups, ordered from low (blue) to high (red) abundance. (B) Normalized relative abundance, as determined by untargeted metabolomics, of phenyllactic acid (PLA) in the small intestine content of mice fed a HF diet or a HF diet + LDP-treated. (C) Concentration (pmol/mg of intestinal content) of PLA in the small intestine of germ-free (GF) and conventional mice fed a HF diet for 5 weeks. (D) Concentration (μM) of PLA in supernatants from defined microbiota cultures lacking or containing L. murinus. (E) Concentration (μM) of PLA in the supernatant of lactic acid bacteria grown in cell culture media. (F) Concentration (pmol/mg of intestinal content) of PLA in the small intestine of mice. Dotted line indicates limit of detection = 0.025 pmol/mg. (G) Mouse enteroids were treated with either 10 μM Rosiglitazone or 5 mM PLA or left untreated. (H and I) Immortalized mouse small intestinal cells were treated with 5 mM PLA (F) or left untreated (E). Cells were subsequently stained with anti-PPAR-γ and phalloidin to identify F-actin. (J) PPAR-γ nuclear intensity was quantified using ImageJ; 15 cells were selected from 2 images from 3 independent experiments. (K) Amount of BODIPY C12 secreted by treated Caco-2 cells was measured 6 hours after addition of lipid micelles. (B, C,) Each dot represents one animal. Lines represent geometric mean. (F) Each dot represents one animal. Lines represent mean. (B, C, and F) Data represents one independent cohort. N = 5 or 6 mice/group. (D- E) Each dot represents a biological replicate. Lines show geometric mean. (G) Each dot represents one technical replicate. Data shown from three biological replicates. Lines show geometric mean. (J) Violin plot showing the distribution of PPAR-γ nuclear intensity (n = 90 cells). (K) Each dot represents one technical replicate. Data shown from three biological replicates. Lines show geometric mean. *, p < 0.05; **, p < 0.01; ***, p < 0.001; ****, p < 0.0001 using an unpaired two-tailed Student’s t test.
Figure 7.
Figure 7.. Phenyllactic acid upregulates intestinal PPAR- γ and inhibits HF + LDP induced metabolic dysfunction
(A) Concentration (pmol/mg of intestinal content) of PLA in the small intestine of mice. Dotted line indicates limit of detection = 0.025 pmol/mg. (B) Sections from the ileum of HF diet mice given 10 mM PLA in their drinking water and/or LDP for 5 weeks were stained for PPAR-γ. Scale bar represents 200 μm. (C) PPAR-γ abundance in the epithelium was quantified by scoring blinded sections of the ileum. (D) Abdominal fat (% total body weight) and (E) weight gain of mice measured after 5-week on a HF diet ± PLA ± LDP. (F) Representative images of oil red O-stained sections of the liver. Scale bar represents 100 μm. (G) Combined oil red scores from livers of mice after 5 weeks of treatment. (A, G) N = 6 mice/group. (C – E) N =12 mice/group. (A, C – E, G) Each dot represents one animal. Lines represent geometric mean. Data representative of two independent cohorts. (A, D, and E) *, p < 0.05; **, p < 0.01; ***, p < 0.001; ****, p < 0.0001 using an unpaired two-tailed Student’s t test. (C and G) *, p < 0.05; **, p < 0.01 using Mann-Whitney test.

Comment in

References

    1. Gensollen T, Iyer SS, Kasper DL, and Blumberg RS (2016). How colonization by microbiota in early life shapes the immune system. Science 352, 539–544. 10.1126/science.aad9378. - DOI - PMC - PubMed
    1. Maynard CL, Elson CO, Hatton RD, and Weaver CT (2012). Reciprocal interactions of the intestinal microbiota and immune system. Nature 489, 231–241. 10.1038/nature11551. - DOI - PMC - PubMed
    1. Derrien M, Alvarez AS, and de Vos WM (2019). The Gut Microbiota in the First Decade of Life. Trends Microbiol 27, 997–1010. 10.1016/j.tim.2019.08.001. - DOI - PubMed
    1. Roswall J, Olsson LM, Kovatcheva-Datchary P, Nilsson S, Tremaroli V, Simon MC, Kiilerich P, Akrami R, Kramer M, Uhlen M, et al. (2021). Developmental trajectory of the healthy human gut microbiota during the first 5 years of life. Cell Host Microbe 29, 765–776 e763. 10.1016/j.chom.2021.02.021. - DOI - PubMed
    1. Yatsunenko T, Rey FE, Manary MJ, Trehan I, Dominguez-Bello MG, Contreras M, Magris M, Hidalgo G, Baldassano RN, Anokhin AP, et al. (2012). Human gut microbiome viewed across age and geography. Nature 486, 222–227. 10.1038/nature11053. - DOI - PMC - PubMed

LinkOut - more resources