. 2023 Nov;43(11):1207-1228.
doi: 10.1002/cac2.12486. Epub 2023 Oct 4.

Interactions of Indoleamine 2,3-dioxygenase-expressing LAMP3+ dendritic cells with CD4+ regulatory T cells and CD8+ exhausted T cells: synergistically remodeling of the immunosuppressive microenvironment in cervical cancer and therapeutic implications

Affiliations

Interactions of Indoleamine 2,3-dioxygenase-expressing LAMP3+ dendritic cells with CD4+ regulatory T cells and CD8+ exhausted T cells: synergistically remodeling of the immunosuppressive microenvironment in cervical cancer and therapeutic implications

Xinyu Qu et al. Cancer Commun (Lond). 2023 Nov.

Abstract

Background: Cervical cancer (CC) is the fourth most common cancer in women worldwide. Although immunotherapy has been applied in clinical practice, its therapeutic efficacy remains far from satisfactory, necessitating further investigation of the mechanism of CC immune remodeling and exploration of novel treatment targets. This study aimed to investigate the mechanism of CC immune remodeling and explore potential therapeutic targets.

Methods: We conducted single-cell RNA sequencing on a total of 17 clinical specimens, including normal cervical tissues, high-grade squamous intraepithelial lesions, and CC tissues. To validate our findings, we conducted multicolor immunohistochemical staining of CC tissues and constructed a subcutaneous tumorigenesis model in C57BL/6 mice using murine CC cell lines (TC1) to evaluate the effectiveness of combination therapy involving indoleamine 2,3-dioxygenase 1 (IDO1) inhibition and immune checkpoint blockade (ICB). We used the unpaired two-tailed Student's t-test, Mann-Whitney test, or Kruskal-Wallis test to compare continuous data between two groups and one-way ANOVA with Tukey's post hoc test to compare data between multiple groups.

Results: Malignant cervical epithelial cells did not manifest noticeable signs of tumor escape, whereas lysosomal-associated membrane protein 3-positive (LAMP3+ ) dendritic cells (DCs) in a mature state with immunoregulatory roles were found to express IDO1 and affect tryptophan metabolism. These cells interacted with both tumor-reactive exhausted CD8+ T cells and CD4+ regulatory T cells, synergistically forming a vicious immunosuppressive cycle and mediating CC immune escape. Further validation through multicolor immunohistochemical staining showed co-localization of neoantigen-reactive T cells (CD3+ , CD4+ /CD8+ , and PD-1+ ) and LAMP3+ DCs (CD80+ and PD-L1+ ). Additionally, a combination of the IDO1 inhibitor with an ICB agent significantly reduced tumor volume in the mouse model of CC compared with an ICB agent alone.

Conclusions: Our study suggested that a combination treatment consisting of targeting IDO1 and ICB agent could improve the therapeutic efficacy of current CC immunotherapies. Additionally, our results provided crucial insights for designing drugs and conducting future clinical trials for CC.

Keywords: T cell; cervical cancer; dendritic cell; immune checkpoint blockade; immune escape; indoleamine 2,3-dioxygenase 1; single-cell analysis.


Conflict of interest statement

The authors declare that they have no competing interests.

Figures
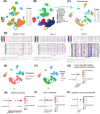
FIGURE 1
FIGURE 1
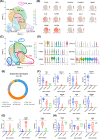
Malignant cervical epithelial cells exhibit no remarkable signs of tumor escape. (A) UMAP projection of 119,351 cells from 17 clinical samples consisting of normal cervical tissues, HSIL foci, and CC tissues that were clustered into 32 clusters. Each dot corresponds to a single cell and is colored according to the cell cluster. (B) UMAP projection of 119,351 cells, which were further categorized into 11 major cell types. Each dot, which corresponds to a single cell, is colored according to cell type. See also Supplementary Figure S1A. (C) UMAP projection of the 24 epithelial subclusters generated from unsupervised reclustering. Each dot, which corresponds to a single epithelial cell, is colored according to subcluster. See also Supplementary Figure S1B. (D) CNV profiles of epithelial cells inferred from scRNA‐seq of normal cervical tissues (N1 with HPV infection [Normal 1_HPV+]), HSIL_2, and SCC_4 data. Red and blue indicate chromosomal amplifications and deletions, respectively. (E) UMAP projection of all epithelial cells presenting as malignant (light blue) and non‐malignant (red). (F) UMAP projection of all epithelial cells presenting at different disease stages, including those in the normal cervix (N), HSIL, and CA (cancer). Each dot, which corresponds to a single cell, is colored according to disease stage. (G‐J) Dot plot indicating the average expression levels and proportions of cells expressing tumor‐associated antigen‐related adhesion molecules (G), antigen processing‐related genes (H), MHC‐I molecules (I), and ligands for immune checkpoints (J) in malignant and non‐malignant epithelial cells. The colors represent the average expression levels, and dot sizes represent the percent expression of selected genes. Abbreviations: UMAP, Uniform Manifold Approximation and Projection; HSIL, high‐grade squamous intraepithelial lesion; CNV, copy number variation; scRNA‐seq, single‐cell RNA sequencing; HPV, human papillomavirus; SCC, squamous cell carcinoma; MHC, major histocompatibility complex.
FIGURE 2
FIGURE 2
Mature LAMP3+ DCs exert immunoregulatory effects and participate in tryptophan metabolism in the CC TME. (A) UMAP projection of the 9 subclusters of DCs generated from unsupervised clustering, which were categorized into 6 main groups according to marker gene expression. (B) Marker gene expression plotted onto the UMAP projection: CD1C, FCER1A, and CLEC10A for DC_CD1C (subcluster 0, 3, 7, 8) and CD207 for DC_CD207_CD1C (subcluster 5); MKI67 for DC_cycling (subcluster 1); CLEC9A, XCR1, and CADM1 for DC_CLEC9A (subcluster 4); LILRA4 for pDC (subcluster 2); LAMP3 for DC_LAMP3 (subclusters 6). The color gradation from grey to red indicates relative expression levels from low to high, respectively. (C) Differentiation trajectory of DC subclusters predicted by Monocle indicating the terminal location of DC_LAMP3 cells. (D‐G) Dot plot indicating the average expression levels and proportion of cells expressing maturation markers (D), migration markers (E), TLRs and adaptors (F), and immunoregulatory markers (G) in the 6 main DC groups. The colors represent the average expression levels, and dot sizes represent the percent expression of selected genes. (H) Heatmap demonstrating the QuSAGE enrichment scores for the metabolic pathways for each DC subcluster (upper) and a violin plot showing expression of the IDO1 gene in each DC subcluster (lower). In the heatmap, a score of 0 (white) indicates nonsignificant enrichment after FDR correction, whereas red and blue indicate positive and negative associations, respectively. (I) Scatter plots indicating the proportions of DC_LAMP3 cells among all DCs in 3 disease stages, including cervical CA (cancer), HSIL, and N (normal cervix). Error bar: median value with 95%CI (n = 17 standing for 17 CC samples). P values were obtained by the Kruskal‐Wallis test (P = 0.089). (J) Dot plots demonstrate selected ligand‐receptor interactions between different DC groups and malignant cervical epithelial cells. The involved cell types and ligand‐receptor interactions are indicated by columns and rows, respectively. The means of the average expression levels of two interacting molecules are indicated by the color key, with blue to red representing low to high expression, respectively. The [‐Log10(P values)] are indicated by dot size. Abbreviations: DCs, dendritic cells; CC, cervical cancer; TME, tumor microenvironment; TLR, toll‐like receptor; CI, confidence interval.
FIGURE 3
FIGURE 3
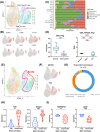
CD8+ reactive T cells in the CC microenvironment mainly exhibit dysfunction and exhaustion. (A‐B) UMAP projection of the 11 subclusters of CD8+ T cells generated from unsupervised reclustering, which could be categorized into 7 main groups (A) according to marker gene expression (B): CCR7 and LEF1 for CD8_naive (subcluster 10); CX3CR1 and FGFBP2 for CD8_Temra/eff (subcluster 7); IL7R and KLRB1 for CD8_MAIT (subcluster 1); CAPG and XCL1 for CD8_Trm (subcluster 0, 5, and 6); GZMK and CXCR4 for CD8_Tem (subcluster 3 and 4); CXCL13 and HAVCR2 for CD8_ Tex (subcluster 2 and 9); and MKI67 and TOP2A for CD8_Cycling (subcluster 8). The color key from grey to red indicates relative expression levels from low to high, respectively. (C) UMAP projection of the 11 subclusters of CD8+ T cells presenting as Nex Nre cells (light blue), Nex Re cells (purple), Ex Nre cells (green), and Ex Re cells (red). (D) Violin plot showing the gene expression of IL7R, ITM2C, GZMK, CXCL13, ENTPD1, and GZMA in each CD8+ T subcluster. (E) Pie graph illustrating the proportions of different subgroups among the CD8+ T cells that had more than 5 expanded clonotypes (n ≥ 5). Each color corresponds to one CD8+ T subgroup. (F‐H) Violin plots indicating the expression levels of genes associated with immune exhaustion and tumor reactivity (F), exhaustion but nonreactivity (G), and a positive immune reaction (H) in different groups of CD8+ T cells with major expanded clonotypes. P values were obtained by one‐way ANOVA or Kruskal‐Wallis test. *, P < 0.05; **, P < 0.01; ***, P < 0.001; ****, P < 0.0001. Abbreviations: Nex, non‐exhausted; Nre, non‐reactive to tumor antigen; Re, reactive to tumor antigen; Ex, exhausted; ns, not significant.
FIGURE 4
FIGURE 4
CD4+ reactive T cells in the CC microenvironment could be divided into helpers and regulators. (A‐B) UMAP projection of the 10 subclusters of CD4+ T cells generated from unsupervised reclustering, which could be categorized into 5 main groups: (A) with marker gene expression; (B) FOXP3, IL2RA, and CTLA4 for CD4_Tregs (subclusters 4 and 6); CXCL13, IFNG, and CD200 for Tem/Th1‐like cells (subcluster 7) and Th1‐like cells (subcluster 5). The color gradation from grey to red indicates relative expression levels from low to high, respectively. (C) Histogram indicating the ratios of each CD4+ T‐cell type in the 17 samples, including normal cervical tissues, HSIL, and CC tissues, including both SCC and ADC. (D) Box plots indicating the proportion of CD4_Tregs among all CD4+ T cells in the cancer group compared to the noncancer group (left panel) and the ratio between CD4_Th cell and Treg abundance in the normal cervix, HSIL, and cancer (CA) groups (right panel). Error bar: median value with 95%CI (n = 17 representing 17 clinical samples altogether). P values were obtained by Student's t test and one‐way ANOVA with Tukey's multiple comparison test, respectively. ***, P < 0.001; ****, P < 0.0001. (E) UMAP projection of potential Ex Re CD4+ T cells (red). (F) Gene expression of ENTPD1 and TOX plotted onto the UMAP projection. (G) Pie graph illustrating the proportions of different subgroups among the CD4+ T cells that had more than 5 expanded clonotypes (n ≥ 5). Each color corresponds to one CD4+ T cell subgroup. (H‐I) Violin plots indicating the expression levels of genes associated with immune exhaustion (H) and differentiation and activation (I) in CD4_Tregs compared with that in CD4_Tem/Th1‐like cells with major expanded clonotypes. P values were obtained by Student's t test. **, P < 0.01; ****, P < 0.0001. Abbreviations: HSIL, high‐grade squamous intraepithelial lesion; CC, cervical cancer; SCC, squamous cell cervical cancer; ADC, adenocarcinoma of the cervix; ANOVA, analysis of variance.
FIGURE 5
FIGURE 5
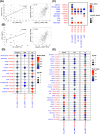
DC_LAMP3 cells communicate with both reactive CD8_Tex cells and CD4_Tregs. (A) Scatter plot indicating the positive association between the abundance of CD8_Tex cells and that of DC_LAMP3 cells in the cervical environment, according to the present study (left panel, Pearson's correlation, R = 0.607) and TCGA CESC dataset (right panel, Pearson's correlation, R = 0.6, P value < 0.0001). (B) Scatter plot indicating the positive association between the abundance of CD4_Tregs and that of DC_LAMP3 cells in the cervical environment, according to the present study (left panel, Pearson's correlation, R = 0.499) and TCGA CESC dataset (right panel, Pearson's correlation, R = 0.65, P value < 0.0001). (C) Dot plot demonstrating selected ligand‐receptor interactions between different DC groups and CD8_Tex cells. The involved cell types and ligand‐receptor interactions are indicated by the columns and rows, respectively. The means of the average expression levels of two interacting molecules are indicated by the color gradation, with blue to red representing low to high expression, respectively. The “‐Log10(P values)” are indicated by dot size. (D‐E) Dot plots demonstrate selected ligand‐receptor interactions between DC_LAMP3 cells and CD8_Tex cells (D), as well as those between DC_LAMP3 cells and CD4_Tregs (E) in the normal cervix, HSIL, and CA (cancer) groups. The histologic subtypes and ligand‐receptor interactions are indicated by the columns and rows, respectively. The means of the average expression levels of two interacting molecules are indicated by the color gradation, with blue to red representing low to high expression, respectively. The “‐Log10(P values)” are indicated by dot size. Abbreviations: TCGA, The Cancer Genome Atlas; CESC, cervical and endocervical cancer.
FIGURE 6
FIGURE 6
Co‐localization of reactive T cells and DC_LAMP3 cells in CC TIME. (A) Representative images of multiplex IHC staining for the co‐localization of Treg cells (CD3+CD4+PD‐1+) and DC_LAMP3 cells (CD80+PD‐L1+) in CC tissue samples. Proteins that were detected using the respective antibodies are indicated on the top. The orange, red, green, yellow, and magenta arrows indicate cells in CC tissue samples with positive expression of the CD3, CD4, PD‐1, CD80, and PD‐L1 proteins, respectively (bottom panel). Scale bars, 50 μm and 20 μm for the top and bottom panels, respectively. (B) Representative images of multiplex IHC staining for the co‐localization of CD8_Tex cells (CD3+CD8+PD‐1+) and DC_ LAMP3 cells (CD80+PD‐L1+) in CC tissue samples. Proteins that were detected using the respective antibodies are indicated on top. The orange, red, green, yellow, and magenta arrows indicate cells in CC tissue samples with positive expression of the CD3, CD8, PD‐1, CD80, and PD‐L1 proteins, respectively (bottom panel). Scale bars, 50 μm and 20 μm for the top and bottom panels, respectively. Abbreviations: DCs, dendritic cells; CC, cervical cancer; TIME, tumor immune microenvironment; Treg, regulatory T cells; Tex, exhausted T cells; IHC, immunohistochemistry.
FIGURE 7
FIGURE 7
IDO1 inhibition further enhanced the treatment efficacy of ICB in CC animal models. (A‐B) Photographs of TC1 tumors by indicated treatment. The tumors were removed from C57BL/6 mice on Day 12 after TC1 cell injection (n = 6 for each group in A: isotype as control group [Ctrl] and anti‐PD‐1, anti‐CTLA4, anti‐TIGIT, and anti‐TIM3 groups; n = 6 for each group in B: Epacadostat [E], anti‐PD‐1 + E, anti‐CTLA4 + E, anti‐TIGIT + E, and anti‐TIM3 + E groups). (C‐D) Average tumor growth curves of TC1 tumors in mice that underwent different treatments. Error bar: mean ± SD (n = 6 for each treatment group). P values were obtained by one‐way ANOVA with Tukey's multiple comparison test. *, P < 0.05; **, P < 0.01; ns, not significant. (E) Scatter plot showing CD8 expression in CD3+ T cells from the peripheral blood of C57BL/6 mice bearing TC1 tumors after different treatment regimens through flow cytometry. Error bar: mean value with 95%CI (n = 6 for each treatment group). P values were obtained by one‐way ANOVA. ns, not significant. (F‐I) Scatter plots showing the expression of Ki67, GZMB, TNF‐a, and CXCL13 in CD8+ T cells from the peripheral blood of C57BL/6 mice bearing TC1 tumors after different treatment regimens through flow cytometry. Error bar: mean value with 95%CI (n = 6 for each treatment group). P values were obtained by one‐way ANOVA with Tukey's multiple comparison test. *, P < 0.05; **, P < 0.01; ns, not significant. Abbreviations: IHC, immunohistochemistry; SD, standard deviation; ANOVA, analysis of variance.
FIGURE 8
FIGURE 8
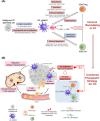
Flow chart and critical conclusions of the current study. Abbreviations: scRNA‐seq, single cell RNA sequencing; HSIL, high‐grade squamous intraepithelial lesion; SCC, squamous cell carcinoma; ADC, adenocarcinoma of cervix; CC, cervical cancer; DC, dendritic cells; Trp, tryptophan; Trp, tryptophan; Treg, regulatory T cells; Tex, exhausted T cells; TCGA, The Cancer Genome Atlas; CESC, cervical and endocervical cancer; IHC, immunohistochemistry; Kyn, kynurenine; ICB, immune checkpoint blockade.
FIGURE 9
FIGURE 9
Schematic diagrams illustrating the vicious immunosuppressive cycle formed by DC_LAMP3 cells and reactive T cells in the CC TME and a potential therapeutic strategy. (A) From the perspective of tumor immunity, cellular crosstalk between DC_LAMP3 cells and malignant CC epithelial cells induces impaired antigen recognition and immune tolerance, whereas the interplay between DC_LAMP3 cells and CD4_Tregs and CD8_Tex cells is associated with recruitment, immunoregulation, and immunosuppression. From the perspective of tumor metabolism, the upregulation of IDO1 in DC_LAMP3 cells can convert Trp to Kyn metabolites, which activate AhR pathways and subsequently promote the differentiation of CD4+ cells into CD4_Tregs and inhibit the proliferation and cytotoxicity of CD8+ T cells. Consequently, the accumulation of CD4_Tregs and CD8_T ex cells within the CC TME and high expression of immune checkpoints on CD4_Tregs and CD8_T ex cells can further enhance IDO1 expression in DC_LAMP3 cells, thus forming a vicious immunosuppressive cycle. (B) DC_LAMP3 cells experience migration, antigen presentation, T cell attraction and activation, and interaction with T cells in CC, highlighting excessive tryptophan metabolism and immune suppression. To break this vicious immunosuppressive cycle in the CC TME, we suggest the application of a combination treatment targeting IDO1 and blocking immune checkpoints such as PD‐1 and CTLA4 to affect tumor metabolism and immunity. Abbreviations: CC, cervical cancer; TME, tumor microenvironment; Trp, tryptophan; Kyn, kynurenine; AHR, aryl hydrocarbon receptor.

References

    1. Siegel RL, Miller KD, Fuchs HE, Jemal A. Cancer statistics, 2021. CA Cancer J Clin. 2021;71(1):7–33. - PubMed
    1. Chung HC, Ros W, Delord JP, Perets R, Italiano A, Shapira‐Frommer R, et al. Efficacy and Safety of pembrolizumab in previously treated advanced cervical cancer: results from the Phase II KEYNOTE‐158 study. J Clin Oncol. 2019;37(17):1470–1478. - PubMed
    1. Naumann RW, Hollebecque A, Meyer T, Devlin MJ, Oaknin A, Kerger J, et al. Safety and Efficacy of Nivolumab Monotherapy in Recurrent or Metastatic Cervical, Vaginal, or Vulvar Carcinoma: Results From the Phase I/II CheckMate 358 Trial. J Clin Oncol. 2019;37(31):2825–2834. - PMC - PubMed
    1. Santin AD, Deng W, Frumovitz M, Buza N, Bellone S, Huh W, et al. Phase II evaluation of nivolumab in the treatment of persistent or recurrent cervical cancer (NCT02257528/NRG‐GY002). Gynecol Oncol. 2020;157(1):161–166. - PMC - PubMed
    1. O'Malley DM, Oaknin A, Monk BJ, Selle F, Rojas C, Gladieff L, et al. Phase II study of the safety and efficacy of the anti‐PD‐1 antibody balstilimab in patients with recurrent and/or metastatic cervical cancer. Gynecol Oncol. 2021;163(2):274–280. - PubMed

Publication types