. 2023 Jul 5;5(5):e230024.
doi: 10.1148/ryai.230024. eCollection 2023 Sep.

TotalSegmentator: Robust Segmentation of 104 Anatomic Structures in CT Images

Affiliations

TotalSegmentator: Robust Segmentation of 104 Anatomic Structures in CT Images

Jakob Wasserthal et al. Radiol Artif Intell. .

Abstract

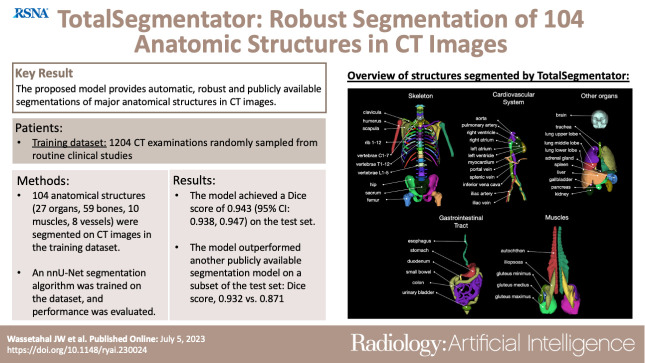
Purpose: To present a deep learning segmentation model that can automatically and robustly segment all major anatomic structures on body CT images.

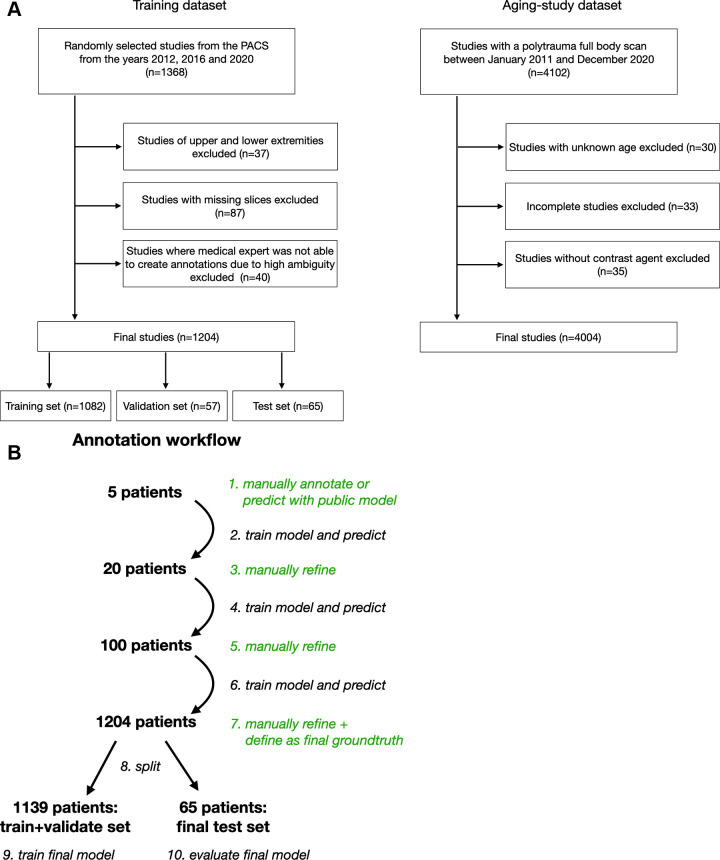
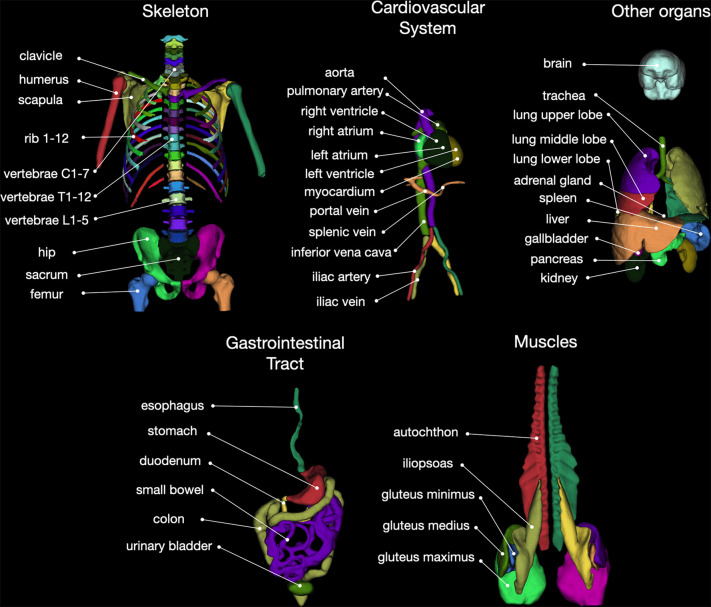
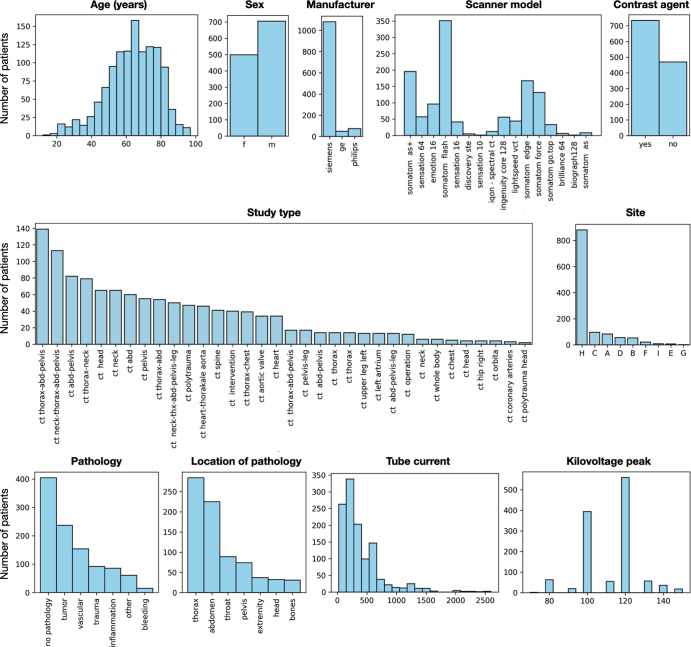
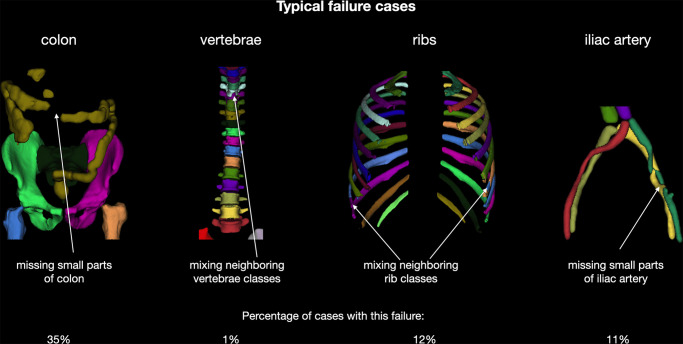
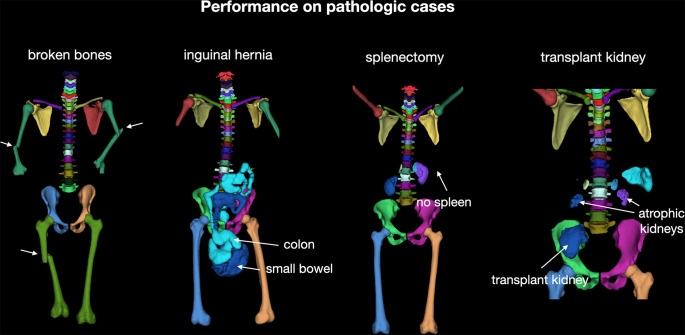
Materials and methods: In this retrospective study, 1204 CT examinations (from 2012, 2016, and 2020) were used to segment 104 anatomic structures (27 organs, 59 bones, 10 muscles, and eight vessels) relevant for use cases such as organ volumetry, disease characterization, and surgical or radiation therapy planning. The CT images were randomly sampled from routine clinical studies and thus represent a real-world dataset (different ages, abnormalities, scanners, body parts, sequences, and sites). The authors trained an nnU-Net segmentation algorithm on this dataset and calculated Dice similarity coefficients to evaluate the model's performance. The trained algorithm was applied to a second dataset of 4004 whole-body CT examinations to investigate age-dependent volume and attenuation changes.

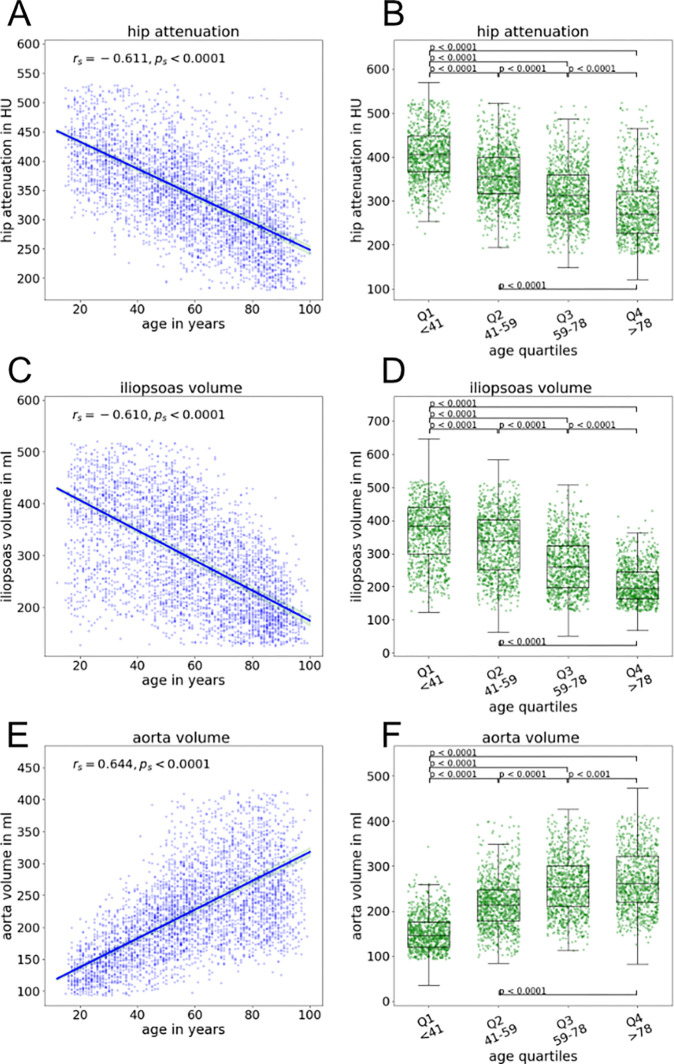
Results: The proposed model showed a high Dice score (0.943) on the test set, which included a wide range of clinical data with major abnormalities. The model significantly outperformed another publicly available segmentation model on a separate dataset (Dice score, 0.932 vs 0.871; P < .001). The aging study demonstrated significant correlations between age and volume and mean attenuation for a variety of organ groups (eg, age and aortic volume [rs = 0.64; P < .001]; age and mean attenuation of the autochthonous dorsal musculature [rs = -0.74; P < .001]).

Conclusion: The developed model enables robust and accurate segmentation of 104 anatomic structures. The annotated dataset (https://doi.org/10.5281/zenodo.6802613) and toolkit (https://www.github.com/wasserth/TotalSegmentator) are publicly available.Keywords: CT, Segmentation, Neural Networks Supplemental material is available for this article. © RSNA, 2023See also commentary by Sebro and Mongan in this issue.

Keywords: CT; Neural Networks; Segmentation.


Conflict of interest statement

Disclosures of conflicts of interest: J.W. No relevant relationships. H.C.B. No relevant relationships. M.T.M. No relevant relationships. M.P. No relevant relationships. D.H. No relevant relationships. A.W.S. No relevant relationships. T.H. No relevant relationships. D.T.B. No relevant relationships. J.C. No relevant relationships. S.Y. No relevant relationships. M.B. No relevant relationships. M.S. No relevant relationships.

Figures

None
Graphical abstract
(A) Diagram shows the inclusion of patients into the study. (B) Diagram shows the iterative annotation workflow of the training dataset. Steps involving manual annotation are shown in green. In step 9, a completely new model was trained independently of the intermediate models (steps 2, 4, and 6). This avoids leakage of information from the test set into the training set. PACS = picture archiving and communication system.
Figure 1:
(A) Diagram shows the inclusion of patients into the study. (B) Diagram shows the iterative annotation workflow of the training dataset. Steps involving manual annotation are shown in green. In step 9, a completely new model was trained independently of the intermediate models (steps 2, 4, and 6). This avoids leakage of information from the test set into the training set. PACS = picture archiving and communication system.
Overview of all 104 anatomic structures segmented by the TotalSegmentator. autochthon = autochthonous dorsal musculature.
Figure 2:
Overview of all 104 anatomic structures segmented by the TotalSegmentator. autochthon = autochthonous dorsal musculature.
Graphs show the distribution of different parameters of the training dataset, demonstrating the dataset’s high diversity.
Figure 3:
Graphs show the distribution of different parameters of the training dataset, demonstrating the dataset’s high diversity.
Overview of typical failure cases of the proposed model. Users should be aware that these problems may occur.
Figure 4:
Overview of typical failure cases of the proposed model. Users should be aware that these problems may occur.
Overview of performance of the proposed model on different abnormalities on the test set. Our model showed robust, accurate results even when structures were distorted (broken bones), displaced (bowels displaced by inguinal hernia), completely missing (splenectomy), or duplicated (transplant kidney).
Figure 5:
Overview of performance of the proposed model on different abnormalities on the test set. Our model showed robust, accurate results even when structures were distorted (broken bones), displaced (bowels displaced by inguinal hernia), completely missing (splenectomy), or duplicated (transplant kidney).
Example correlations of CT attenuation and volume with patient age. (A) Graph shows negative correlation between hip attenuation and patient age. (B) Box plots of hip attenuation for age quartiles show a decrease with increasing age. (C) Graph shows negative correlation between iliopsoas muscle volume and patient age. (D) Box plots of iliopsoas muscle volume for age quartiles show a decrease with increasing age. (E) Graph shows positive correlation between aortic volume and patient age. (F) Box plots of aortic volume for age quartiles show an increase with increasing age. For box plots, the central mark indicates the median, the bottom and top edges of the box indicate the 25th and 75th percentiles, respectively. Whiskers extend to the most extreme data points not considering outliers and are defined by the 25th percentile subtracted by 1.5 times the IQR or the 75th percentile added by 1.5 times the IQR, respectively. Outliers are not displayed.
Figure 6:
Example correlations of CT attenuation and volume with patient age. (A) Graph shows negative correlation between hip attenuation and patient age. (B) Box plots of hip attenuation for age quartiles show a decrease with increasing age. (C) Graph shows negative correlation between iliopsoas muscle volume and patient age. (D) Box plots of iliopsoas muscle volume for age quartiles show a decrease with increasing age. (E) Graph shows positive correlation between aortic volume and patient age. (F) Box plots of aortic volume for age quartiles show an increase with increasing age. For box plots, the central mark indicates the median, the bottom and top edges of the box indicate the 25th and 75th percentiles, respectively. Whiskers extend to the most extreme data points not considering outliers and are defined by the 25th percentile subtracted by 1.5 times the IQR or the 75th percentile added by 1.5 times the IQR, respectively. Outliers are not displayed.

References

    1. Power SP , Moloney F , Twomey M , James K , O’Connor OJ , Maher MM . Computed tomography and patient risk: facts, perceptions and uncertainties . World J Radiol 2016. ; 8 ( 12 ): 902 – 915 . - PMC - PubMed
    1. Sevilla J , Heim L , Ho A , Besiroglu T , Hobbhahn M , Villalobos P . Compute trends across three eras of machine learning . arXiv 2202.05924 [preprint] https://arxiv.org/abs/2202.05924. Posted February 11, 2022. Accessed November 2022 .
    1. Suzuki K . Overview of deep learning in medical imaging . Radiol Phys Technol 2017. ; 10 ( 3 ): 257 – 273 . - PubMed
    1. McBee MP , Awan OA , Colucci AT , et al. . Deep learning in radiology . Acad Radiol 2018. ; 25 ( 11 ): 1472 – 1480 . - PubMed
    1. Almeida SD , Santinha J , Oliveira FPM , et al. . Quantification of tumor burden in multiple myeloma by atlas-based semi-automatic segmentation of WB-DWI . Cancer Imaging 2020. ; 20 ( 1 ): 6 . - PMC - PubMed

LinkOut - more resources