. 2023 Sep 19:10:1202524.
doi: 10.3389/fmolb.2023.1202524. eCollection 2023.

ARPC1B is a novel prognostic biomarker for kidney renal clear cell carcinoma and correlates with immune infiltration

Affiliations

ARPC1B is a novel prognostic biomarker for kidney renal clear cell carcinoma and correlates with immune infiltration

Yong-Fei Tang et al. Front Mol Biosci. .

Abstract

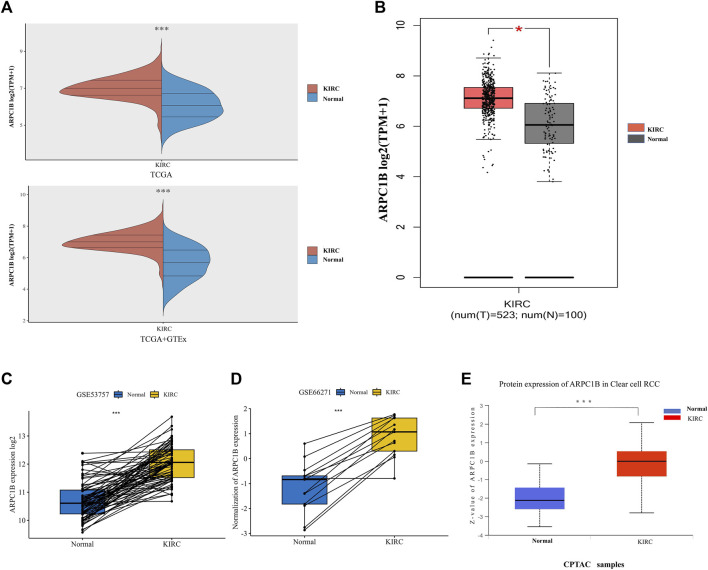
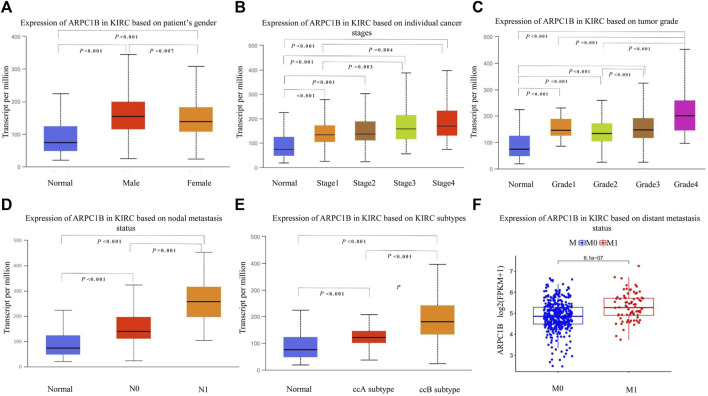
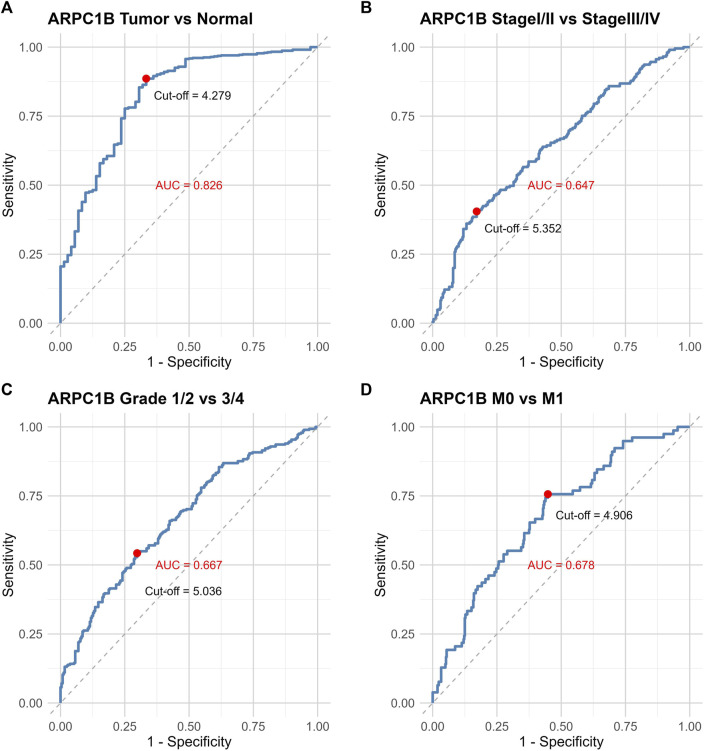
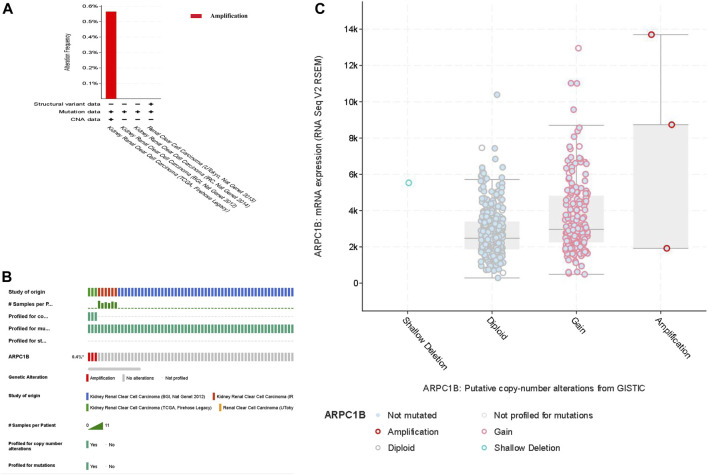
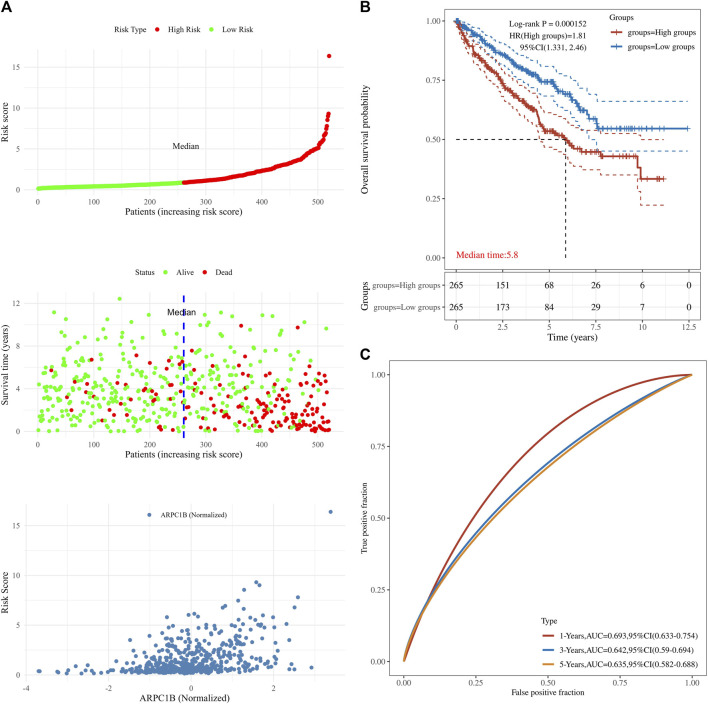
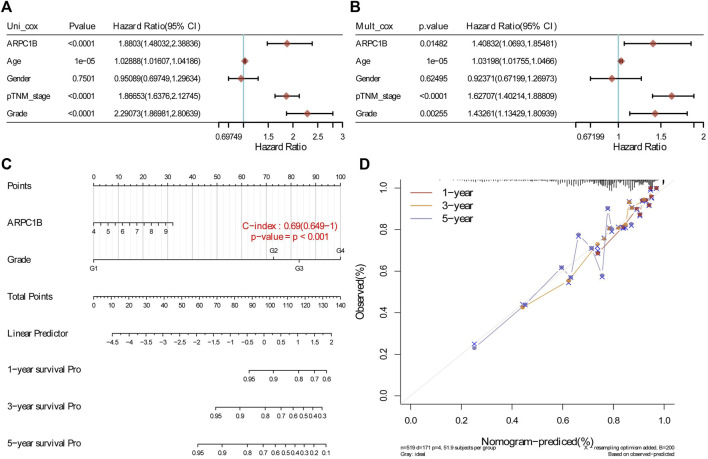
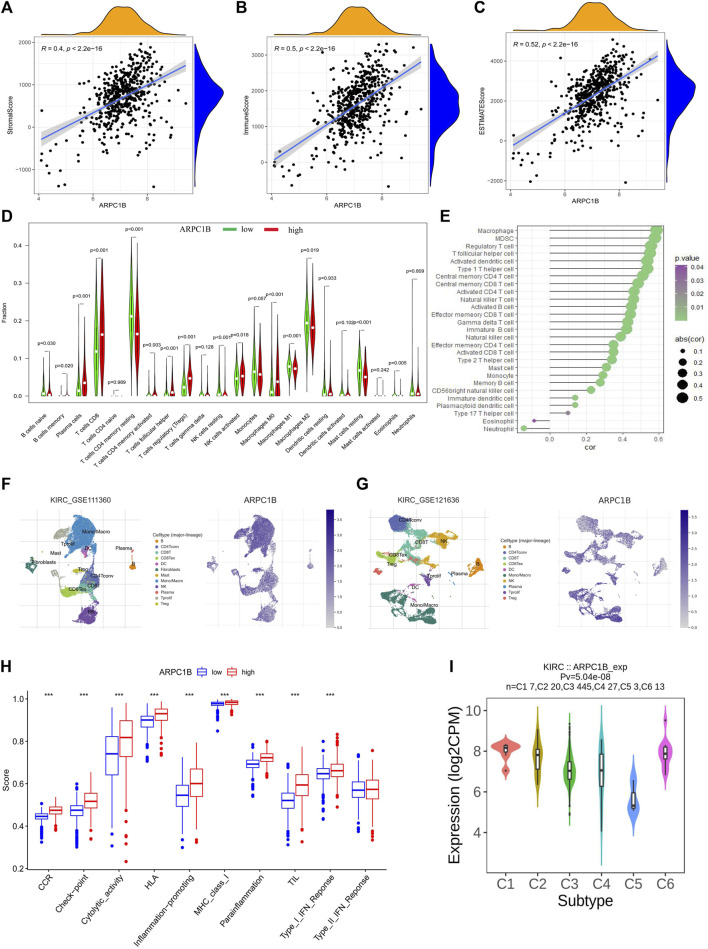
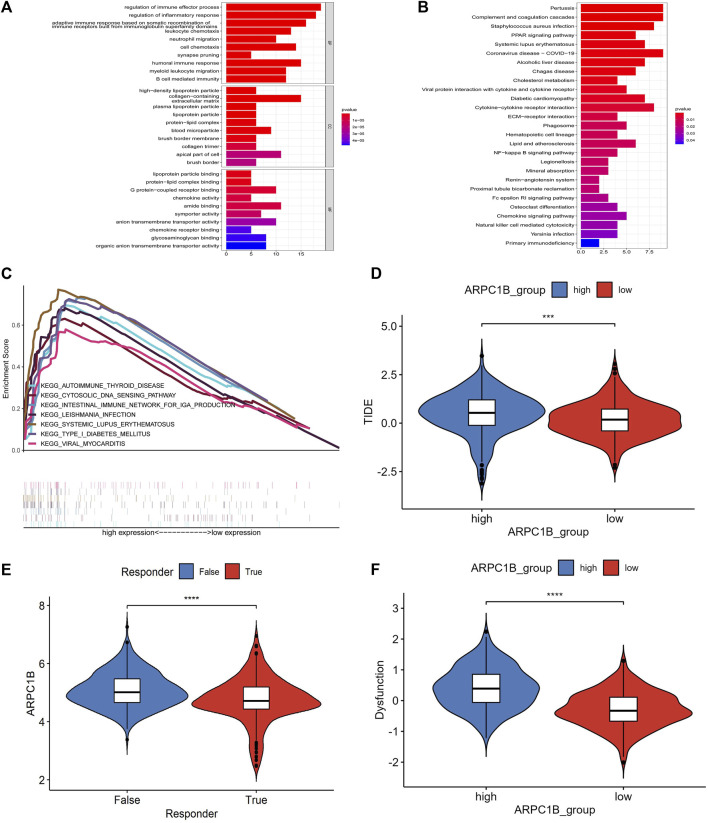
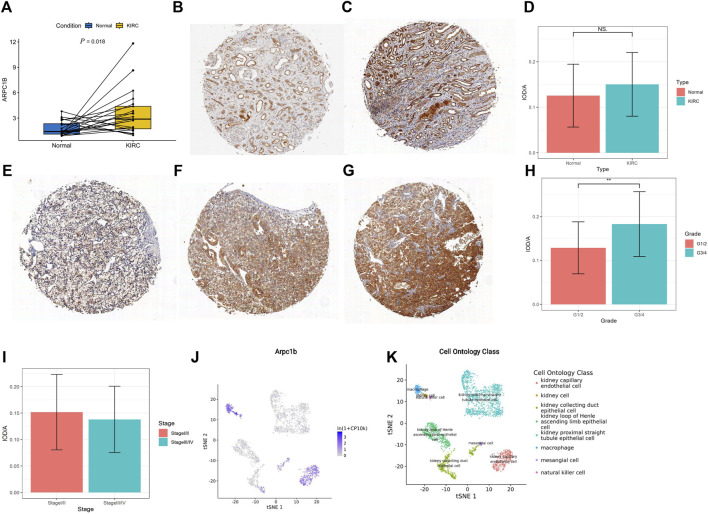
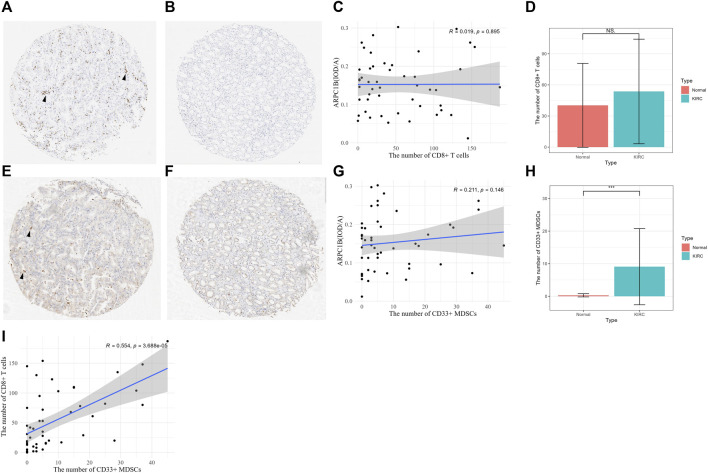
Background: Actin-related protein 2/3 complex subunit 1B (ARPC1B) is reported to be involved in tumorigenesis and progression. However, its role in kidney renal clear cell carcinoma (KIRC), correlation with tumor-infiltrating immune cells, and prognostic significance remain unclear. Methods: Data sets from the TCGA, GTEx, GEPIA, GEO, UALCAN, and CPTAC databases were extracted and analyzed to investigate the expression difference, prognosis, and clinicopathological features of ARPC1B. Single-sample Gene Set Enrichment Analysis (ssGSEA), CIBERSORT, and TISCH2 analysis were used to examine the relationship between ARPC1B expression and tumor immune infiltration in KIRC. The potential function of ARPC1B in KIRC was explored by GO functional annotation and KEGG pathway analysis. The TIDE algorithm was used to predict and analyze the relationship between ARPC1B expression and response to immune checkpoint blockade (ICB). The expression of ARPC1B was further validated by using quantitative real-time polymerase chain reaction (qRT-PCR) and immunohistochemistry (IHC). Results: The study showed that ARPC1B expression was an independent prognostic factor of KIRC, with high ARPC1B expression being associated with poor overall survival (OS). Enrichment of GO annotation and pathway analysis showed multiple immune-related functional pathways affected by ARPC1B such as regulation of immune effector process, inflammatory response regulation, antigen processing and presentation, asthma, autoimmune thyroid disease, graft versus host disease, intestinal immune network for IgA production, and type I diabetic mellitus. Moreover, ARPC1B expression positively correlated with infiltrating levels of myeloid-derived suppressor cells (MDSCs) and regulatory T cells (Tregs) in KIRC. Importantly, high ARPC1B expression predicted a low response to ICB in KIRC. Conclusion: This study indicates that ARPC1B expression is an independent prognostic biomarker for OS in KIRC patients. High ARPC1B expression is closely associated with MDSCs and Tregs infiltration. These findings suggest that ARPC1B may serve as a biomarker for prognosis and immune infiltration in KIRC, potentially aiding in the development of novel treatment strategies to improve the survival outcomes for KIRC patients.

Keywords: ARPC1B; Arp2/3 protein complex; immunotherapy; kidney renal clear cell carcinoma; tumor immune microenvironment.


Conflict of interest statement

The authors declare that the research was conducted in the absence of any commercial or financial relationships that could be construed as a potential conflict of interest.

Figures

FIGURE 1
FIGURE 1
Different mRNA and protein expressions of ARPC1B in KIRC and normal tissues. (A) ARPC1B mRNA expression levels in KIRC and normal tissues from TCGA and GTEx databases. (B) ARPC1B mRNA expression levels in KIRC and normal tissues in the GEPIA database. (C and D) Differential ARPC1B expression levels in KIRC and normal tissues from the GSE53757 and GSE66271 data sets. (E) The different total ARPC1B protein expression in KIRC and normal tissues from the CPTAC database. *p < 0.05, **p < 0.01, ***p < 0.001.
FIGURE 2
FIGURE 2
Relationship between ARPC1B expression and clinicopathological characteristics in KIRC. (A–C) Relative mRNA expressions of ARPC1B in relation to gender, tumor stage, and tumor grade status. (D–F) Relative mRNA expressions of ARPC1B with respect to node metastasis, subtypes, and distant metastasis status.
FIGURE 3
FIGURE 3
ROC curves illustrating the performance of ARPC1B expression in different scenarios. (A) ROC curves of ARPC1B expression in KIRC and normal tissues. (B) ROC curves comparing stage Ⅰ/Ⅱ with stage Ⅲ/Ⅳ. (C) ROC curves distinguishing between grade 1/2 and grade 3/4. (D) ROC curves for distinguishing metastases M0 and M1.
FIGURE 4
FIGURE 4
Analysis of genomic alterations of ARPC1B in KIRC. (A) Genomic alterations of ARPC1B and the corresponding data set. (B) Types of ARPC1B gene alterations and their incidence. (C) Relationship between copy number variation and expression levels of ARPC1B.
FIGURE 5
FIGURE 5
Associations between ARPC1B expression and patient survival based on the TCGA data set. (A) The top chart displays patients sorted by risk scores and divided into high-risk and low-risk groups based on the median number of patients. The middle plot shows the relationship between survival time, survival state, and the high-/low-risk groups. The bottom plot depicts the relationship between risk scores and normalized expression levels of ARPC1B. (B) The Kaplan–Meier survival analysis of ARPC1B expression, with comparisons among different groups made using the log-rank test. HR represents the hazard ratio of high-expression samples relative to low-expression samples. HR > 1 indicates that the gene is a risk factor, while HR < 1 indicates that the gene is a protective factor. HR (95% CI) represents the hazard ratio along with its corresponding 95% confidence interval, as well as the median survival time (LT50) for different groups. (C) The ROC curve of the ARPC1B expression. The higher values of AUC correspond to a higher predictive power.
FIGURE 6
FIGURE 6
Construction and evaluation of a prognostic model using the expression of ARPC1B and other clinical indicators in KIRC. (A) Univariate Cox regression analysis was performed to assess the statistical significance of ARPC1B and other clinical indicators, displaying the corresponding p-value, HR, and 95% CI. (B) Multivariate Cox regression analysis was conducted to further elucidate the prognostic significance of ARPC1B and the selected clinical indicators. (C) Nomograms were developed to predict the 1-, 3-, and 5-year overall survival of KIRC patients based on the expression of ARPC1B and additional factors. (D) Calibration curve illustrating the performance of the overall survival nomogram model in the discovery group. The dashed diagonal line represents the ideal nomogram, while the blue, red, and orange lines represent the observed nomogram’s predicted survival rates at 1-, 3-, and 5-year intervals.
FIGURE 7
FIGURE 7
Correlations between ARPC1B expression and tumor microenvironment, which include immune cell infiltration, immune function, and immune subtypes in the KIRC. (A–C) The stromal score (A), immune score (B), and estimate score (C) were analyzed for their correlation with ARPC1B expression. The immune infiltration landscape was assessed using the CIBERSORT method (D), while ssGSEA analysis was employed to analyze immune cell infiltration in KIRC samples from the TCGA data set (E). (F and G) TISCH2 analysis reveals the correlation between ARPC1B expression and immune cell populations. (H) ssGSEA analysis utilized to examine immune function. (I) Investigated relationship between ARPC1B expression and immune subtypes.
FIGURE 8
FIGURE 8
Results of GO function annotation and KEGG path enrichment analysis, as well as responses to immune checkpoint blockade and their association with ARPC1B expression. (A) Enrichment analysis for GO function annotations. (B) Enrichment analysis for KEGG pathways based on ARPC1B expression. (C) GSEA analysis reveals the activation of signaling pathways associated with high APRC1B expression in KIRC. (D) Variation in TIDE scores between high and low APRC1B expression groups. (E) Differential responses to immune checkpoint blockade based on ARPC1B expression in KIRC. (F) Variation in T-cell dysfunction between high and low APRC1B expression groups. *p < 0.05, **p < 0.01, ***p < 0.001, ****p < 0.0001.
FIGURE 9
FIGURE 9
Expression of ARPC1B in normal and KIRC tissues. (A) qRT-PCR analysis comparing ARPC1B expression between KIRC and normal tissues. (B–C) IHC images demonstrating ARPC1B expression in normal renal tissue (weak and strong expressions). (E–G) IHC images depicting ARPC1B expression in KIRC with weak, medium, and strong expressions, respectively. The ratio of IOD to the area of IHC images is shown for comparisons between KIRC and normal tissues (D), grade 1/2 versus grade 3/4 (H), and stage Ⅰ/Ⅱ versus stage Ⅲ/Ⅳ (I). (J–K) ARPC1B expression in cell ontology classes using the Tabula Muris database. NS (not significant with a p-value greater than 0.05), *p < 0.05, **p < 0.01, ***p < 0.001.
FIGURE 10
FIGURE 10
Relationship between CD8+ T cell and MDSCs and the expression of ARPC1B. (A–B) CD8+ T-cell expression was observed in KIRC and normal renal tissues (arrow indicates the clustering of CD8+ T cells). (C) Correlation between the number of CD8+ T cells and the expression of ARPC1B in KIRC. (D) Differences in the number of CD8+ T cells between KIRC and normal tissues. (E–F) CD33+ MDSCs expression observed in KIRC and normal renal tissue (arrow indicates the clustering of CD33+ MDSCs). (G) Correlation between the number of CD33+ MDSCs and the expression of ARPC1B in KIRC. (H) Differences in the number of CD33+ MDSCs between KIRC and normal tissues. (I) Correlation between the number of CD8+ T cells and number of CD33+ MDSCs in KIRC. NS (not significant with a p-value greater than 0.05), *p < 0.05, **p < 0.01, ***p < 0.001.

Similar articles

Cited by

References

    1. Argentiero A., Solimando A. G., Krebs M., Leone P., Susca N., Brunetti O., et al. (2020). Anti-angiogenesis and immunotherapy: novel paradigms to envision tailored approaches in renal cell-carcinoma. J. Clin. Med. 9 (5), 1594. 10.3390/jcm9051594 - DOI - PMC - PubMed
    1. Auzair L. B., Vincent-Chong V. K., Ghani W. M., Kallarakkal T. G., Ramanathan A., Lee C. E., et al. (2016). Caveolin 1 (Cav-1) and actin-related protein 2/3 complex, subunit 1B (ARPC1B) expressions as prognostic indicators for oral squamous cell carcinoma (OSCC). Eur. Arch. Otorhinolaryngol. 273 (7), 1885–1893. 10.1007/s00405-015-3703-9 - DOI - PubMed
    1. Bahadoram S., Davoodi M., Hassanzadeh S., Bahadoram M., Barahman M., Mafakher L. (2022). Renal cell carcinoma: an overview of the epidemiology, diagnosis, and treatment. G. Ital. Nefrol. 39 (3), 2022–vol3. - PubMed
    1. Chandrashekar D. S., Bashel B., Balasubramanya S. A. H., Creighton C. J., Ponce-Rodriguez I., Chakravarthi B. V. S. K., et al. (2017). UALCAN: a portal for facilitating tumor subgroup gene expression and survival analyses. Neoplasia 19 (8), 649–658. 10.1016/j.neo.2017.05.002 - DOI - PMC - PubMed
    1. Choueiri T. K., Motzer R. J. (2017). Systemic therapy for metastatic renal-cell carcinoma. N. Engl. J. Med. 376 (4), 354–366. 10.1056/NEJMra1601333 - DOI - PubMed