. 2023 Dec 21;36(1):19-39.
doi: 10.1093/plcell/koad247.

NAKED ENDOSPERM1, NAKED ENDOSPERM2, and OPAQUE2 interact to regulate gene networks in maize endosperm development

Affiliations

NAKED ENDOSPERM1, NAKED ENDOSPERM2, and OPAQUE2 interact to regulate gene networks in maize endosperm development

Hao Wu et al. Plant Cell. .

Abstract

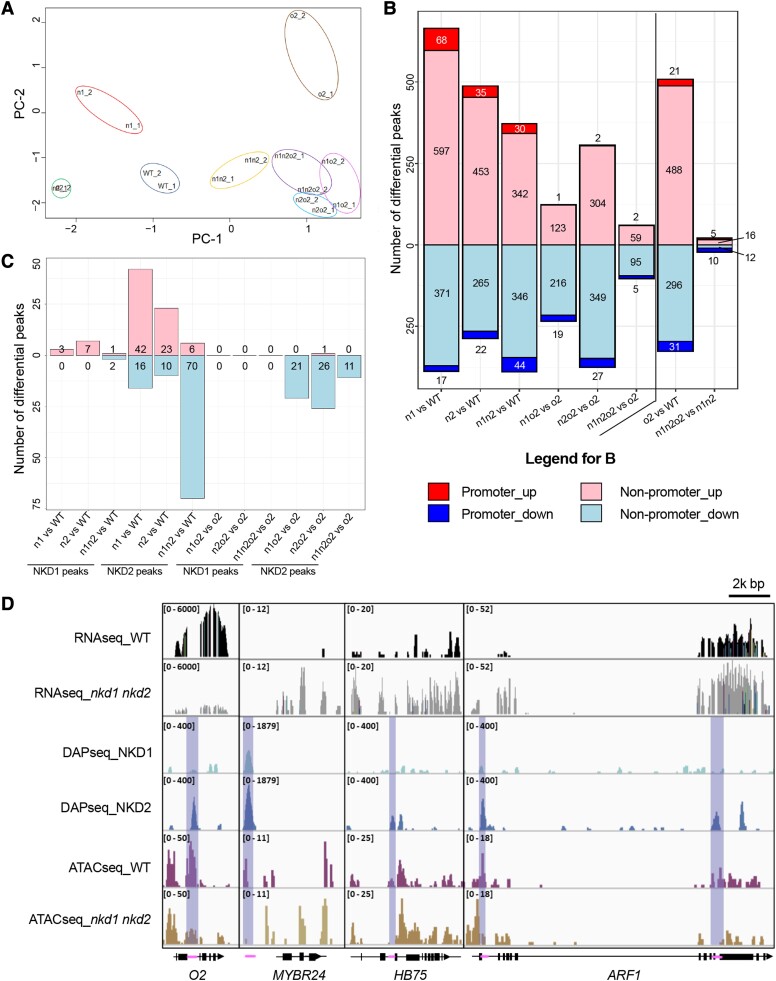
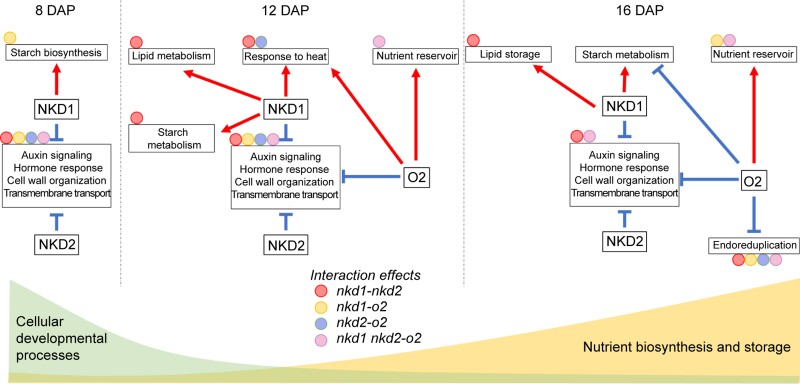
NAKED ENDOSPERM1 (NKD1), NKD2, and OPAQUE2 (O2) are transcription factors important for cell patterning and nutrient storage in maize (Zea mays) endosperm. To study the complex regulatory interrelationships among these 3 factors in coregulating gene networks, we developed a set of nkd1, nkd2, and o2 homozygous lines, including all combinations of mutant and wild-type genes. Among the 8 genotypes tested, we observed diverse phenotypes and gene interactions affecting cell patterning, starch content, and storage proteins. From ∼8 to ∼16 d after pollination, maize endosperm undergoes a transition from cellular development to nutrient accumulation for grain filling. Gene network analysis showed that NKD1, NKD2, and O2 dynamically regulate a hierarchical gene network during this period, directing cellular development early and then transitioning to constrain cellular development while promoting the biosynthesis and storage of starch, proteins, and lipids. Genetic interactions regulating this network are also dynamic. The assay for transposase-accessible chromatin using sequencing (ATAC-seq) showed that O2 influences the global regulatory landscape, decreasing NKD1 and NKD2 target site accessibility, while NKD1 and NKD2 increase O2 target site accessibility. In summary, interactions of NKD1, NKD2, and O2 dynamically affect the hierarchical gene network and regulatory landscape during the transition from cellular development to grain filling in maize endosperm.


Conflict of interest statement

Conflict of interest statement. None declared.

Figures

Figure 1.
Figure 1.
The defective phenotypes of the nkd1 nkd2 o2 triple mutant. A) Kernel phenotypes of WT, o2, nkd1 nkd2, and nkd1 nkd2 o2. Black background: kernel surface view; white background: kernel opaqueness. Scale bar = 10 mm. B) Light micrographs of WT and nkd1 nkd2 o2. Scale bar = 10 μm. C) TEM images of AL and SA in WT and nkd1 nkd2 o2. Rows 1 and 3, low magnification. Scale bars = 5 μm. Rows 2 and 4, high magnification. Scale bars 1 μm. D) TEM images of starch (Row 1) and protein bodies (Row 2) in SE. Scale bar = 5 μm (Row 1) and 0.5 μm (Row 2). Aggregated starch granules are encircled. E) Starch content among the 8 genotypes. Values are the means of 4 biological replicates from 4 independent ears of each genotype, each replicate a pool of 3 endosperms. The letters above the bars represent significance levels (nonoverlapping letters indicate significant differences at P < 0.05) by pairwise t-test. Error bars represent Ses. F) Zein profiles among the 8 genotypes. Numbers following the lower case letters at the bottom of each column (a1, a2, …, a14) represent different HPLC peaks indicating different isoforms of the corresponding types of zeins. The letters in the heatmap grid represent significance levels (P < 0.05) by pairwise t-test. The colors in the heatmap grid represent relative amount of corresponding zein isoforms in arbitrary units (A.U.) based on the means of 3 biological replicates from 3 independent ears of each genotype, each replicate a pool of 3 endosperms. G) Relative nuclei number of the corresponding ploidy between WT and nkd1 nkd2 o2. Values are means of 4 biological replicates, from 2 independent ears of each genotype, 2 replicates per ear, each replicate a pool of 3 endosperms. * P < 0.05 and **P < 0.01, respectively, by pairwise t-test. Error bars represent Sd.
Figure 2.
Figure 2.
Transcriptomic relationships between genotypes from 8 to 16 DAP. A) PCA of the 8 genotypes at 8, 12, and 16 DAP in 4 biological replicates (n1 = nkd1, n2 = nkd2, n1o2_12 represents nkd1 o2 double mutant at 12 DAP). The arrow highlights the transcriptome of the nkd1 nkd2 o2 triple mutant at 16 DAP, which is close to the o2 single/double/triple mutants at 12 DAP. B) to L). Temporal change of the eigengenes (MEs) of the 8 genotypes at 3 timepoints within each of the 11 coexpression modules (M1 to M11). Enriched gene ontology (GO) terms are shown for each respective module with the FDR in parentheses.
Figure 3.
Figure 3.
Coexpression modules correlated with nkd1, 2, and o2 at individual timepoints and dynamic relationships of modules between different timepoints. A) The correlation of nkd1, nkd2, and o2 gene expression with the ME of corresponding coexpression modules at different DAPs (e.g. M12-5 represents the Module #5 at 12 DAP). The heatmap indicates positive (upregulation) or negative (downregulation) correlations between the 3 key TFs and the corresponding modules. *P < 0.05, **P < 0.01, and ***P < 0.001, respectively, by Pearson correlation test. B) Enriched gene ontology (GO) terms of the corresponding coexpression modules. The heatmap indicates –logFDR of the GO terms. C) The chord diagram shows the dynamic change of coexpression modules over time. The size of the arcs is proportional to the number of genes in the corresponding modules. The chord connecting 2 arcs represents genes expressed at both timepoints in the corresponding modules. D) The split and convergence of the modules over time. The main enriched GO terms are listed in the boxes corresponding to the modules. The FDR of each GO term is shown in parentheses. Lines connecting boxes represent genes overlapping between the 2 modules. The GO term(s) of the overlapping genes are listed above or below the line.
Figure 4.
Figure 4.
The effects of interaction between nkd1, nkd2, and o2 on DEGs and coexpression networks. A) Number of DEGs affected by corresponding interactions (e.g. nkd1-o2 represents the interaction effect of nkd1 and o2). B) Gene ontology (GO) terms affected by corresponding interactions (e.g. nkd1-o2 represents the interaction effect of nkd1 and o2). The heatmap represents –logFDR as shown on the scale (blue = 0, red = 10 or greater). C) Coexpression modules affected by corresponding interactions. The heatmap indicates the significance level, via hypergeometric test, of the overlap between the genes affected by corresponding interactions and the genes in the corresponding modules (e.g. M8-1 = module 8-1). Colors represent –logp as shown on the scale. D) The normalized relative gene expression by genotypes in selected modules. The uppercase letters represent significance levels (P < 0.05) by pairwise t-test of mean gene expression values of each genotype. The upper 2 graphs show overall suppression, while the lower 4 illustrate enhancement interactions between 2 individual factors. For example, D (M16-3) showed that the genes in this module were influenced by enhancement effect of nkd1–o2 interaction (expression in nkd1 o2 is significantly lower than the additive effect of nkd1 and o2). TPM, transcripts per million; M, module.
Figure 5.
Figure 5.
Overlap of endosperm tissue-preferential genes with DEGs, coexpression modules, or genes affected by interactions at 8 DAP. The upper number in the grid represents the number of overlapping genes, and the number in the parentheses represents the corresponding P-value via hypergeometric test. n1, n2, o2, n1o2, n2o2, n1n2, and n1n2o2 represent DEGs, relative to WT, of nkd1, nkd2, o2, nkd1 o2, nkd2 o2, nkd1 nkd2, and nkd1 nkd2 o2. M8-1 to M8-5 represent coexpression modules 8-1 to 8-5. nkd1-nkd2, nkd1-o2, nkd2-o2, and nkd1 nkd2-o2 represent interaction effects of nkd1 with nkd2, nkd1 with o2, nkd2 with o2, and nkd1 nkd2 with o2, respectively. CSE, central SE.
Figure 6.
Figure 6.
DAP-seq analysis of NKD1 and NKD2 and hierarchical network layout based on individual timepoint WGCNA and DAP-seq. A) Binding motif of NKD1 and NKD2. B) Venn diagram illustrating the number of NKD1 and NKD2 bound genes. C) Hypergeometric test of the NKD1, NKD2, and O2 bound genes overlapping with DEGs of the mutant genotypes at 8, 12, and 16 DAP. The upper number in the grid represents the number of overlapping genes, and the number in parentheses represents the corresponding P-value. D) Hierarchical gene network layout of selected coexpression modules generated via Cytoscape 3.7.2. The size of the circles is based on the tiers of the genes in the hierarchy. The heavy edges connect the TFs and their potential direct targets, and the light edges connect coexpressed genes in the corresponding modules that are not direct targets. E) Pull-down assay showed protein–protein interaction between IDDP10 and NKD1. IDDp10-6xHIS was used as bait, and NKD1 or NKD2 fused with GLUTATHIONE-S-TRANSFERASE (GST) were prey. In vitro translated proteins were mixed and applied to a 6xHIS affinity resin, followed by elution. Prey proteins were detected by immunoblot analysis using anti-GST antibodies. Lanes 1 to 3 show crude input, 4 to 6 show eluate. The IDDp10-6xHIS bait was able to bind to GST-NKD1 (lane 5, lower panel) but not to GST-NKD2 (lane 6), nor GST alone (lane 4). In the absence of bait protein, no prey proteins were retained by the resin (upper panel).
Figure 7.
Figure 7.
Chromatin accessibility profiles among genotypes of 16 DAP maize endosperm. A) PCA of accessible peaks among 8 genotypes (in 2 biological replicates). B) Number of differential peaks categorized by more opening (up) or closing (down) peaks at promoter or nonpromoter regions. C) Number of overlapping peaks between the ATAC-seq and DAP-seq analysis. D) Tracks of RNAseq (WT and nkd1 nkd2), DAPseq (NKD1, NKD2), and ATAC-seq (WT and nkd1 nkd2) of selected potential direct targets of NKD1 and/or NKD2 listed at Table 2. Differential peaks are highlighted with shading, and the potential NKD1 and/or NKD2 binding regions represented with magenta bars on the gene models. Numbers in brackets represent scale range of corresponding tracks. O2 is downregulated in nkd1 nkd2 (log2FC = −1.20, adjusted P = 0.0022), and MYBR24, HB75, and ARF1 are upregulated in nkd1 nkd2 (log2FC = 2.75, 1.75 and 1.87; adjusted P = 0.017, 1.41E−11, and 1.70E−14, respectively).
Figure 8.
Figure 8.
Models of NKD1, 2, and O2 regulating the transition processes in endosperm development. Processes are shown in boxes. Positive regulation is shown by red arrows, negative regulation by blue T-shaped lines, and interactions are represented by circles attached to the corresponding boxes.

References

    1. Ahern KR, Deewatthanawong P, Schares J, Muszynski M, Weeks R, Vollbrecht E, Duvick J, Brendel VP, Brutnell TP. Regional mutagenesis using dissociation in maize. Methods. 2009:49(3):248–254. 10.1016/j.ymeth.2009.04.009 - DOI - PubMed
    1. Bartlett A, O'Malley RC, Huang SSC, Galli M, Nery JR, Gallavotti A, Ecker JR. Mapping genome-wide transcription-factor binding sites using DAP-seq. Nat Protoc. 2017:12(8):1659–1672. 10.1038/nprot.2017.055 - DOI - PMC - PubMed
    1. Becraft PW, Yi G. Regulation of aleurone development in cereal grains. J Exp Bot. 2011:62(5):1669–1675. 10.1093/jxb/erq372 - DOI - PubMed
    1. Bolger AM, Lohse M, Usadel B. Trimmomatic: a flexible trimmer for Illumina sequence data. Bioinformatics. 2014:30(15):2114–2120. 10.1093/bioinformatics/btu170 - DOI - PMC - PubMed
    1. Bonke M, Thitamadee S, Mähönen AP, Hauser MT, Helariutta Y. APL regulates vascular tissue identity in Arabidopsis. Nature. 2003:426(6963):181–186. 10.1038/nature02100 - DOI - PubMed

MeSH terms