

Gender-dependent multiple cross-phenotype association of interferon lambda genetic variants with peripheral blood profiles in healthy individuals
- PMID: 37795763
- PMCID: PMC10767428
- DOI: 10.1002/mgg3.2292
Gender-dependent multiple cross-phenotype association of interferon lambda genetic variants with peripheral blood profiles in healthy individuals
Abstract
Background: Type III interferons (IFN), also called as lambda IFNs (IFN-λs), are antiviral and immunomodulatory cytokines that are evolutionarily important in humans. Given their central roles in innate immunity, they could be influencing other aspects of human biology. This study aimed to examine the association of genetic variants that control the expression and/or activity of IFN-λ3 and IFN-λ4 with multiple phenotypes in blood profiles of healthy individuals.
Methods: In a cohort of about 550 self-declared healthy individuals, after applying several exclusion criteria to determine their health status, we measured 30 blood parameters, including cellular, biochemical, and metabolic profiles. We genotyped them at rs12979860 and rs28416813 using competitive allele-specific PCR assays and tested their association with the blood profiles under dominant and recessive models for the minor allele. IFN-λ4 variants rs368234815 and rs117648444 were also genotyped or inferred.
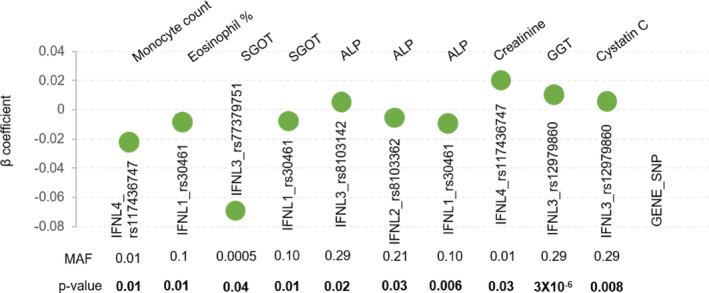
Results: We saw no association in the combined cohort under either of the models for any of the phenotypes. When we stratified the cohort based on gender, we saw a significant association only in males with monocyte (p = 1 × 10⁻³ ) and SGOT (p = 7 × 10⁻³ ) levels under the dominant model and with uric acid levels (p = 0.01) under the recessive model. When we tested the IFN-λ4 activity modifying variant within groupings based on absence or presence of one or two copies of IFN-λ4 and on different activity levels of IFN-λ4, we found significant (p < 0.05) association with several phenotypes like monocyte, triglyceride, VLDL, ALP, and uric acid levels, only in males. All the above significant associations did not show any confounding when we tested for the same with up to ten different demographic and lifestyle variables.
Conclusions: These results show that lambda interferons can have pleiotropic effects. However, gender seems to be an effect modifier, with males being more sensitive than females to the effect.
Keywords: IFNL; IFNL3; IFNL4; PheWAS; cross-phenotype association; interferon lambda; rs117648444; rs12979860; rs28416813; rs368234815; rs4803217.
© 2023 The Authors. Molecular Genetics & Genomic Medicine published by Wiley Periodicals LLC.
Conflict of interest statement
The authors declare no conflict of interest.
Figures


Similar articles
-
Evidence for a sex-dependent effect modification in the association between IFN-λ DNA polymorphisms and expression of IFN-λ and interferon-stimulated genes in human PBMCs.Cytokine. 2024 Dec;184:156779. doi: 10.1016/j.cyto.2024.156779. Epub 2024 Oct 17. Cytokine. 2024. PMID: 39423653
-
Identifying causal variants at the interferon lambda locus in case-control studies: Utilizing non-synonymous variant rs117648444 to probe the role of IFN-λ4.Gene. 2018 Jul 20;664:168-180. doi: 10.1016/j.gene.2018.04.076. Epub 2018 Apr 27. Gene. 2018. PMID: 29705128 Review.
-
Functional genetic variants of the IFN-λ3 (IL28B) gene and transcription factor interactions on its promoter.Cytokine. 2021 Jun;142:155491. doi: 10.1016/j.cyto.2021.155491. Epub 2021 Mar 13. Cytokine. 2021. PMID: 33725487 Free PMC article.
-
IFN-λ3, not IFN-λ4, likely mediates IFNL3-IFNL4 haplotype-dependent hepatic inflammation and fibrosis.Nat Genet. 2017 May;49(5):795-800. doi: 10.1038/ng.3836. Epub 2017 Apr 10. Nat Genet. 2017. PMID: 28394349
-
Genetics of the Human Interferon Lambda Region.J Interferon Cytokine Res. 2019 Oct;39(10):599-608. doi: 10.1089/jir.2019.0043. Epub 2019 May 8. J Interferon Cytokine Res. 2019. PMID: 31070498 Free PMC article. Review.
Cited by
-
IFN-λ3 is induced by Leishmania donovani and can inhibit parasite growth in cell line models but not in the mouse model, while it shows a significant association with leishmaniasis in humans.Infect Immun. 2024 Feb 13;92(2):e0050423. doi: 10.1128/iai.00504-23. Epub 2024 Jan 9. Infect Immun. 2024. PMID: 38193711 Free PMC article.
References
-
- Astudillo, P. , Angulo, J. , Pino, K. , de Carvalho, J. B. , de Morais, G. L. , Perez, S. , de Vasconcelos, A. T. , Ferrés, M. , & López‐Lastra, M. (2020). Correlation between female sex, IL28B genotype, and the clinical severity of bronchiolitis in pediatric patients. Pediatric Research, 87(4), 785–795. 10.1038/s41390-019-0623-1 - DOI - PMC - PubMed
-
- Bhushan, A. , Ghosh, S. , Bhattacharjee, S. , & Chinnaswamy, S. (2017). Confounding by single nucleotide polymorphism rs117648444 (P70S) affects the association of interferon lambda locus variants with response to interferon‐α‐ribavirin therapy in patients with chronic genotype 3 hepatitis C virus infection. Journal of Interferon & Cytokine Research, 37(8), 369–382. 10.1089/jir.2017.0002 - DOI - PubMed
MeSH terms
Substances
Grants and funding
LinkOut - more resources
Full Text Sources
