

Spindle assembly checkpoint insensitivity allows meiosis-II despite chromosomal defects in aged eggs
- PMID: 37795949
- PMCID: PMC10626445
- DOI: 10.15252/embr.202357227
Spindle assembly checkpoint insensitivity allows meiosis-II despite chromosomal defects in aged eggs
Abstract
Chromosome segregation errors in mammalian oocyte meiosis lead to developmentally compromised aneuploid embryos and become more common with advancing maternal age. Known contributors include age-related chromosome cohesion loss and spindle assembly checkpoint (SAC) fallibility in meiosis-I. But how effective the SAC is in meiosis-II and how this might contribute to age-related aneuploidy is unknown. Here, we developed genetic and pharmacological approaches to directly address the function of the SAC in meiosis-II. We show that the SAC is insensitive in meiosis-II oocytes and that as a result misaligned chromosomes are randomly segregated. Whilst SAC ineffectiveness in meiosis-II is not age-related, it becomes most prejudicial in oocytes from older females because chromosomes that prematurely separate by age-related cohesion loss become misaligned in meiosis-II. We show that in the absence of a robust SAC in meiosis-II these age-related misaligned chromatids are missegregated and lead to aneuploidy. Our data demonstrate that the SAC fails to prevent cell division in the presence of misaligned chromosomes in oocyte meiosis-II, which explains how age-related cohesion loss can give rise to aneuploid embryos.
Keywords: KIF18A; ageing; aneuploidy; oocyte meiosis; spindle assembly checkpoint.
© 2023 The Authors.
Conflict of interest statement
The authors declare that they have no conflict of interest.
Figures
- A, B
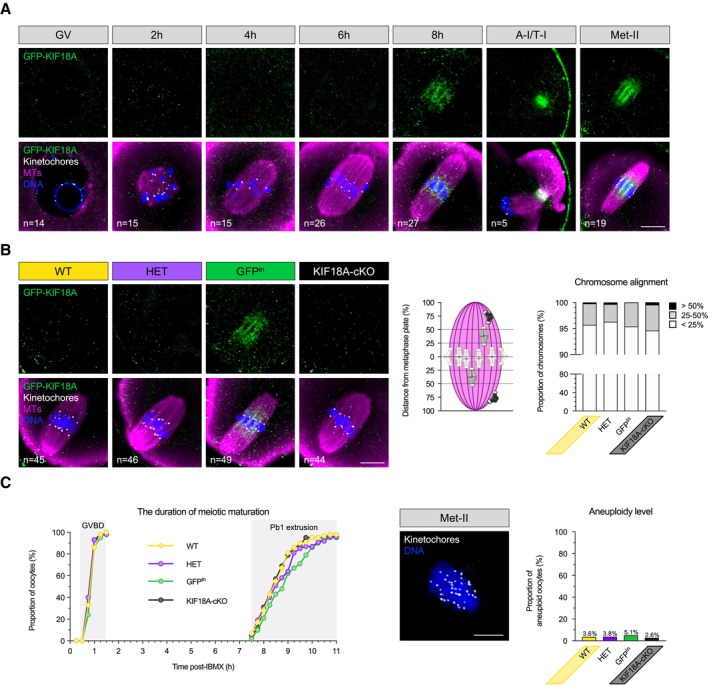
(A) GFP‐KIF18A protein is first detected in late M‐I (Kif18a wt/GFP oocytes; GV—germinal vesicle; h—hours post‐IBMX release, A‐I/T‐I—anaphase‐I/telophase‐I; Met‐II—metaphase‐II). (B) Late (8 h) M‐I stage spindles in WT (Kif18a wt/wt ), HET (Kif18a wt/Δ ), GFPin (Kif18a GFP/GFP ) and KIF18A‐cKO (Kif18a Δ/Δ ) oocytes. Chart shows no difference in chromosome alignment between KIF18A‐cKO and controls (χ2‐test, P = 0.36). In (A and B), DNA is labelled with Hoechst33342 (blue), kinetochores with CREST (grey) and GFP‐KIF18A and microtubules (MTs) with chicken‐GFP (green) and β‐Tubulin (magenta) antibodies, respectively. ‘n’ is the total number of oocytes per group. Scale bars, 10 μm.
- C
Charts show no difference in meiotic maturation rate (one‐way ANOVA with multiple comparisons) and aneuploidy level (χ2‐test, P = 0.33) between KIF18A‐cKO oocytes (n = 38) and controls (WT [n = 55], HET [n = 52], GFPin [n = 39]; GVBD—germinal vesicle break‐down; Pb1—first polar body). An exemplar WT Met‐II oocyte used in chromosome number assessment. DNA is labelled with Hoechst33342 (blue) and kinetochores with HEC1 antibody (grey). Scale bar, 5 μm.
- A
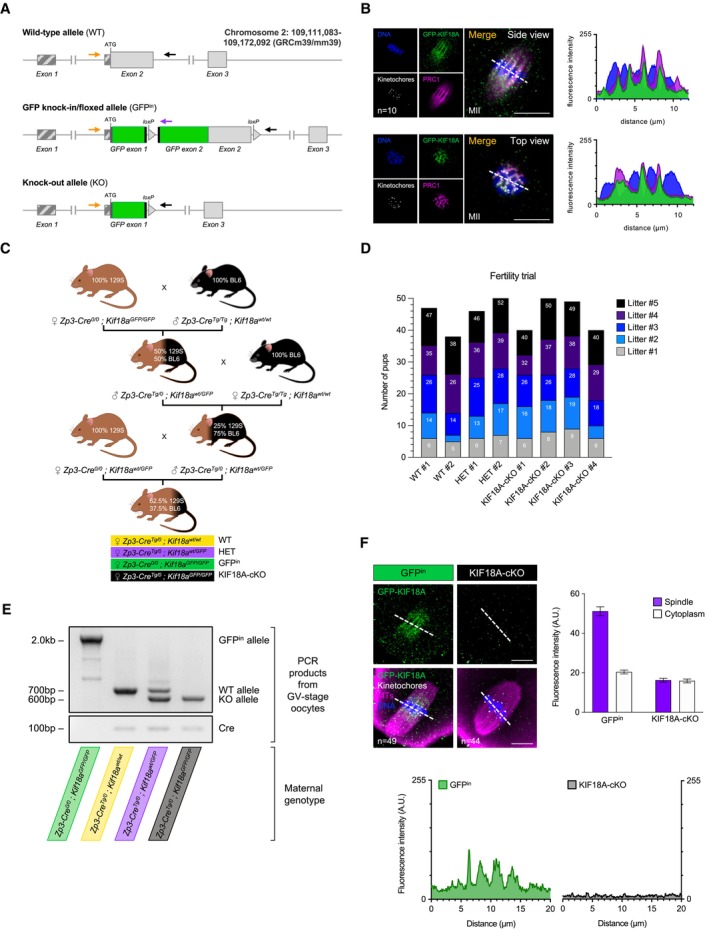
Schematic representation of Kif18a alleles. Top: Wild‐type Kif18a allele (WT). Middle: GFP knock‐in/floxed (GFPin) allele with two GFP exons and an artificial intron inserted immediately after the start codon to produce N‐terminally tagged fusion protein (GFP‐KIF18A). Bottom: Kif18a knock‐out (KO) allele produced following simultaneous Cre recombinase‐mediated excision of GFP‐ and Kif18a‐exon 2. Arrows indicate the position of genotyping primers.
- B
GFP‐KIF18A colocalizes with the midzone protein PRC1 in Kif18a wt/GFP Met‐II eggs (no Cre‐recombinase). Chromosomes are labelled with Hoechst33342 (blue), kinetochores with CREST (grey), midzone with PRC1 (magenta) and GFP‐KIF18A with chicken‐GFP (green) antibodies. ‘n’ is the total number of Met‐II eggs per group. Scale bars, 10 μm.
- C
Breeding strategy to generate female littermates with 4 denoted genotypes.
- D
Graph shows no notable difference in fertility between Zp3‐Cre Tg/0 ; Kif18a GFP/GFP females (KIF18A‐cKO oocytes) and controls (Zp3‐Cre Tg/0 ; Kif18a wt/wt [WT] and Zp3‐Cre Tg/0 ; Kif18a wt/GFP [HET]) after 5 generations of pups (one‐way ANOVA with multiple comparisons), consistent with our observation that a majority of KIF18A‐cKO eggs correctly align their chromosomes.
- E
PCR genotyping confirms successful conditional Kif18a deletion (cKO) in GV‐stage oocytes (10 oocytes per group).
- F
GFPin but not KIF18A‐cKO oocytes show significantly increased GFP‐KIF18A levels at spindle vs. cytoplasm (paired t‐test, P < 0.0001 and P = 0.31, respectively). DNA is labelled with Hoechst33342 (blue) and GFP‐KIF18A, kinetochores and microtubules (MTs) are detected with chicken‐GFP (green), HEC1 (grey) and β‐Tubulin (magenta) antibodies, respectively. Scale bars, 10 μm. Error bars represent SEM. Data from totals of 49 and 44 oocytes across 3 experimental days, for GFPin and KIF18A‐cKO groups, respectively.
- A
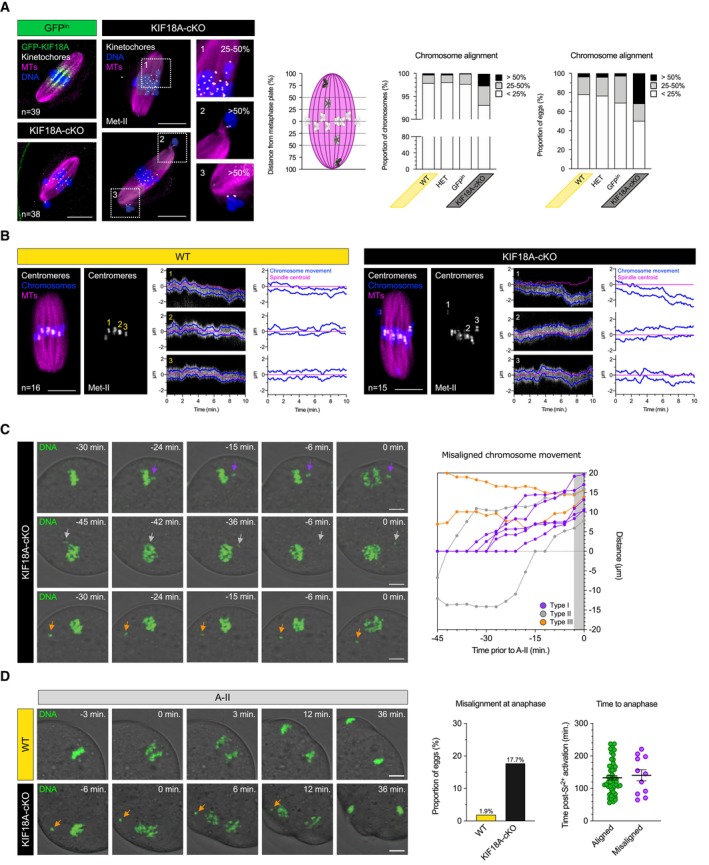
Met‐II‐spindles in GFPin and KIF18A‐cKO oocytes. Insets show mildly (25–50%) and severely (> 50%) misaligned chromosomes in KIF18A‐cKO Met‐II eggs. Note that misaligned chromosomes are pairs of sister chromatids. DNA is labelled with Hoechst33342 (blue) and GFP‐KIF18A, kinetochores and microtubules (MTs) are detected with chicken‐GFP (green), HEC1 (grey) and β‐Tubulin (magenta) antibodies, respectively. Charts show increased chromosome misalignment in KIF18A‐cKO (n = 38) vs. control Met‐II eggs (WT [n = 55], HET [n = 51], GFPin [n = 39]; χ2‐test, P < 0.02). Scale bars, 10 μm.
- B
High temporal resolution live imaging of chromosome movements in WT and KIF18A‐cKO Met‐II eggs. Chromosomes are visualised with H2B‐RFP (blue), centromeres with Maj.Sat.‐mClover (grey) and spindle with SiR‐Tubulin (magenta). Kymographs show individual chromosome movement along the vertical spindle axis. Charts show centromere movements (blue) relative to spindle centroid (magenta). ‘n’ is the total number of Met‐II eggs per group. Scale bars, 10 μm.
- C
Time‐lapse confocal images depicting three types of misaligned chromosome behaviour in KIF18A‐cKO Met‐II eggs (left) with graphical representation of their movement (right). Top: aligned chromosome wanders of the metaphase plate shortly prior anaphase (purple; n = 5/9). Middle: misaligned chromosome travels to the opposite spindle pole (grey; n = 2/9). Bottom: chromosome remains misaligned near the same spindle pole throughout the movie (orange; n = 2/9). Purple, grey and orange arrows respectively indicate exemplary misaligned chromosomes for each type of movement.
- D
Anaphase‐II (A‐II) with ostensibly normal chromosome segregation in WT (top) and severely misaligned chromosome (orange arrow) in KIF18A‐cKO (bottom) eggs. Charts show significantly increased proportion of KIF18A‐cKO (n = 62) vs. WT (n = 53) eggs with misaligned chromosomes (χ2‐test, P < 0.01) and no anaphase delay in KIF18A‐cKO eggs (unpaired t‐test, P = 0.66). Error bars represent SEM.
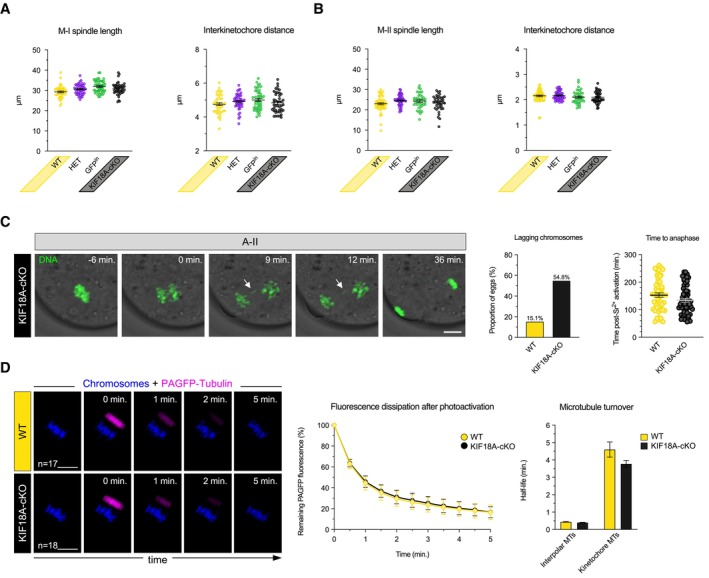
- A, B
Charts show no impact of KIF18a removal on spindle length and interkinetochore distance in late M‐I (A) and M‐II (B) (one‐way ANOVA with multiple comparisons). Error bars represent SEM. For late M‐I, data from totals of 45, 46, 49 and 44 oocytes across 3 experimental days, for WT, HET, GFPin and KIF18A‐cKO groups, respectively. For M‐II, data from totals of 55, 53, 39 and 39 oocytes across 3 experimental days, for WT, HET, GFPin and KIF18A‐cKO groups, respectively.
- C
Time‐lapse confocal images show anaphase with lagging chromosome (white arrow) in KIF18A‐cKO Met‐II egg. Charts show significant increase in lagging chromosomes formation (χ2‐test, P < 0.00001) and no difference in anaphase onset timing (unpaired t‐test, P = 0.07) in KIF18A‐cKO (n = 62) vs. WT (n = 53) Met‐II eggs. DNA is visualised with SiR‐DNA (green) and indicated time (min) is relative to the anaphase onset. Error bars represent SEM.
- D
Time‐lapse confocal images show dissipation of PAGFP‐Tubulin fluorescent signal (magenta) in WT and KIF18A‐cKO Met‐II eggs. Chromosomes are visualised with H2B‐RFP (blue). The ‘0 min’ marks the first frame after photoactivation. The fluorescence dissipation after photoactivation curve shows the average decay rate of PAGFP‐Tubulin in WT and KIF18A‐cKO Met‐II eggs (as mean ± SEM for each time‐point). Chart shows no significant difference in the stable/non‐stable MT turnover rates between the groups (unpaired t‐test, P = 0.09 for stable and P = 0.08 for non‐stable MTs). ‘n’ is the total number of Met‐II eggs per group.
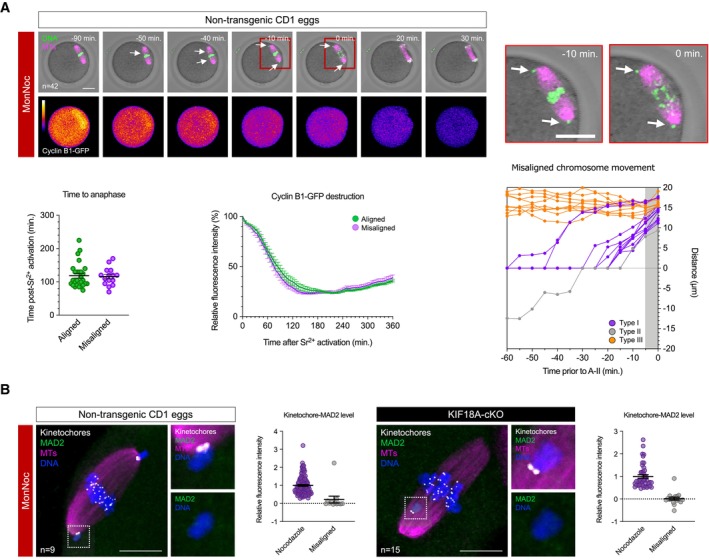
- A
Time‐lapse confocal images show meiotic exit despite misaligned chromosomes in MonNoc Met‐II eggs. White arrows denote misaligned chromosomes and insets depict their behaviour during anaphase. Chromosomes are visualised with SiR‐DNA (green) and spindle with SPY555‐Tubulin (magenta). Bottom panels show changes in Cyclin B1‐GFP levels (colour gradient) over time. Indicated time (min) is relative to anaphase onset. Scale bars, 20 μm. Charts show no change in anaphase onset timing (unpaired t‐test, P = 0.79) or Cyclin B1‐GFP destruction dynamics (unpaired t‐test, P = 0.99) by misaligned chromosomes and three types of misaligned chromosome behaviour in MonNoc eggs. Error bars represent SEM. Data from total of 42 oocytes across 2 experimental days.
- B
MAD2 immunofluorescence (green) in MonNoc and KIF18A‐cKO Met‐II eggs with graphs showing quantification of kinetochore‐MAD2 signal. Note significantly lower levels of kinetochore‐MAD2 at misaligned chromosomes in MonNoc and KIF18A‐cKO eggs compared to eggs treated with nocodazole alone (Mann Whitney test, P < 0.0001 for both MonNoc and KIF18A‐cKO eggs). Chromosomes are labelled with Hoechst33342 (blue), whilst kinetochores (grey) and microtubules (magenta) are detected with CREST and β‐Tubulin antibodies, respectively. Scale bars, 10 μm. Error bars represent SEM. Data from totals of 9 and 15 oocytes across 3 experimental days, for MonNoc and KIF18A‐cKO groups, respectively.
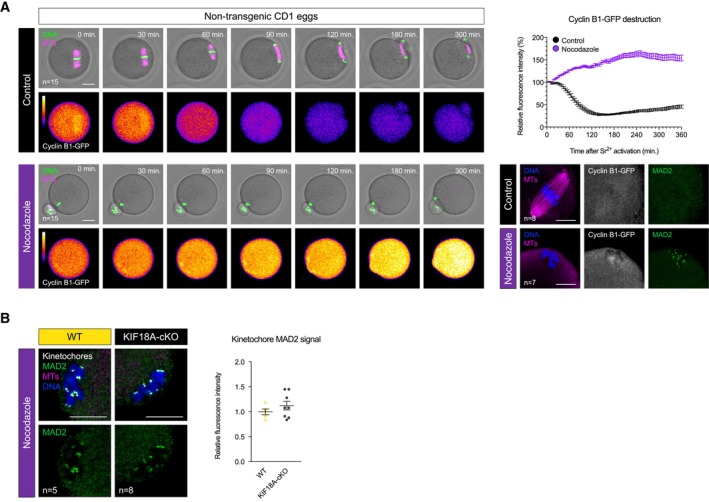
- A
Time‐lapse confocal images (left) show nocodazole‐treated and control non‐transgenic Met‐II eggs following Sr2+ activation. Note the lack of Cyclin B1‐GFP destruction and chromosome segregation in nocodazole group. Indicated time (min) is relative to Sr2+ addition. DNA is visualised with SiR‐DNA (green) and spindle with SPY555‐Tubulin (magenta). Scale bars, 20 μm. Graph (top right) shows changes in Cyclin B1‐GFP levels over time. Confocal images (bottom right) show kinetochore‐MAD2 recruitment following nocodazole addition. Chromosomes are labelled with Hoechst33342 (blue), and Cyclin B1‐GFP (grey) and microtubules (magenta) with chicken‐GFP and β‐Tubulin antibodies, respectively. Scale bars, 10 μm.
- B
MAD2 immunofluorescence (green) in nocodazole‐treated WT and KIF18A‐cKO Met‐II eggs. Chart shows no difference in kinetochore‐MAD2 levels between the groups (unpaired t‐test, P = 0.33). DNA is labelled with Hoechst33342 (blue), and kinetochores (grey) and microtubules (magenta) with CREST and β‐Tubulin antibodies, respectively. Scale bars, 10 μm.
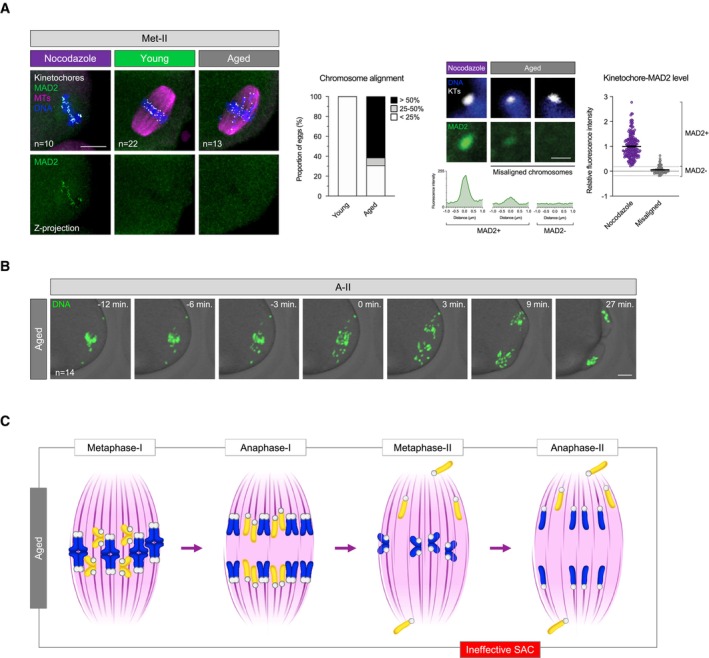
- A
MAD2 immunofluorescence (green) in young and aged Met‐II eggs (nocodazole‐treated young Met‐II eggs served as a positive control). Graph shows age‐related increase in proportion of Met‐II eggs with misaligned chromosomes (Fisher's Exact test, P < 0.0001). Exemplar weak MAD2+ and MAD2− misaligned chromatids are shown. Graph shows significantly lower levels of kinetochore‐MAD2 at misaligned chromatids in aged eggs compared to eggs treated with nocodazole alone (Mann Whitney, P < 0.0001). Chromosomes are labelled with Hoechst33342 (blue), kinetochores (grey) with CREST and microtubules (magenta) with β‐Tubulin antibody. Scale bars, 10 μm (left) and 1 μm (right). Error bars represent SEM. Data from totals of 10, 22 and 13 oocytes across 2 experimental days, for nocodazole, young and aged groups, respectively.
- B
Time‐lapse confocal images show aged Met‐II eggs successfully completing M‐II following Sr2+ activation despite chromosome misalignment. DNA is visualised with SiR‐DNA (green) and indicated time (min) is relative to the anaphase onset. Scale bars, 10 μm. ‘n’ is the total number of aged Met‐II eggs.
- C
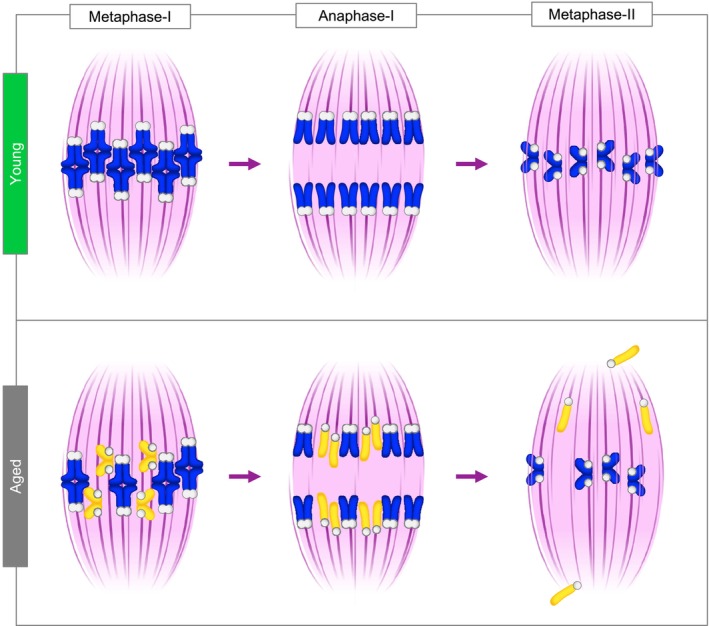
Schematic shows a series of events during female meiosis that leads to age‐related aneuploidy in embryo. Age‐related cohesion loss leads to premature separation of homologue chromosomes and consequent biorientation of sister chromatids in meiosis‐I. This causes premature sister chromatid disjunction during anaphase‐I and the presence of individualised misaligned chromatids in Met‐II eggs. SAC ineffectiveness to detect misaligned chromosomes allows anaphase‐II entry and random segregation of individualised chromatids that results in embryo aneuploidy.
References
-
- Angell RR (1991) Predivision in human oocytes at meiosis I: a mechanism for trisomy formation in man. Hum Genet 86: 383–387 - PubMed
-
- Angell RR, Xian J, Keith J (1993) Chromosome anomalies in human oocytes in relation to age. Hum Reprod 8: 1047–1054 - PubMed
-
- Battaglia DE, Goodwin P, Klein NA, Soules MR (1996) Influence of maternal age on meiotic spindle assembly in oocytes from naturally cycling women. Hum Reprod 11: 2217–2222 - PubMed
Publication types
MeSH terms
Grants and funding
LinkOut - more resources
Full Text Sources
Molecular Biology Databases
