Successful weight regain attenuation by autologous fecal microbiota transplantation is associated with non-core gut microbiota changes during weight loss; randomized controlled trial
- PMID: 37796016
- PMCID: PMC10557561
- DOI: 10.1080/19490976.2023.2264457
Successful weight regain attenuation by autologous fecal microbiota transplantation is associated with non-core gut microbiota changes during weight loss; randomized controlled trial
Abstract
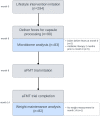
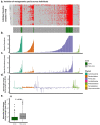
We previously reported that autologous-fecal-microbiota-transplantation (aFMT), following 6 m of lifestyle intervention, attenuated subsequent weight regain and insulin rebound for participants consuming a high-polyphenol green-Mediterranean diet. Here, we explored whether specific changes in the core (abundant) vs. non-core (low-abundance) gut microbiome taxa fractions during the weight-loss phase (0-6 m) were differentially associated with weight maintenance following aFMT. Eighty-two abdominally obese/dyslipidemic participants (age = 52 years; 6 m weightloss = -8.3 kg) who provided fecal samples (0 m, 6 m) were included. Frozen 6 m's fecal samples were processed into 1 g, opaque and odorless aFMT capsules. Participants were randomly assigned to receive 100 capsules containing their own fecal microbiota or placebo over 8 m-14 m in ten administrations (adherence rate > 90%). Gut microbiome composition was evaluated using shotgun metagenomic sequencing. Non-core taxa were defined as ≤ 66% prevalence across participants. Overall, 450 species were analyzed. At baseline, 13.3% were classified as core, and Firmicutes presented the highest core proportion by phylum. During 6 m weight-loss phase, abundance of non-core species changed more than core species (P < .0001). Subject-specific changes in core and non-core taxa fractions were strongly correlated (Jaccard Index; r = 0.54; P < .001). Following aFMT treatment, only participants with a low 6 m change in core taxa, and a high change in non-core taxa, avoided 8-14 m weight regain (aFMT = -0.58 ± 2.4 kg, corresponding placebo group = 3.18 ± 3.5 kg; P = .02). In a linear regression model, low core/high non-core 6 m change was the only combination that was significantly associated with attenuated 8-14 m weight regain (P = .038; P = .002 for taxa patterns/treatment intervention interaction). High change in non-core, low-abundance taxa during weight-loss might mediate aFMT treatment success for weight loss maintenance.ClinicalTrials.gov: NCT03020186.
Keywords: FMT; Low-abundance taxa; aFMT; core microbiome; lifestyle intervention; weight regain.
Conflict of interest statement
Iris Shai advises the nutritional committee of Hinoman, Ltd. Ilan Youngster is an advisor for Mybiotics Ltd. Dan Knights is CEO of, and holds equity in, CoreBiome, Inc.
Figures


References
-
- Van Der Gast CJ, Walker AW, Stressmann FA, Rogers GB, Scott P, Daniels TW, Carroll MP, Parkhill J, Bruce KD. Partitioning core and satellite taxa from within cystic fibrosis lung bacterial communities. ISME J [Internet]. 2011;5:780–791. [accessed 2022 Aug 6]. doi: 10.1038/ismej.2010.175. - DOI - PMC - PubMed
Publication types
MeSH terms
Associated data
Grants and funding
LinkOut - more resources
Full Text Sources
Medical
