

Multiple mutations of SARS-CoV-2 Omicron BA.2 variant orchestrate its virological characteristics
- PMID: 37796123
- PMCID: PMC10781145
- DOI: 10.1128/jvi.01011-23
Multiple mutations of SARS-CoV-2 Omicron BA.2 variant orchestrate its virological characteristics
Abstract
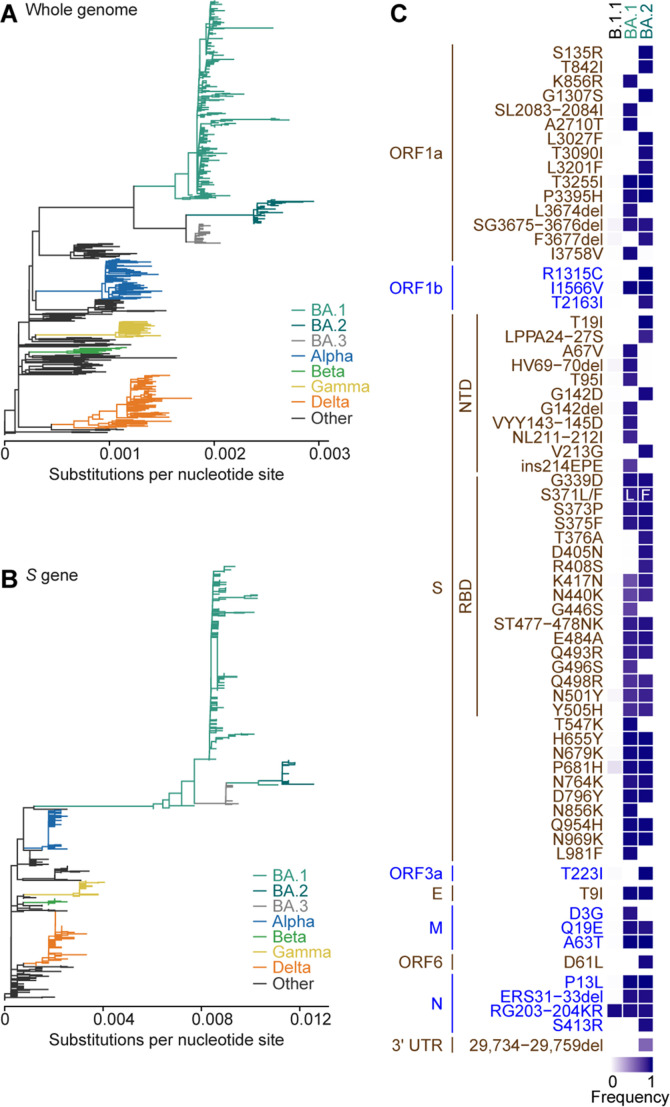
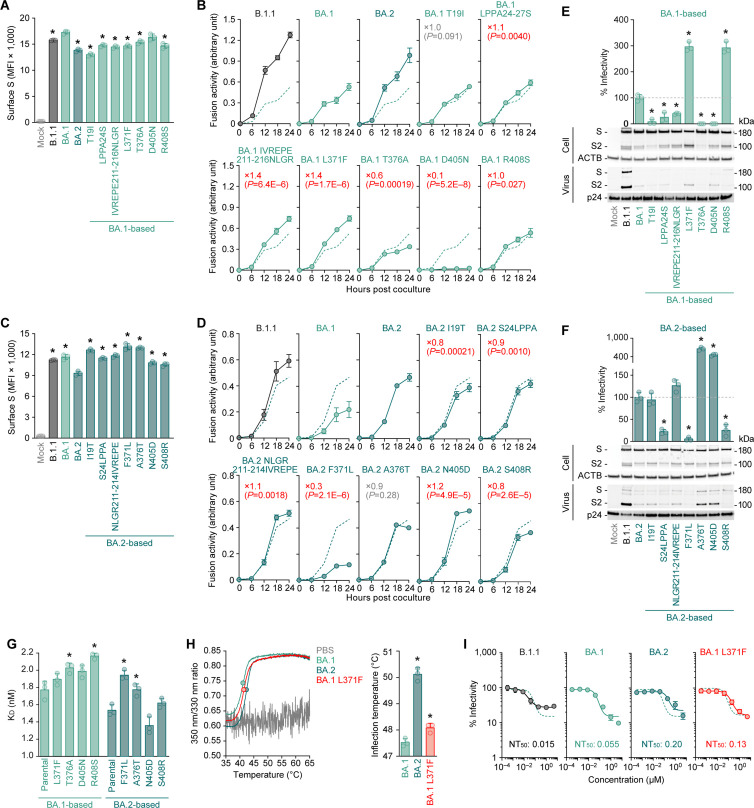
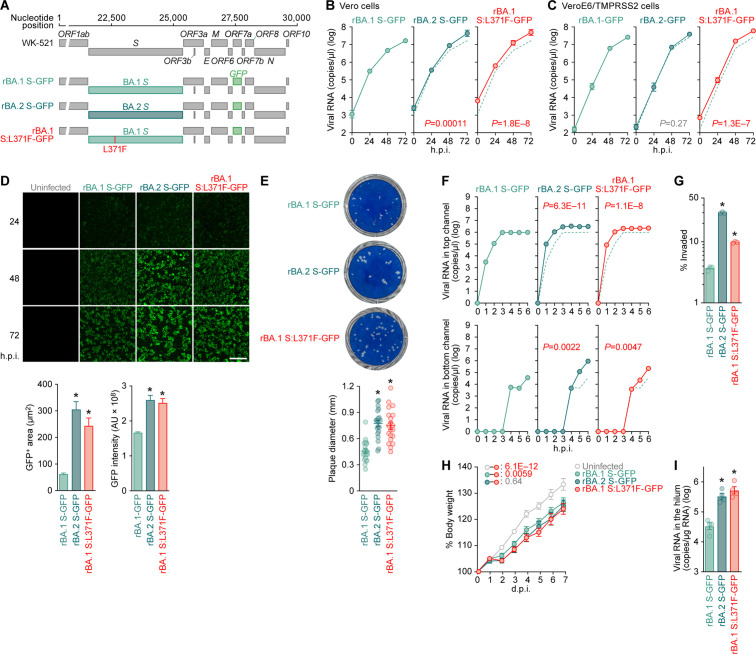
Most studies investigating the characteristics of emerging SARS-CoV-2 variants have been focusing on mutations in the spike proteins that affect viral infectivity, fusogenicity, and pathogenicity. However, few studies have addressed how naturally occurring mutations in the non-spike regions of the SARS-CoV-2 genome impact virological properties. In this study, we proved that multiple SARS-CoV-2 Omicron BA.2 mutations, one in the spike protein and another downstream of the spike gene, orchestrally characterize this variant, shedding light on the importance of Omicron BA.2 mutations out of the spike protein.
Keywords: BA.1; BA.2; COVID-19; Omicron; SARS-CoV-2; fusogenicity; growth capacity; immune resistance; pathogenicity.
Conflict of interest statement
The authors declare no conflict of interest.
Figures
References
-
- WHO . 2022. Tracking SARS-CoV-2 variants. Available from: https://www.who.int/en/activities/tracking-SARS-CoV-2-variants
-
- Suzuki R, Yamasoba D, Kimura I, Wang L, Kishimoto M, Ito J, Morioka Y, Nao N, Nasser H, Uriu K, Kosugi Y, Tsuda M, Orba Y, Sasaki M, Shimizu R, Kawabata R, Yoshimatsu K, Asakura H, Nagashima M, Sadamasu K, Yoshimura K, Sawa H, Ikeda T, Irie T, Matsuno K, Tanaka S, Fukuhara T, Sato K, Genotype to Phenotype Japan (G2P-Japan) Consortium . 2022. Attenuated fusogenicity and pathogenicity of SARS-CoV-2 Omicron variant. Nature 603:700–705. doi:10.1038/s41586-022-04462-1 - DOI - PMC - PubMed
-
- Yamasoba D, Kimura I, Nasser H, Morioka Y, Nao N, Ito J, Uriu K, Tsuda M, Zahradnik J, Shirakawa K, Suzuki R, Kishimoto M, Kosugi Y, Kobiyama K, Hara T, Toyoda M, Tanaka YL, Butlertanaka EP, Shimizu R, Ito H, Wang L, Oda Y, Orba Y, Sasaki M, Nagata K, Yoshimatsu K, Asakura H, Nagashima M, Sadamasu K, Yoshimura K, Kuramochi J, Seki M, Fujiki R, Kaneda A, Shimada T, Nakada T-A, Sakao S, Suzuki T, Ueno T, Takaori-Kondo A, Ishii KJ, Schreiber G, Sawa H, Saito A, Irie T, Tanaka S, Matsuno K, Fukuhara T, Ikeda T, Sato K, Genotype to Phenotype Japan (G2P-Japan) Consortium . 2022. Virological characteristics of the SARS-CoV-2 Omicron BA.2 spike. Edited by Sawa H., Saito A., Irie T., Tanaka S., Matsuno K., Fukuhara T., and Ikeda T.. Cell 185:2103–2115. doi:10.1016/j.cell.2022.04.035 - DOI - PMC - PubMed
-
- Lyngse FP, Kirkeby CT, Denwood M, Christiansen LE, Mølbak K, Møller CH, Skov RL, Krause TG, Rasmussen M, Sieber RN, Johannesen TB, Lillebaek T, Fonager J, Fomsgaard A, Møller FT, Stegger M, Overvad M, Spiess K, Mortensen LH. 2022. Household transmission of SARS-CoV-2 Omicron variant of concern subvariants BA.1 and BA.2 in Denmark. Nat Commun 13:5760. doi:10.1038/s41467-022-33498-0 - DOI - PMC - PubMed
-
- Meng B, Abdullahi A, Ferreira IATM, Goonawardane N, Saito A, Kimura I, Yamasoba D, Gerber PP, Fatihi S, Rathore S, Zepeda SK, Papa G, Kemp SA, Ikeda T, Toyoda M, Tan TS, Kuramochi J, Mitsunaga S, Ueno T, Shirakawa K, Takaori-Kondo A, Brevini T, Mallery DL, Charles OJ, Bowen JE, Joshi A, Walls AC, Jackson L, Martin D, Smith KGC, Bradley J, Briggs JAG, Choi J, Madissoon E, Meyer KB, Mlcochova P, Ceron-Gutierrez L, Doffinger R, Teichmann SA, Fisher AJ, Pizzuto MS, de Marco A, Corti D, Hosmillo M, Lee JH, James LC, Thukral L, Veesler D, Sigal A, Sampaziotis F, Goodfellow IG, Matheson NJ, Sato K, Gupta RK, CITIID-NIHR BioResource COVID-19 Collaboration, Genotype to Phenotype Japan (G2P-Japan) Consortium, Ecuador-COVID19 Consortium . 2022. Altered TMPRSS2 usage by SARS-CoV-2 Omicron impacts tropism and fusogenicity. Nature 603:706–714. doi:10.1038/s41586-022-04474-x - DOI - PMC - PubMed
Publication types
MeSH terms
Substances
Supplementary concepts
Grants and funding
- JP223fa627001/Japan Agency for Medical Research and Development (AMED)
- JP223fa727002/Japan Agency for Medical Research and Development (AMED)
- JP223fa627009/Japan Agency for Medical Research and Development (AMED)
- JP22fk0108511/Japan Agency for Medical Research and Development (AMED)
- JP22fk0108516/Japan Agency for Medical Research and Development (AMED)
- JP22fk0108506/Japan Agency for Medical Research and Development (AMED)
- JP22fk0108146/Japan Agency for Medical Research and Development (AMED)
- JP21fk0108494/Japan Agency for Medical Research and Development (AMED)
- JP21fk0108425/Japan Agency for Medical Research and Development (AMED)
- JP21fk0108432/Japan Agency for Medical Research and Development (AMED)
- JP21fk0108465/Japan Agency for Medical Research and Development (AMED)
- JP21fk0108493/Japan Agency for Medical Research and Development (AMED)
- JP22fk0108516/Japan Agency for Medical Research and Development (AMED)
- JP21fk0108574/Japan Agency for Medical Research and Development (AMED)
- JP22fk0108617/Japan Agency for Medical Research and Development (AMED)
- JP22fk0410033/Japan Agency for Medical Research and Development (AMED)
- JP22fk0410039/Japan Agency for Medical Research and Development (AMED)
- JP22fk0410047/Japan Agency for Medical Research and Development (AMED)
- JP22fk0410055/Japan Agency for Medical Research and Development (AMED)
- JP23fk0410047/Japan Agency for Medical Research and Development (AMED)
- JP23fk0410056/Japan Agency for Medical Research and Development (AMED)
- JP23fk0410058/Japan Agency for Medical Research and Development (AMED)
- JP22jk0210039/Japan Agency for Medical Research and Development (AMED)
- JP22wm0325009/Japan Agency for Medical Research and Development (AMED)
- CREST JP21gm1610005/Japan Agency for Medical Research and Development (AMED)
- CREST JP22gm1610008/Japan Agency for Medical Research and Development (AMED)
- PRESTO JPMJPR22R1/Japan Science an Technology Agency (JST)
- CREST JPMJCR20H4/Japan Science an Technology Agency (JST)
- CREST JPMJCR20H6/Japan Science an Technology Agency (JST)
- CREST JPMJCR20H8/Japan Science an Technology Agency (JST)
- SPRING JPMJSP2108/Japan Science an Technology Agency (JST)
- KAKENHI 20K15767/Japan Society for the Promotion of Science (JSPS)
- KAKENHI 23K14526/Japan Society for the Promotion of Science (JSPS)
- JPJSCCA20190008/Japan Society for the Promotion of Science (JSPS)
- KAKENHI 20H05773/Japan Society for the Promotion of Science (JSPS)
- KAKENHI 21H02736/Japan Society for the Promotion of Science (JSPS)
- KAKENHI 22K07103/Japan Society for the Promotion of Science (JSPS)
- KAKENHI 22K16375/Japan Society for the Promotion of Science (JSPS)
- DC2 22J11578/Japan Society for the Promotion of Science (JSPS)
- JSPS Leading Initiative for Excellent Young Researchers (LEADER); number has not been assigned/Japan Society for the Promotion of Science (JSPS)
- Takeda Science Foundation
- Mochida Memorial Foundation for Medical and Pharmaceutical Research
- Naito Foundation
- Shin-Nihon Foundation of Advanced Medical Research
- Waksman Foundation of Japan
- Intramural grant from Kumamoto University COVID-19 Research Projects (AMABIE)
- Ito Foundation Research Grant
- International Joint Research Project of the Institute of Medical Science, the University of Tokyo
- LX22NPO5103/European Union, Next Generation EU
LinkOut - more resources
Full Text Sources
Research Materials
Miscellaneous
