. 2023 Nov 22;8(22):e172510.
doi: 10.1172/jci.insight.172510.

Airway surveillance and lung viral control by memory T cells induced by COVID-19 mRNA vaccine

Affiliations

Airway surveillance and lung viral control by memory T cells induced by COVID-19 mRNA vaccine

Brock Kingstad-Bakke et al. JCI Insight. .

Abstract

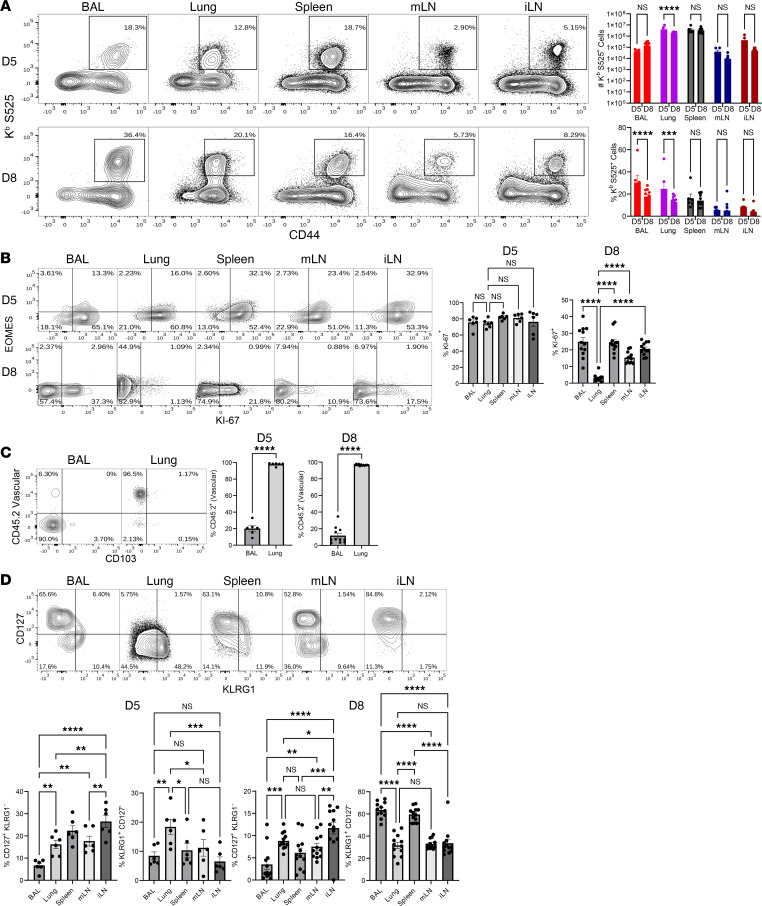
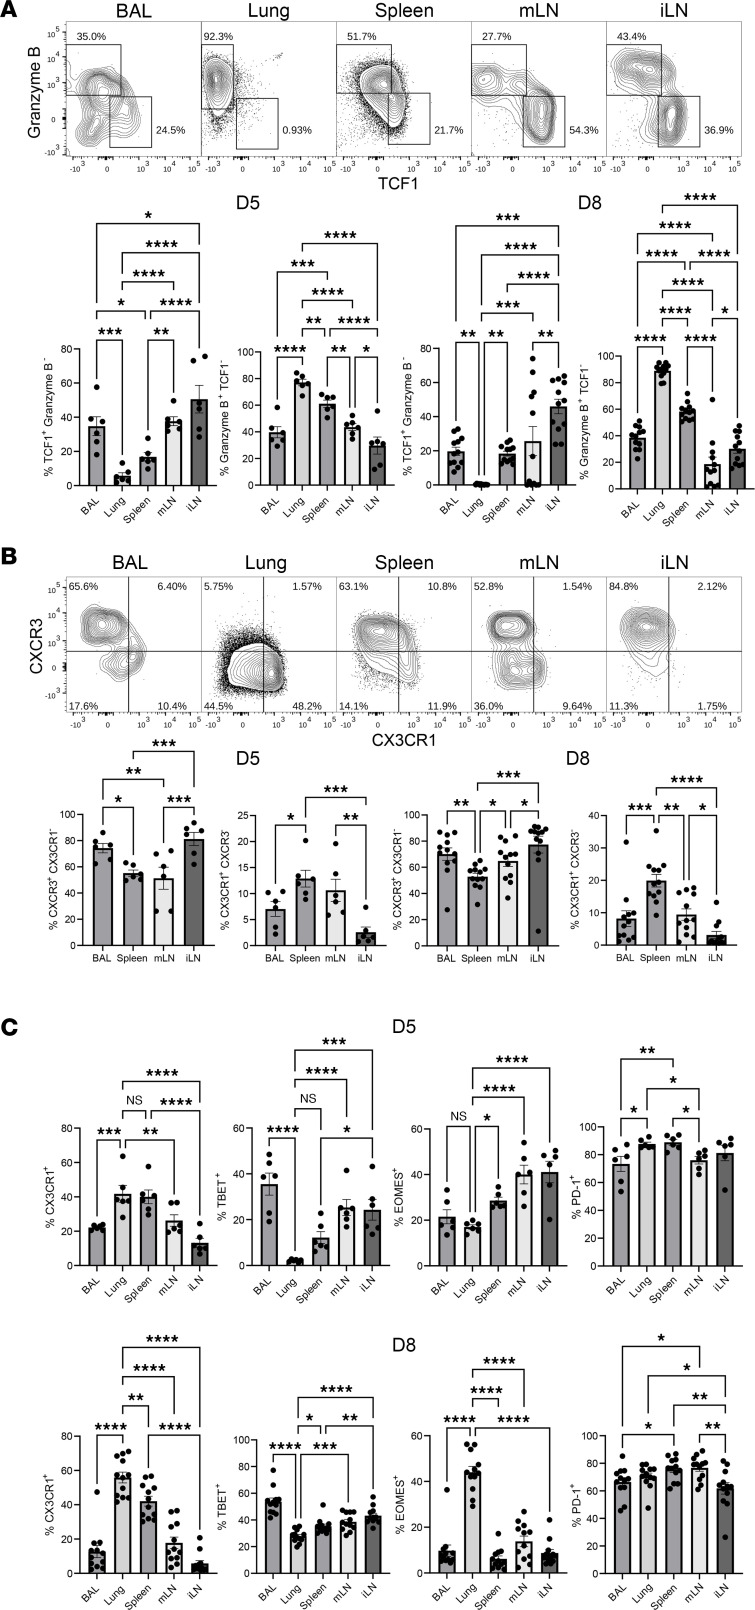
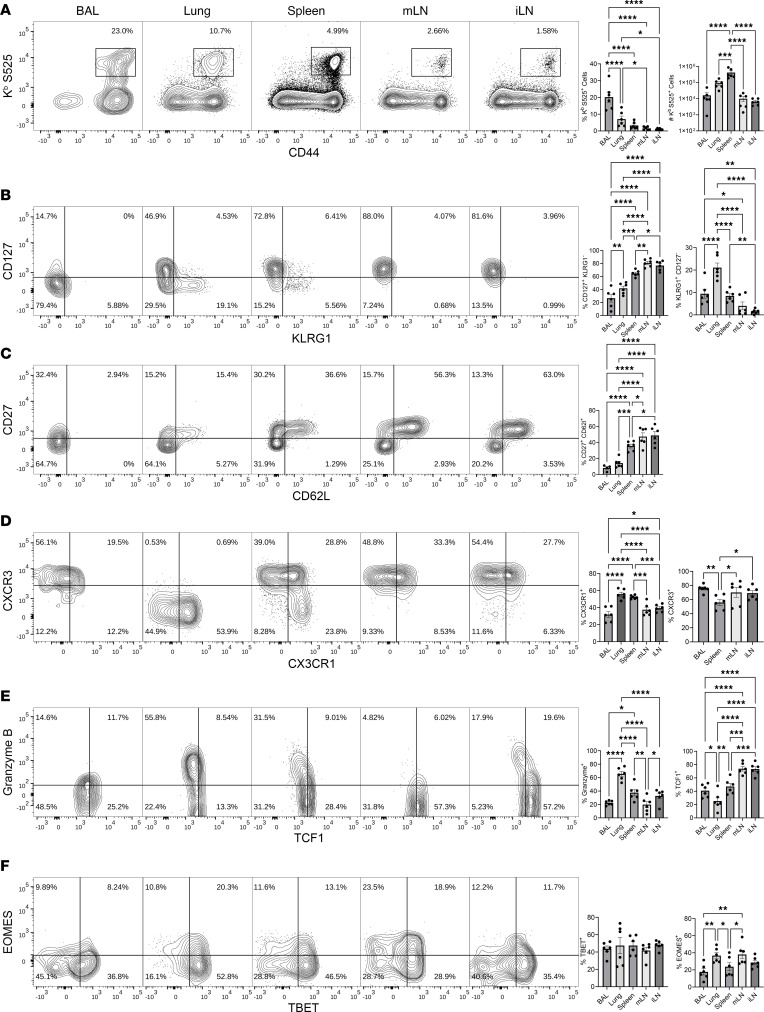
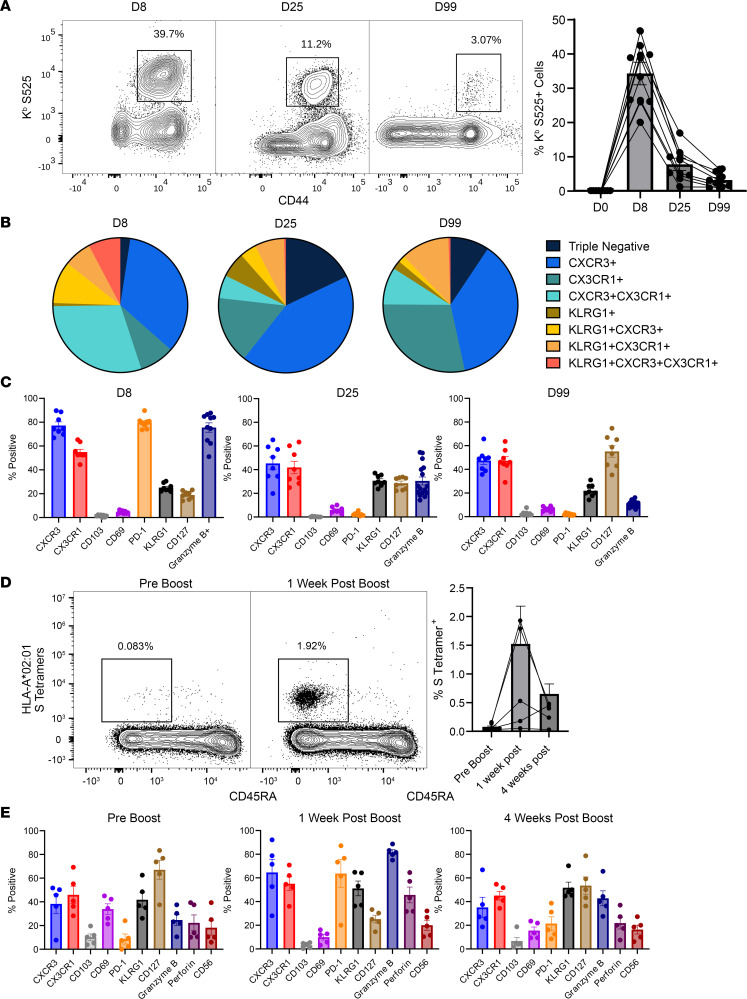
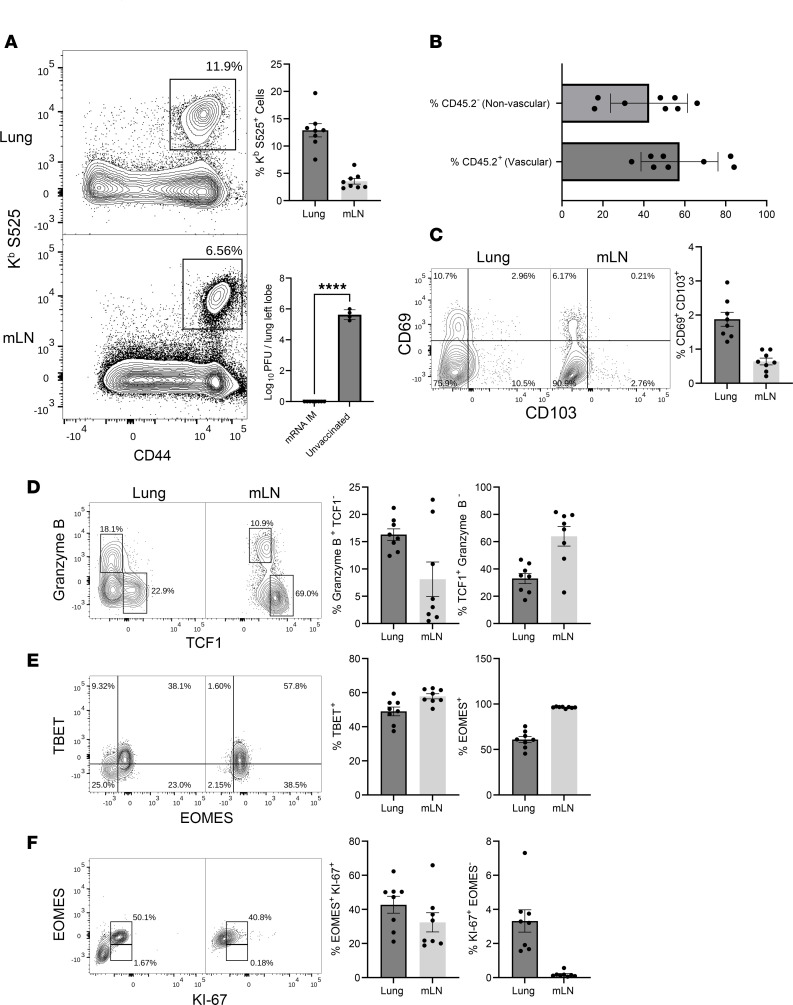
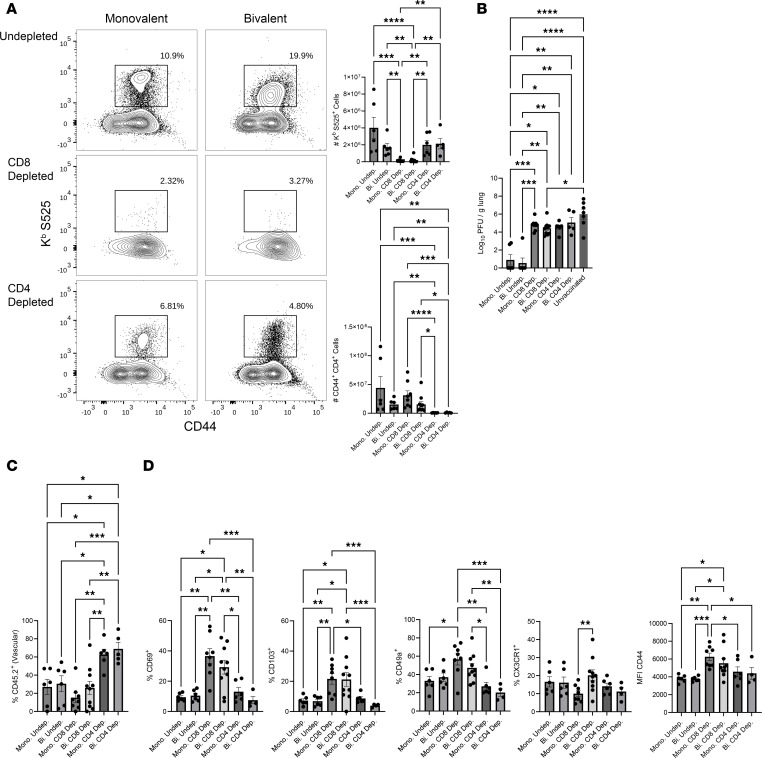
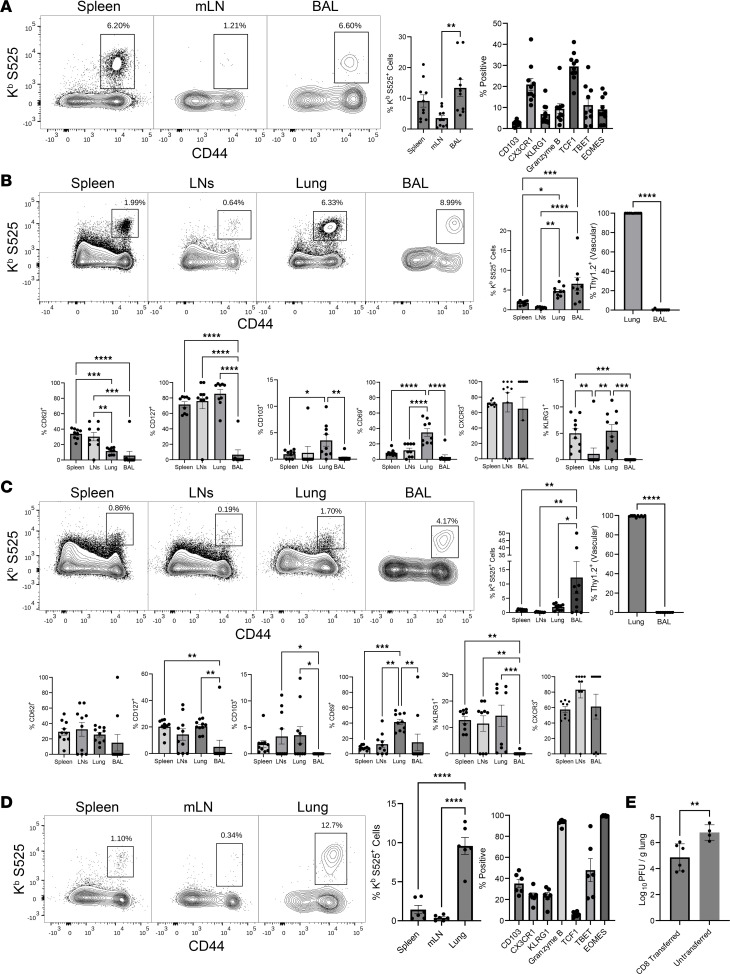
Although SARS-CoV-2 evolution seeds a continuous stream of antibody-evasive viral variants, COVID-19 mRNA vaccines provide robust protection against severe disease and hospitalization. Here, we asked whether mRNA vaccine-induced memory T cells limit lung SARS-CoV-2 replication and severe disease. We show that mice and humans receiving booster BioNTech mRNA vaccine developed potent CD8 T cell responses and showed similar kinetics of expansion and contraction of granzyme B/perforin-expressing effector CD8 T cells. Both monovalent and bivalent mRNA vaccines elicited strong expansion of a heterogeneous pool of terminal effectors and memory precursor effector CD8 T cells in spleen, inguinal and mediastinal lymph nodes, pulmonary vasculature, and most surprisingly in the airways, suggestive of systemic and regional surveillance. Furthermore, we document that: (a) CD8 T cell memory persists in multiple tissues for > 200 days; (b) following challenge with pathogenic SARS-CoV-2, circulating memory CD8 T cells rapidly extravasate to the lungs and promote expeditious viral clearance, by mechanisms that require CD4 T cell help; and (c) adoptively transferred splenic memory CD8 T cells traffic to the airways and promote lung SARS-CoV-2 clearance. These findings provide insights into the critical role of memory T cells in preventing severe lung disease following breakthrough infections with antibody-evasive SARS-CoV-2 variants.

Keywords: COVID-19; Cellular immune response; Immunology; Memory; T cells.


Figures

Figure 1
Figure 1. Peak CD8 T cell responses elicited by mRNA vaccination.
Mice (n = 6) were administered twice with the BioNTech mRNA vaccine and euthanized at day 5 (D5) or D8 after the booster vaccination. Single-cell suspensions of BAL, lungs, spleen, mediastinal or inguinal lymph nodes were stained with viability dye, followed by Kb/S525 (VNFNFNGL) tetramers in combination with antibodies to CD4, CD8, CD44, CD127, KLRG1. (A) Frequencies among CD8 T cells and numbers of S525-specific CD8 T cells in the indicated tissue are shown in FACS plots and graphs at D5 and D8 after booster vaccination. (B and D) FACS plots and graphs show percentages of indicated subsets among S525+ CD8+ T cells in various tissues. (C) To identify circulating/vascular cells in the lungs, mice were injected i.v. with fluorescent-labeled anti-CD45.2 antibodies, 3 minutes prior to euthanasia (CD45.2+, vascular; CD45.2, nonvascular). C shows percentages of vascular (CD45.2+) and nonvascular (CD45.2) cells among S525-specific CD8 T cells. Data represent 4 independent experiments. Planned comparisons were made using unpaired t test for 2-way comparisons (A and C) or Fisher’s LSD test (B and D). *, **, ***, and **** indicate significance at P < 0.05, < 0.005, < 0.0005, and < 0.00005, respectively. Data in each graph indicate mean ± SEM.
Figure 2
Figure 2. mRNA vaccine–elicited effector CD8 T cells are marked by high CXCR3 and granzyme B expression.
C57BL/6 mice (n = 6) were vaccinated twice with monovalent BioNTech mRNA vaccine and euthanized; cells isolated from various tissues were stained as described in Figure 1, with additional antibodies to granzyme B, TCF-1, CXCR3, CX3CR1, TBET, EOMES, and PD-1. (AC) FACS plots and graphs show percentages of indicated subsets among S525+ CD8+ T cells in various tissues at days 5 and 8 after boost. Planned comparisons were Fisher’s LSD test. *, **, ***, and **** indicate significance at P < 0.05, < 0.005, < 0.0005, and < 0.00005, respectively. Data in each graph indicate mean ± SEM.
Figure 3
Figure 3. mRNA vaccine–induced mucosal and systemic CD8 T cell memory.
C57BL/6 mice (n = 6) were vaccinated twice with monovalent BioNTech mRNA vaccine as described in Figure 1. At 96 days after booster vaccination, S525-specific memory CD8 T cells were characterized in airways (BAL), lungs, spleen, mediastinal (mLN), and inguinal (iLN) lymph nodes. Following euthanasia, organs were collected, and single-cell suspensions were stained with Kb/S525 tetramers and antibodies for the indicated cell surface/intracellular molecules or transcription factors. (A) FACS plots and graphs display percentages or numbers of S525-specific CD8 T cells in various tissues. (BF) FACS plots are gated on H-2Kb/S525 tetramer binding cells, and the numbers are the percentages of subsets among the gated population. Data represent 2 independent experiments. Planned comparisons were made using Fisher’s LSD tests. *, **, ***, and **** indicate significance at P < 0.05, < 0.005, < 0.0005, and < 0.00005. Data in each graph indicate mean ± SEM.
Figure 4
Figure 4. Longitudinal analysis of the kinetics and phenotypes of spike-specific CD8+ T cells in mouse and human PBMCs following administration of the mRNA vaccine.
C57BL/6 mice (n = 8) were vaccinated twice with monovalent BioNTech mRNA vaccine as described in Figure 1. Human volunteers (n = 5) previously vaccinated with a course of the monovalent mRNA spike vaccine were given a booster of the monovalent BioNTech mRNA vaccine 180 days later. At the indicated time points before and after vaccination, peripheral blood was collected from mice or humans, and mononuclear cells were stained with Kb/S525 tetramer (mice) or a cocktail of HLA-A*02:01 tetramers (specific to following epitopes in the S protein: 61-70, 222-230, 269-277, and 1000-1008) and antibodies to the indicated cell surface or intracellular molecules. (A and D) Graphs show longitudinal analysis of frequencies of H-2Kb/S525-specific (mice, A) or S-specific (humans, D) tetramer binding cells among CD8+ T cells in PBMCs of individual mouse or humans. (B, C, and E) Percentages of S-specific CD8 T cells expressing the indicated molecule(s) in PBMCs of mice (B and C) or humans (E). Data are from 2 independent experiments. Planned comparisons were made using Fisher’s LSD tests. *, **, ***, and **** indicate significance at P < 0.05, < 0.005, < 0.0005, and < 0.00005, respectively. Data in each graph indicate mean ± SEM.
Figure 5
Figure 5. mRNA vaccine–induced T cell–dependent protective immunity to a mouse-adapted strain of SARS-CoV-2.
Cohorts of 6- to 8-week-old mice (n = 8) were vaccinated twice with BioNTech mRNA vaccine, as described in Figure 1. At 100 days after booster vaccination, mice were challenged with the MA10/B.1.351 mouse–adapted strain of SARS-CoV-2 virus; unvaccinated mice were challenged as controls. (A) Viral titers and S525-specific CD8 T cells were quantified in the lungs on day 5 after challenge. (B) Percentages of vascular (CD45.2+) or nonvascular (CD45.2) cells among Kb/S525-specific CD8 T cells in lungs. (CF) FACS plots are gated on Kb/S525 tetramer binding CD8 T cells, and the numbers are the percentages of tetramer binding CD8 T cells within the gate or the quadrant. Two-way comparisons were made using an unpaired t test. ****P < 0.00005. Data in each graph indicate mean ± SEM.
Figure 6
Figure 6. CD8 and CD4 T cells are necessary for mRNA vaccine–induced protective immunity to SARS-CoV-2 in lungs.
Cohorts of 6- to 8-week-old B6 mice (n = 5–8) were vaccinated twice with the BioNTech monovalent (mono) or the bivalent (bi) mRNA vaccine, as described in Figure 1. At 160 days after booster vaccination, mice were treated i.n. and i.v. with anti-CD4 or anti-CD8 antibodies before and during challenge with the MA10/B.1.351 strain of SARS-CoV-2. On the day 5 after viral challenge, lung cells were stained with Kb/S525 tetramers and antibodies to CD8, CD4, and CD44. (A) FACS plots are gated on total CD8 T cells. Graphs show number of S525-specific CD8+ and activated (CD44+) CD4 T cells in lungs on day 5 after challenge. (B) Graph shows SARS-CoV-2 titers in lungs. (C) Graph shows percentages of Kb/S525-specific CD8 T cells that were found in the lung vasculature or (D) expressed CD69, CD103, CD49a, CD44, or CX3CR1 in lungs of virally challenged mice. Planned comparisons were made using Fisher’s LSD (A, C, and D) or Brown-Forsythe and Welch tests (B). *, **, ***, and **** indicate significance at P < 0.05, < 0.005, < 0.0005, and < 0.00005, respectively.
Figure 7
Figure 7. Vaccine-elicited splenic memory CD8 T cells localize to airways and lymphoid tissues and to protect against SARS-CoV-2 in lungs.
Cohorts of 6- to 8-week-old CD45.2+ C57BL/6 mice (n = 5–10) were vaccinated twice with BioNTech mRNA vaccine, as described in Figure 1. (A) At 100 days after booster vaccination, frequencies of Kb/S525-specific CD8 T cells were quantified in spleens, LNs, and BAL by flow cytometry; FACS plots are gated on total CD8 T cells. (B and C) CD8 T cells purified from spleens of vaccinated mice (from A) were adoptively transferred into congenic CD45.1 mice (n = 4-5). At 8 (B) and 30 (C) days after adoptive cell transfer, the frequencies and phenotype of donor CD45.2+ Kb/S525-specific CD8 T cells in spleen, lymph nodes, lung, and BAL were quantified by flow cytometry. FACS plots in B and C are gated on CD45.2+ CD8 T cells. (D and E) At 45 days after adoptive cell transfer, mice were challenged with the MA10/B.1.351 mouse adapted strain of SARS-CoV-2 virus; unvaccinated mice were challenged as controls. (D) On the fifth day after viral challenge, the Kb/S525-specific CD8 T cells in lungs were analyzed by flow cytometry. FACS plots are gated on donor CD45.2+ CD8 T cells. (E) Graph show viral titers in lungs of mice that received memory CD8 T cells (CD8 transferred) or mice that did not receive any cells (untransferred). Planned comparisons were made using Fisher’s LSD (A–D), or unpaired 2-tailed t tests for 2-way comparisons (B and C for Thy1.2+ Vascular graphs, and E). *, **, ***, and **** indicate significance at P < 0.05, < 0.005, < 0.0005, and < 0.00005, respectively. Data in each graph indicate mean ± SEM.

Similar articles

Cited by

References

    1. Tenforde MW, et al. Long-term protection associated with COVID-19 vaccination and prior infection. JAMA. 2022;328(14):1402–1404. doi: 10.1001/jama.2022.14660. - DOI - PMC - PubMed
    1. Lin D-Y, et al. Association of primary and booster vaccination and prior infection with SARS-CoV-2 infection and severe COVID-19 outcomes. JAMA. 2022;328(14):1415–1426. doi: 10.1001/jama.2022.17876. - DOI - PMC - PubMed
    1. Lin D-Y, et al. Effectiveness of covid-19 vaccines over a 9-month period in North Carolina. N Engl J Med. 2022;386(10):933–941. doi: 10.1056/NEJMoa2117128. - DOI - PMC - PubMed
    1. Lauring AS, et al. Clinical severity of, and effectiveness of mRNA vaccines against, covid-19 from omicron, delta, and alpha SARS-CoV-2 variants in the United States: prospective observational study. BMJ. 2022;376:e069761. doi: 10.1136/bmj-2021-069761. - DOI - PMC - PubMed
    1. Tarke A, et al. SARS-CoV-2 vaccination induces immunological T cell memory able to cross-recognize variants from Alpha to Omicron. Cell. 2022;185(5):847–859. doi: 10.1016/j.cell.2022.01.015. - DOI - PMC - PubMed

Publication types

Substances

Supplementary concepts