Individual-level home values and cancer mortality in a statewide registry
- PMID: 37796836
- PMCID: PMC10646779
- DOI: 10.1093/jncics/pkad076
Individual-level home values and cancer mortality in a statewide registry
Abstract
Background: Prior work assessing disparities in cancer outcomes has relied on regional socioeconomic metrics. These metrics average data across many individuals, resulting in a loss of granularity and confounding with other regional factors.
Methods: Using patients' addresses at the time of diagnosis from the Ohio Cancer Incidence Surveillance System, we retrieved individual home price estimates from an online real estate marketplace. This individual-level estimate was compared with the Area Deprivation Index (ADI) at the census block group level. Multivariable Cox proportional hazards models were used to determine the relationship between home price estimates and all-cause and cancer-specific mortality.
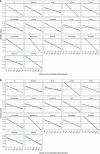
Results: A total of 667 277 patients in Ohio Cancer Incidence Surveillance System were linked to individual home prices across 16 cancers. Increasing home prices, adjusted for age, stage at diagnosis, and ADI, were associated with a decrease in the hazard of all-cause and cancer-specific mortality (hazard ratio [HR] = 0.92, 95% confidence interval [CI] = 0.92 to 0.93, and HR = 0.95, 95% CI = 0.94 to 0.95, respectively). Following a cancer diagnosis, individuals with home prices 2 standard deviations above the mean had an estimated 10-year survival probability (7.8%, 95% CI = 7.2% to 8.3%) higher than those with home prices 2 standard deviations below the mean. The association between home price and mortality was substantially more prominent for patients living in less deprived census block groups (Pinteraction < .001) than for those living in more deprived census block groups.
Conclusion: Higher individual home prices were associated with improved all-cause and cancer-specific mortality, even after accounting for regional measures of deprivation.
© The Author(s) 2023. Published by Oxford University Press.
Conflict of interest statement
The work presented here was not directly funded by an outside organization or sponsor. JES is supported by the Frederick J. and Theresa Dow Fund of the New York Community Trust, the Vinney Scholars Award, and a Damon Runyon Cancer Research Foundation Physician Scientist Training Award. JES had full access to all the data in the study and takes responsibility for the integrity of the data and the accuracy of the data analysis. All other authors have no potential conflicts of interest to disclose.
Figures


Comment in
-
Zillow MD: Do housing prices predict cancer survival?JNCI Cancer Spectr. 2023 Oct 31;7(6):pkad086. doi: 10.1093/jncics/pkad086. JNCI Cancer Spectr. 2023. PMID: 37965909 Free PMC article. No abstract available.
Similar articles
-
Mortality and Morbidity Effects of Long-Term Exposure to Low-Level PM2.5, BC, NO2, and O3: An Analysis of European Cohorts in the ELAPSE Project.Res Rep Health Eff Inst. 2021 Sep;2021(208):1-127. Res Rep Health Eff Inst. 2021. PMID: 36106702 Free PMC article.
-
Association of Race and Area Deprivation With Breast Cancer Survival Among Black and White Women in the State of Georgia.JAMA Netw Open. 2022 Oct 3;5(10):e2238183. doi: 10.1001/jamanetworkopen.2022.38183. JAMA Netw Open. 2022. PMID: 36306134 Free PMC article.
-
Effects of long-term exposure to traffic-related air pollution on respiratory and cardiovascular mortality in the Netherlands: the NLCS-AIR study.Res Rep Health Eff Inst. 2009 Mar;(139):5-71; discussion 73-89. Res Rep Health Eff Inst. 2009. PMID: 19554969
-
[SENTIERI - Epidemiological Study of Residents in National Priority Contaminated Sites. Sixth Report].Epidemiol Prev. 2023 Jan-Apr;47(1-2 Suppl 1):1-286. doi: 10.19191/EP23.1-2-S1.003. Epidemiol Prev. 2023. PMID: 36825373 Italian.
-
Treatment disparities for disabled medicare beneficiaries with stage I non-small cell lung cancer.Arch Phys Med Rehabil. 2008 Apr;89(4):595-601. doi: 10.1016/j.apmr.2007.09.042. Arch Phys Med Rehabil. 2008. PMID: 18373987 Review.
Cited by
-
Cancer care and the coconut tree: all in which it lives, and has come before.JNCI Cancer Spectr. 2024 Sep 2;8(5):pkae083. doi: 10.1093/jncics/pkae083. JNCI Cancer Spectr. 2024. PMID: 39428118 Free PMC article. No abstract available.
-
Zillow MD: Do housing prices predict cancer survival?JNCI Cancer Spectr. 2023 Oct 31;7(6):pkad086. doi: 10.1093/jncics/pkad086. JNCI Cancer Spectr. 2023. PMID: 37965909 Free PMC article. No abstract available.
References
-
- Bureau UC. Glossary. https://www.census.gov; https://www.census.gov/programs-surveys/geography/about/glossary.html. Accessed December 8, 2022.
-
- Ingleby FC, Belot A, Atherton I, Baker M, Elliss-Brookes L, Woods LM.. Assessment of the concordance between individual-level and area-level measures of socio-economic deprivation in a cancer patient cohort in England and Wales. BMJ Open. 2020;10(11):e041714. doi:10.1136/bmjopen-2020-041714 - DOI - PMC - PubMed
Publication types
MeSH terms
LinkOut - more resources
Full Text Sources
Medical
