

The interface between SARS-CoV-2 and non-communicable diseases (NCDs) in a high HIV/TB burden district level hospital setting, Cape Town, South Africa
- PMID: 37796879
- PMCID: PMC10553288
- DOI: 10.1371/journal.pone.0277995
The interface between SARS-CoV-2 and non-communicable diseases (NCDs) in a high HIV/TB burden district level hospital setting, Cape Town, South Africa
Erratum in
-
Correction: The interface between SARS-CoV-2 and non-communicable diseases (NCDs) in a high HIV/TB burden district level hospital setting, Cape Town, South Africa.PLoS One. 2025 Jun 6;20(6):e0324096. doi: 10.1371/journal.pone.0324096. eCollection 2025. PLoS One. 2025. PMID: 40478916 Free PMC article.
Abstract
Background: COVID-19 experiences on noncommunicable diseases (NCDs) from district-level hospital settings during waves I and II are scarcely documented. The aim of this study is to investigate the NCDs associated with COVID-19 severity and mortality in a district-level hospital with a high HIV/TB burden.
Methods: This was a retrospective observational study that compared COVID-19 waves I and II at Khayelitsha District Hospital in Cape Town, South Africa. COVID-19 adult patients with a confirmed SARS-CoV-2 polymerase chain reaction (PCR) or positive antigen test were included. In order to compare the inter wave period, clinical and laboratory parameters on hospital admission of noncommunicable diseases, the Student t-test or Mann-Whitney U for continuous data and the X2 test or Fishers' Exact test for categorical data were used. The role of the NCD subpopulation on COVID-19 mortality was determined using latent class analysis (LCA).
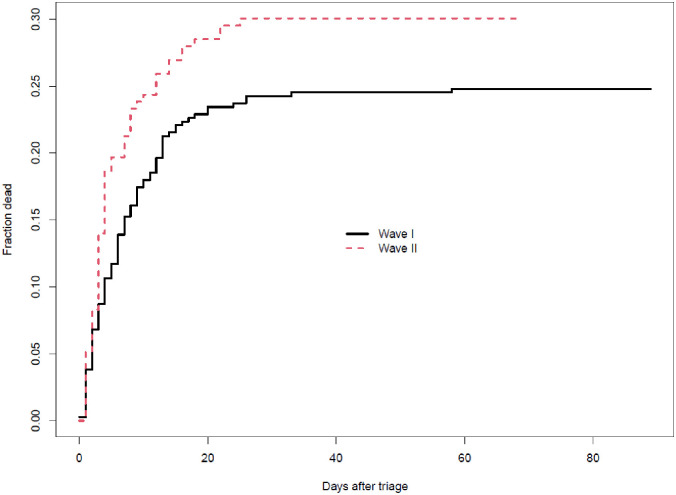
Findings: Among 560 patients admitted with COVID-19, patients admitted during wave II were significantly older than those admitted during wave I. The most prevalent comorbidity patterns were hypertension (87%), diabetes mellitus (65%), HIV/AIDS (30%), obesity (19%), Chronic Kidney Disease (CKD) (13%), Congestive Cardiac Failure (CCF) (8.8%), Chronic Obstructive Pulmonary Disease (COPD) (3%), cerebrovascular accidents (CVA)/stroke (3%), with similar prevalence in both waves except HIV status [(23% vs 34% waves II and I, respectively), p = 0.022], obesity [(52% vs 2.5%, waves II and I, respectively), p <0.001], previous stroke [(1% vs 4.1%, waves II and I, respectively), p = 0.046]. In terms of clinical and laboratory findings, our study found that wave I patients had higher haemoglobin and HIV viral loads. Wave II, on the other hand, had statistically significant higher chest radiography abnormalities, fraction of inspired oxygen (FiO2), and uraemia. The adjusted odds ratio for death vs discharge between waves I and II was similar (0.94, 95%CI: 0.84-1.05). Wave I had a longer average survival time (8.0 vs 6.1 days) and a shorter average length of stay among patients discharged alive (9.2 vs 10.7 days). LCA revealed that the cardiovascular phenotype had the highest mortality, followed by diabetes and CKD phenotypes. Only Diabetes and hypertension phenotypes had the lowest mortality.
Conclusion: Even though clinical and laboratory characteristics differed significantly between the two waves, mortality remained constant. According to LCA, the cardiovascular, diabetes, and CKD phenotypes had the highest death probability.
Copyright: © 2023 Mnguni et al. This is an open access article distributed under the terms of the Creative Commons Attribution License, which permits unrestricted use, distribution, and reproduction in any medium, provided the original author and source are credited.
Conflict of interest statement
The authors received no specific funding for this work.
Figures


References
-
- JHU. Coronavirus resources centre/Global Map, 2022. https://coronavirus.jhu.edu/map.html (Accessed 29 October 2022)
-
- Statistics South Africa. South African Demographic and Health Survey 2016: Key Indicator, 2016. https://dhsprogram.com/pubs/pdf/SR248/SR248.pdf (Accessed 29 October 2022)
-
- Statistics South Africa. Mid-year population estimates 2021, https://www.statssa.gov.za/publications/P0302/P03022021.pdf (Accessed 29 October 2022)
-
- Moyo S, Ismail F, Van der Walt M, Ismail N, Mkhondo N, Dlamini S, et al. Prevalence of bacteriologically confirmed pulmonary tuberculosis in South Africa, 2017–19: a multistage, cluster-based, cross-sectional survey. Lancet Infect Dis. 2022;22(8):1172–1180. doi: 10.1016/S1473-3099(22)00149-9 - DOI - PMC - PubMed
Publication types
MeSH terms
LinkOut - more resources
Full Text Sources
Medical
Research Materials
Miscellaneous
