. 2023 Oct 5;18(10):e0290708.
doi: 10.1371/journal.pone.0290708. eCollection 2023.

Communicating COVID-19 exposure risk with an interactive website counteracts risk misestimation

Affiliations

Communicating COVID-19 exposure risk with an interactive website counteracts risk misestimation

Alyssa H Sinclair et al. PLoS One. .

Abstract

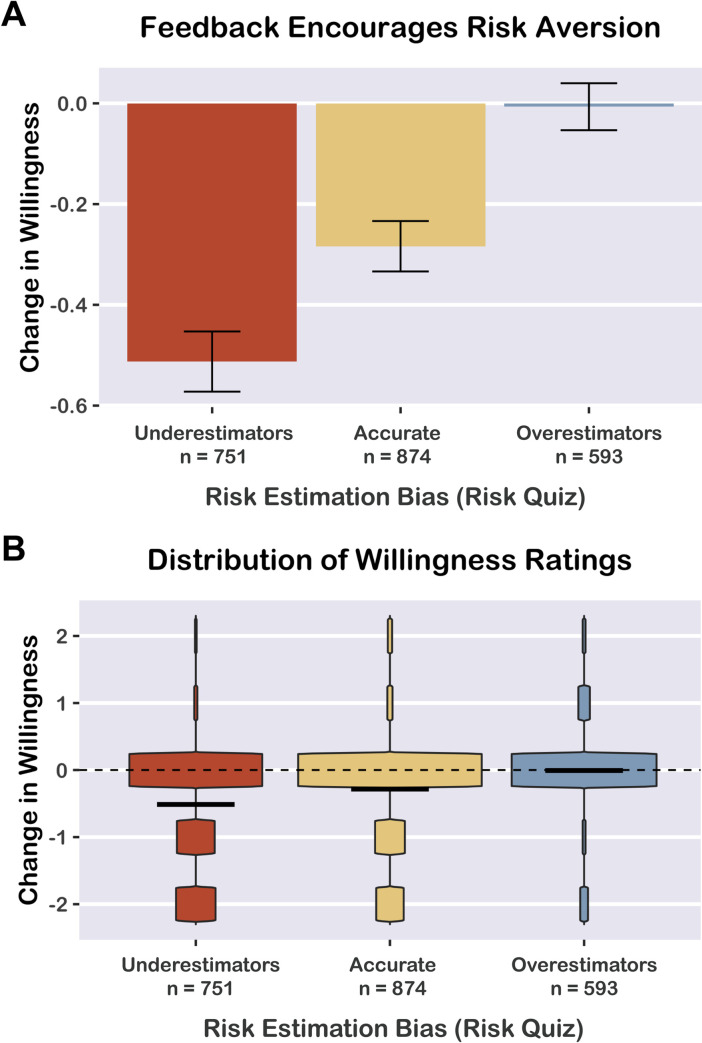
During the COVID-19 pandemic, individuals depended on risk information to make decisions about everyday behaviors and public policy. Here, we assessed whether an interactive website influenced individuals' risk tolerance to support public health goals. We collected data from 11,169 unique users who engaged with the online COVID-19 Event Risk Tool (https://covid19risk.biosci.gatech.edu/) between 9/22/21 and 1/22/22. The website featured interactive elements, including a dynamic risk map, survey questions, and a risk quiz with accuracy feedback. After learning about the risk of COVID-19 exposure, participants reported being less willing to participate in events that could spread COVID-19, especially for high-risk large events. We also uncovered a bias in risk estimation: Participants tended to overestimate the risk of small events but underestimate the risk of large events. Importantly, even participants who voluntarily sought information about COVID risks tended to misestimate exposure risk, demonstrating the need for intervention. Participants from liberal-leaning counties were more likely to use the website tools and more responsive to feedback about risk misestimation, indicating that political partisanship influences how individuals seek and engage with COVID-19 information. Lastly, we explored temporal dynamics and found that user engagement and risk estimation fluctuated over the course of the Omicron variant outbreak. Overall, we report an effective large-scale method for communicating viral exposure risk; our findings are relevant to broader research on risk communication, epidemiological modeling, and risky decision-making.


Conflict of interest statement

The authors have declared that no competing interests exist.

Figures

Fig 1
Fig 1. Overview of website features.
A) The homepage of the website displays a map of the USA with individual counties color-coded by exposure risk level. The map depicted is for January 25, 2022 with an ascertainment bias of 4 and a 50-person event size. Below the map is a willingness rating. B) Adjacent to the map is a “risk context” panel that contextualizes the selected event size with two example scenarios. Illustrations adapted from freepik.com under a CC BY license, with permission from FreePik, original copyright 2023. C) On a separate page of the website, the risk quiz enabled users to test their knowledge of current risk levels in their own local communities. D) After submitting risk quiz responses, users viewed a feedback box and willingness rating.
Fig 2
Fig 2. Reduced willingness to participate in large events.
Participants reported being significantly less willing to participate in events of a given size after viewing the corresponding risk map. The decrease in willingness was greater for larger event sizes, with the exception of the largest event size (5,000 people), likely because participants were already unwilling to participate in very large events. Change in willingness was rated on a 5-point Likert-style scale. A) Mean change in willingness by event size. Error bars indicate 95% confidence intervals. B) Violin plots depicting data distributions. Horizontal bars indicate means. Numbers above the dotted line indicate the number of observations per event size.
Fig 3
Fig 3. Risk misestimation by event size.
Average risk estimation error (participant’s guess–prevalence-based risk estimate) differed across event sizes. Participants tended to overestimate the risk of small events (20 people) but underestimate the risk of large events (100 and 1,000 people). Plots depict results from 4,841 participants who completed the risk quiz. A) Mean risk estimation error by event size. Error bars depict 95% confidence intervals. B) Violin plots depicting data distribution. Horizontal bars indicate means.
Fig 4
Fig 4. Feedback encourages risk aversion.
For visualization purposes, we classified participants as Overestimators, Accurate Estimators, or Underestimators based on their average risk estimation error score. Overestimators reported no significant change in willingness to participate in events after viewing feedback about their risk estimation accuracy. Accurate Estimators showed a moderate decrease in willingness, and Underestimators showed the largest decrease in willingness. A) Mean change in willingness by risk estimation type. Error bars depict 95% confidence intervals. B) Violin plots depicting data distribution. Horizontal bars indicate means. Dotted line indicates zero, no change in willingness.
Fig 5
Fig 5
A) More risk quizzes were submitted for liberal counties (defined as greater vote share for the Democratic party than the Republican party in the 2020 presidential election) than for conservative counties (greater vote share for the Republican party), suggesting a political divide in user engagement. B) Predicted values from a linear mixed effects regression model predicting post-quiz change in willingness from risk estimation error (averaged across event sizes for each user) and county-level political leaning (% vote for the Republican party, a continuous variable). Blue and red lines depict -1 SD and +1 SD levels of the political leaning variable respectively, dichotomized for visualization only. The intervention was less effective for participants from more conservative counties (i.e., attenuated effect of risk quiz feedback on change in willingness). Shaded bands indicate 95% confidence intervals.
Fig 6
Fig 6. Temporal analysis of risk quiz data.
A) Average risk estimation error (guess–actual) for each event size assessed in the risk quiz, plotted over the course of the 4-month data collection period. Participants consistently underestimated risk for the largest event size (1,000 people), whereas risk misestimation fluctuated over time for the other event sizes. Dotted line at y = 0 indicates accurate risk estimation. B) Prevalence-based exposure risk paralleled risk estimation accuracy over time, demonstrating that risk perception is related to prevalence. Participants tended to overestimate risk when prevalence was low, but underestimate risk when prevalence was high. C) Risk estimation error scores (as seen in Panel A) normalized by exposure risk (as seen in Panel B) for each county and timepoint. Dotted line at y = 0 indicates that risk misestimation is as-expected given the prevalence-based exposure risk. Participants overestimated risk for small-to-medium event sizes during November and December of 2021. D) Change in willingness to take risks (after the risk quiz) plotted over time. Dotted line at y = 0 indicates no change in willingness. Participants reported the greatest decreases in willingness during the Omicron wave, from December through January. Gray bands indicate 95% confidence intervals.

References

    1. World Health Organization. Coronavirus. In: Coronavirus Disease (COVID-19) [Internet]. [cited 22 Aug 2022]. Available: https://www.who.int/health-topics/coronavirus
    1. World Health Organization. Monkeypox. In: WHO Fact Sheet on Monkeypox [Internet]. [cited 22 Aug 2022]. Available: https://www.who.int/news-room/fact-sheets/detail/monkeypox
    1. World Health Organization. Influenza (seasonal). In: lnfluenza (seasonal) [Internet]. [cited 22 Aug 2022]. Available: https://www.who.int/health-topics/influenza-seasonal
    1. Czeisler MÉ. Perception of Local COVID-19 Transmission and Use of Preventive Behaviors Among Adults with Recent SARS-CoV-2 Infection—Illinois and Michigan, June 1–July 31, 2022. MMWR Morb Mortal Wkly Rep. 2022;71. doi: 10.15585/mmwr.mm7146a2 - DOI - PMC - PubMed
    1. Sinclair AH, Hakimi S, Stanley ML, Adcock RA, Samanez-Larkin GR. Pairing facts with imagined consequences improves pandemic-related risk perception. PNAS. 2021;118: e2100970118. doi: 10.1073/pnas.2100970118 - DOI - PMC - PubMed

Publication types

Supplementary concepts