. 2023 Oct 23;63(20):6212-6223.
doi: 10.1021/acs.jcim.3c01509. Epub 2023 Oct 5.

Swarm Smart Meta-Estimator for 2D/2D Heterostructure Design

Affiliations

Swarm Smart Meta-Estimator for 2D/2D Heterostructure Design

Romain Botella et al. J Chem Inf Model. .

Abstract

Two-dimensional (2D) semiconductors are central to many scientific fields. The combination of two semiconductors (heterostructure) is a good way to lift many technological deadlocks. Although ab initio calculations are useful to study physical properties of these composites, their application is limited to few heterostructure samples. Herein, we use machine learning to predict key characteristics of 2D materials to select relevant candidates for heterostructure building. First, a label space is created with engineered labels relating to atomic charge and ion spatial distribution. Then, a meta-estimator is designed to predict label values of heterostructure samples having a defined band alignment (descriptor). To this end, independently trained k-nearest neighbors (KNN) regression models are combined to boost the regression. Then, swarm intelligence principles are used, along with the boosted estimator's results, to further refine the regression. This new "swarm smart" algorithm is a powerful and versatile tool to select, among experimentally existing, computationally studied, and not yet discovered van der Waals heterostructures, the most likely candidate materials to face the scientific challenges ahead.


Conflict of interest statement

The authors declare no competing financial interest.

Figures

Figure 1
Figure 1
Diagram depicting how the data were extracted from first-principles calculations, separated in labels, and then combined to make the heterostructure space.
Figure 2
Figure 2
(a) CM as a function of CBM difference (CBMDiff), (b) DM as a function of CBMDiff, (c) CM as a function of VBM difference (VBMDiff), and (d) DM as a function of VBMDiff. For each graph, the Pearson correlation coefficient is given.
Figure 3
Figure 3
(a) Diagram illustrating the particle formation by KNN regressor boosting from descriptors (band alignment) to labels (CM and DM), (b) label space and particle, representation of CL (the size of the particle is indicative), (c) swarm formation, representation of SL by secondary particle formation. For (b), the vertical orange lines correspond to the ranges of CM values predicted, and the horizontal purple lines correspond to the range of DM values predicted. M1, M2, M3, and M4 are highlighting maximum target density regions, changing with increasing swarm size.
Figure 4
Figure 4
(a) SL (blue) and total CL (orange) scores for a random target value (CBMDiff = 2.8673 ± 0.05 eV and VBMDiff = 1.0441 ± 0.05 eV), (b) SL and total CL scores for the same target value for one iteration of the algorithm with the pristine data set, (c) for a data set with CBMDiff values permuted 50 times, and (d) for a dataset with VBMDiff values permuted 50 times The swarm size (Np) is increasing from left to right [2 (left), 4 (middle), 8 (right)].
Figure 5
Figure 5
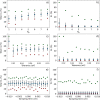
Maximum (green circles), minimum (red circles), average (blue squares) values of (a) SL and (b) total CL scores for a random target value as a function of the swarm size (c,d): maximum (green circles), minimum (red circles), average (blue squares) values of SL (left) and total CL (right) scores for a random target value (CBMDiff = 2.8673 eV, VBMDiff = 1.0441 eV) as a function of the tolerance factor. (e,f): maximum (green circles), minimum (red circles), average (blue squares) values of SL (left) and total CL (right) scores for a random target value as a function of the sampling term. The error bars are computed from 50 iterations of the algorithm.

References

    1. Roduner E. Size matters: why nanomaterials are different. Chem. Soc. Rev. 2006, 35, 583–592. 10.1039/b502142c. - DOI - PubMed
    1. Kunkel Ch.; Margraf J. T.; Chen K.; Oberhofer H.; Reuter K. Active discovery of organic semiconductors. Nat. Commun. 2021, 12, 2422.10.1038/s41467-021-22611-4. - DOI - PMC - PubMed
    1. Cudazzo P.; Tokatly I. V.; Rubio A. Dielectric screening in two-dimensional insulators: Implications for excitonic and impurity states in graphane. Phys. Rev. B: Condens. Matter Mater. Phys. 2011, 84, 085406.10.1103/PhysRevB.84.085406. - DOI
    1. Hüser F.; Olsen T.; Thygesen K. S. How dielectric screening in two-dimensional crystals affects the convergence of excited-state calculations: Monolayer MoS2. Phys. Rev. B: Condens. Matter Mater. Phys. 2013, 88, 245309.10.1103/PhysRevB.88.245309. - DOI
    1. Jung E.; Park J. Ch.; Seo Y.-S.; Kim J.-H.; Hwang J.; Lee Y. H. Unusually large exciton binding energy in multilayered 2H-MoTe2. Sci. Rep. 2022, 12, 4543.10.1038/s41598-022-08692-1. - DOI - PMC - PubMed

Publication types