. 2023 Oct 6;382(6666):eadg2253.
doi: 10.1126/science.adg2253. Epub 2023 Oct 6.

PIM1 controls GBP1 activity to limit self-damage and to guard against pathogen infection

Affiliations

PIM1 controls GBP1 activity to limit self-damage and to guard against pathogen infection

Daniel Fisch et al. Science. .

Abstract

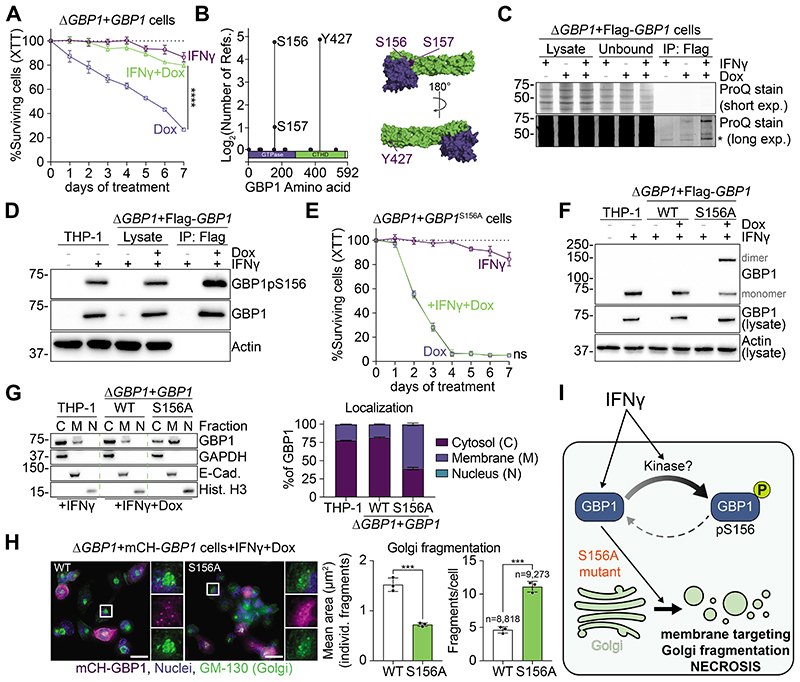
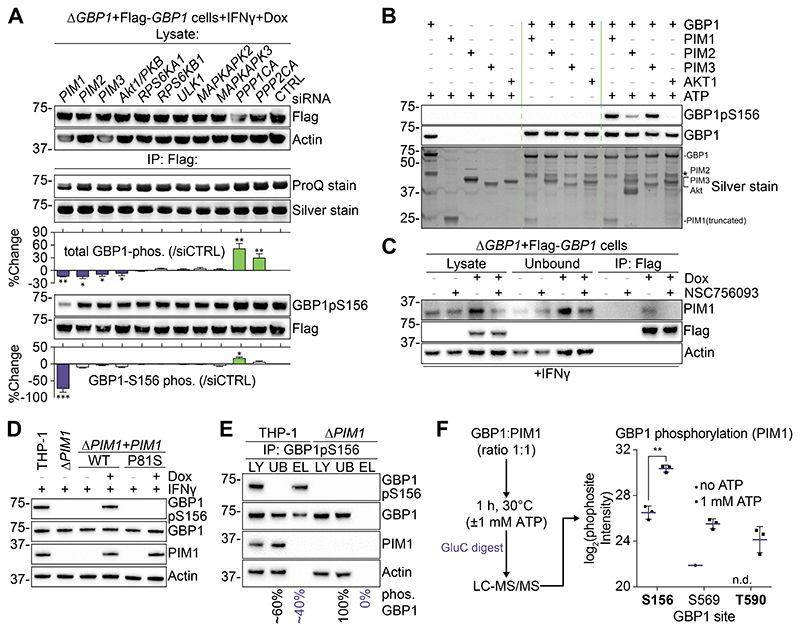
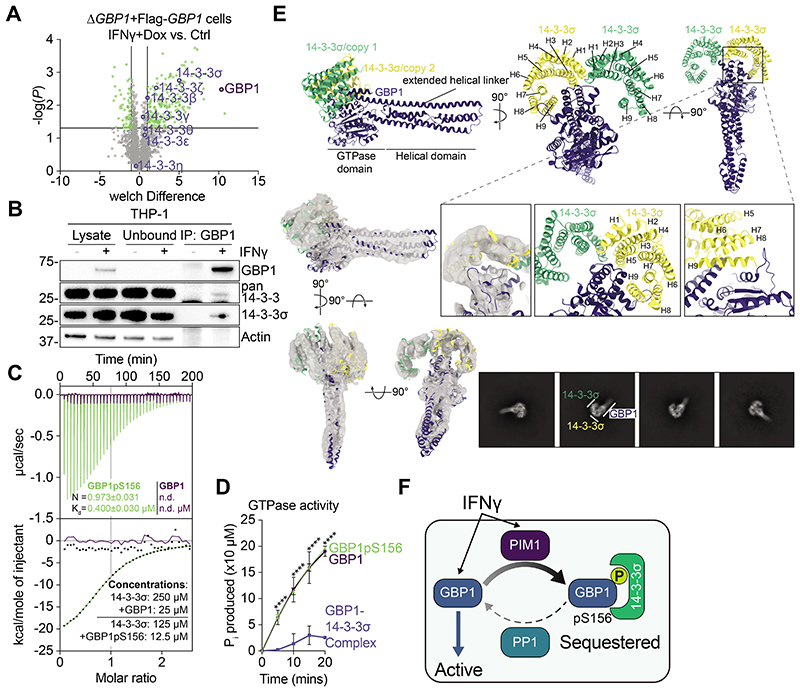
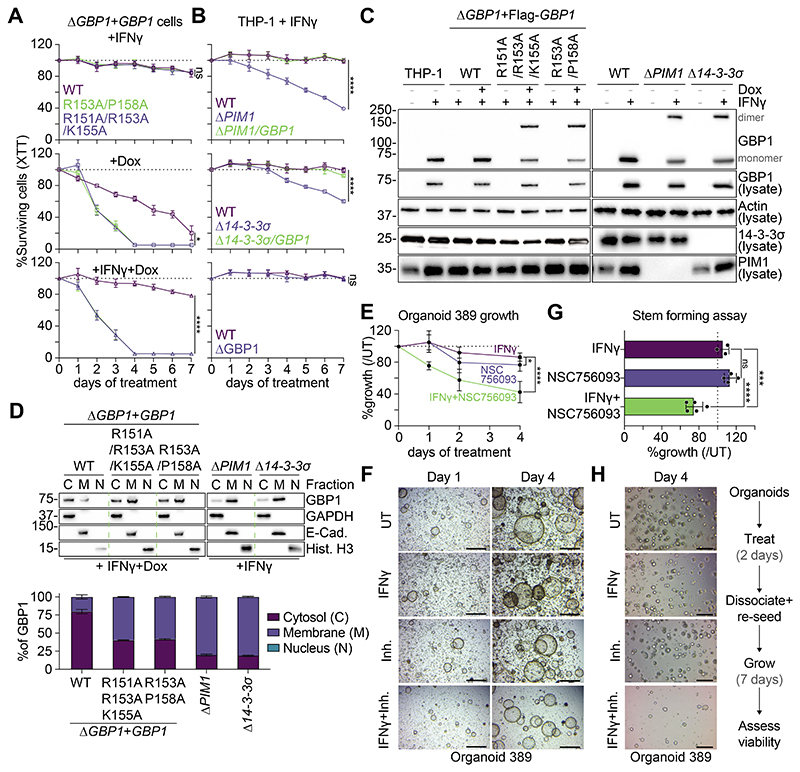
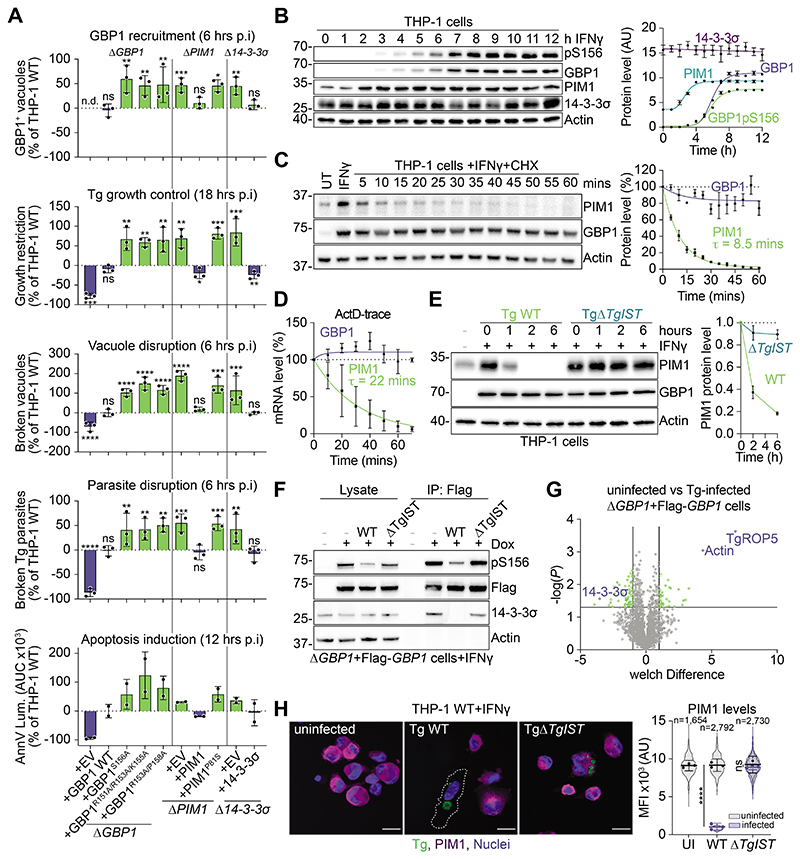
Disruption of cellular activities by pathogen virulence factors can trigger innate immune responses. Interferon-γ (IFN-γ)-inducible antimicrobial factors, such as the guanylate binding proteins (GBPs), promote cell-intrinsic defense by attacking intracellular pathogens and by inducing programmed cell death. Working in human macrophages, we discovered that GBP1 expression in the absence of IFN-γ killed the cells and induced Golgi fragmentation. IFN-γ exposure improved macrophage survival through the activity of the kinase PIM1. PIM1 phosphorylated GBP1, leading to its sequestration by 14-3-3σ, which thereby prevented GBP1 membrane association. During Toxoplasma gondii infection, the virulence protein TgIST interfered with IFN-γ signaling and depleted PIM1, thereby increasing GBP1 activity. Although infected cells can restrain pathogens in a GBP1-dependent manner, this mechanism can protect uninfected bystander cells. Thus, PIM1 can provide a bait for pathogen virulence factors, guarding the integrity of IFN-γ signaling.


Conflict of interest statement

Competing Interests:

The authors declare no competing interests.

Figures

Fig. 1
Fig. 1. IFNγ and phosphorylation control GBP1 cytotoxicity and activity.
(A) XTT cell survival assay of THP-1ΔGBP1+GBP1 WT cells treated with IFNγ±Dox for indicated number of days. (B) Graph and GBP1 structure showing predicted phosphorylation sites and their surface-localization based on data from proteomics references (Ref). (C) Images with short or long exposure (exp.) for a ProQ-Diamond phosphoprotein stain for immunoprecipitated Flag-GBP1 from THP-1ΔGBP1+Flag-GBP1 cells treated with IFNγ±Dox. *Marks background bands. (D) Immunoblots using GBP1pS156 antibody showing phosphorylation of GBP1 in IFNγ+Dox-treated THP-1ΔGBP1+Flag-GBP1. (E) XTT cell survival assay of THP-1ΔGBP1+GBP1S156A cells treated with IFNγ±Dox for indicated number of days. (F) Immunoblot-analysis of GBP1 oligomerization in crosslinked pellets and in cell lysates. (G) Immunoblots of subcellular fractionation to determine GBP1 localization in IFNγ-primed THP-1 WT or ΔGBP1+GBP1 cells expressing GBP1S156A or WT GBP1 with markers for the cytosol (C), membranes (M) or the nucleus (N) and quantification. (H) Immunofluorescence images of cells expressing mCH-GBP1 WT or S156A for 48 hours and stained for Golgi marker GM130 and quantification of mean area and number of Golgi fragments. Number of quantified cells indicated in figure. Green: GM-130 (Golgi); Magenta: mCH-GBP1; Blue: Nuclei; Scale bar 20 μm. (I) Cartoon summarizing findings on GBP1 activity control. Data information: Images in (C-D) and (F-H) representative of n = 3 experiments. Graphs in (A), (E) and (G+H) show mean ± SEM from n = 3 experiments. *** P0.001; **** P < 0.0001 for indicated comparisons in (A+E) from one-way ANOVA and in (H) from unpaired t-tests; ns, not significant. For gel source data, see Data S5.
Fig. 2
Fig. 2. The kinase PIM1 phosphorylates GBP1 at Ser156.
(A) Immunoblots and silver/ProQ-Diamond phosphoprotein stain of immunoprecipitated Flag-GBP1 WT from IFNγ+Dox-treated THP-1ΔGBP1+Flag-GBP1 cells transfected with siRNA for the indicated genes. Quantification shows change in total GBP1 phosphorylation (top) and change in GBP1 Ser156 phosphorylation (bottom) normalized to siRNA CTRL transfected cells. (B) Immunoblot and silver stain of in vitro kinase assays with PIM family kinases ±10 μM ATP. *Marks unspecific protein bands. (C) Immunoblots following crosslinking and immunoprecipitation of Flag-GBP1 from THP-1ΔGBP1+Flag-GBP1 cells treated with IFNγ±Dox and GBP1:PIM1 interaction inhibitor NSC756093. (D) Immunoblots testing for phosphorylation of endogenous GBP1 in IFNγ-primed THP-1 WT or ΔPIM1 macrophages reconstituted with PIM1 WT or kinase dead (P81S) and additionally treated with Dox. (E) Immunoblots of GBP1-immunoprecipitation from IFNγ-primed THP-1 WT or ΔPIM1 cells using GBP1pS156 antibody. Volumes of unbound (UB) and elution (EL) fraction were equalized to determine the proportion of phosphorylated GBP1 (indicated below). LY: lysate. (F) Mass spectrometry analysis of the PIM1:GBP1 kinase assay. Plot depicts log2 phosphosite intensity of identified Ser156, Ser569, Thr590 sites of GBP1, which were localized with probabilities > 0.99. Data information: Images in (A-E) representative of n = 3 experiments. Graphs in (A) show mean ± SD from n = 3 experiments, and in (F) mean ± SD from n = 3 replicates. * P0.05; ** P0.01; *** P0.001; **** P0.0001 in (A) from one-way ANOVA comparing to siRNA CTRL transfected cells and in (F) from unpaired two sample t-test following adjustment for multiple comparisons. For gel source data, see Data S5.
Fig. 3
Fig. 3. Phosphorylated GBP1 is bound and inactivated by 14-3-3σ.
(A) Volcano plot of mass spectrometry data analysis of GBP1-interacting proteins obtained following co-immunoprecipitation of Flag-GBP1 from IFNγ (CTRL) or IFNγ+ Dox-treated THP-1ΔGBP1+Flag-GBP1 cells. GBP1-interacting proteins above the significance threshold highlighted in green and 14-3-3 proteins in blue. (B) Immunoblots of co-immunoprecipitation of endogenous GBP1 from THP-1 WT cells treated with IFNγ. (C) Isothermal titration calorimetry determining thermodynamics of GBP1:14-3-3σ complex formation. 14-3-3σ at indicated concentrations was injected in 7 μL aliquots to non-phosphorylated or in vitro phosphorylated GBP1 at indicated concentrations. Determined molar ratio N at equilibrium and dissociation constant Kd as shown in the figure. (D) GTPase activity assay of 2 μM free GBP1, in vitro phosphorylated GBP1 or GBP1:14-3-3σ complex. (E) Top: Overview of the trimeric GBP1:14-3-3σ complex consisting of two 14-3-3 copies (yellow + green) bound to the GBP1 GTPase domain. Middle: insets depict details of GBP1:14-3-3 dimer binding interface. Cryo-EM density is shown in grey with rigid-body docked GBP1 (PDB: 1F5N) and 14-3-3σ (PDB: 1YWT) crystal structures. Bottom: Representative 2D classes with highlighted complex components. (F) Cartoon depicting the observed inhibitory mechanism, in which PIM1 phosphorylates human GBP1 at Ser156 which is subsequently bound by 14-3-3σ. Upon dephosphorylation, GBP1 is liberated and becomes active. Data information: Images in (B) representative of n = 3 experiments. Graph in (A+D) show mean ± SD from n = 3 experiments. Curves in (C) representative of n = 3 experiments and fitted to a model with one set of binding sites. **** P < 0.0001 for indicated comparisons in (D) from 2-way ANOVA following adjustment for multiple comparisons. For gel source data, see Data S5.
Fig. 4
Fig. 4. PIM1 phosphorylation of GBP1 protects cells from self-inflicted damage.
(A) XTT cell survival assay of THP-1ΔGBP1+GBP1 WT, +GBP1R151A/R153A/K155A (kinase motif mutant) or +GBP1R153A/P158A (14-3-3 binding motif mutant) cells treated with IFNγ±Dox for indicated number of days. (B) XTT cell survival assay kinetics of THP-1ΔGBP1, ΔPIM1, Δ14-3-3σ, ΔPIM1/GBP1 or Δ14-3-3σ/GBP1 cells treated with IFNγ for indicated number of days. (C) Immunoblot-analysis of GBP1 in crosslinked pellets and in cell lysates of indicated cells treated with IFNγ±Dox or left untreated. (D) Immunoblots of subcellular fractionation to determine GBP1 localization in indicated cells with respective markers for the cytosol (C), membranes (M) or the nucleus (N) and quantification of localization. (E) MTT survival assay of patient-derived colorectal tumour organoids treated with IFNγ and NSC756093 for 4 days, shown as percent growth compared to non-treated controls. (F) Images of organoids following indicated treatments with IFNγ and inhibitor NSC756093 (Inh.). Scale bar 1 mm. (G) Stem forming assay of organoids treated for 2 days as indicated, dissociated, and re-grown for 7 days in the absence of treatment. MTT assay on day 7 following re-seeding indicating relative re-growth. (H) Representative images from day 4 of re-growth of stem forming assay. Scale bar 200 μm. Data information: Images in (C-D) and (F-H) representative of n = 3 experiments. Graphs in (A-B), (D-E) and (G) show mean ± SEM n = 3 experiments, normalized to untreated cells. * P ≤0.05; *** P ≤ 0.001; **** P ≤ 0.0001 in (A-B), (E) and (G) comparing to WT or untreated (UT) cells and for indicated comparisons in (E) from one-way ANOVA and in. For gel source data, see Data S5.
Fig. 5
Fig. 5. Toxoplasma infection depletes PIM1 and activates GBP1.
(A) Quantification of GBP1 recruitment to Toxoplasma gondii (Tg) vacuoles, Tg growth restriction, vacuole/parasite disruption and apoptosis assay (area under the curve, AUC) in IFNγ+Dox-treated cells expressing the indicated mutant of GBP1, ΔPIM1 or Δ14-3-3σ cells reconstituted with the indicated protein or empty vector (EV). Values plotted relative to IFNγ-primed WT cells. (B) Immunoblots of IFNγ-treated THP-1 WT cells and protein level quantification. (C) Immunoblots of THP-1 WT cells treated with 50 μg/mL cycloheximide (CHX) and quantification of protein half-life. (D) RT-qPCR determination of mRNA stabilities in THP-1 WT cells treated with Actinomycin D (ActD). (E) Immunoblots and quantification of PIM1 protein level in THP-1 WT cells treated with IFNγ and infected with Tg WT or ΔTgIST. (F) Immunoblots of Flag-GBP1 co-immunoprecipitation from IFNγ/Dox-treated THP-1ΔGBP1+Flag-GBP1 cells infected with Tg WT or ΔTgIST for 6 hours. (G) Mass spectrometry analysis of GBP1-interacting proteins in uninfected (UI) or Tg WT-infected and IFNγ+Dox-treated THP-1ΔGBP1+Flag-GBP1 cells. (H) Immunofluorescence images of IFNγ-primed and uninfected (UI) or Tg WT or ΔTgIST-infected THP-1 WT after 12 hours. White: cell outline; Magenta: PIM1; Green: Tg; Blue: Nuclei. Scale bar: 20 μm. Graph shows quantification of PIM1 MFI depending on infection status: Grey, uninfected cells; Blue, infected cells. Data information: Images in (B, C, F, E, H) representative of n = 3 experiments. Graphs in (A) show mean ± SD of n = 3 experiments. Graphs in (B+C) show mean ± SD from n = 3 and in (D+E) from n = 4 experiments. Graphs in (G) shows data from n = 3 replicates. * P0.05; ** P0.01; *** P0.001; **** P0.0001 in (A) from 2-way ANOVA comparing to THP-1 WT cells and in (H) from nested t-test comparing infected to uninfected cells following adjustment for multiple comparisons; ns, not significant. For gel source data, see Data S5.

References

    1. MacMicking JD. Interferon-inducible effector mechanisms in cell-autonomous immunity. Nat Rev Immunol. 2012;12:367–382. - PMC - PubMed
    1. Van Der Biezen EA, Jones JDG. Plant disease-resistance proteins and the gene-for-gene concept. Trends Biochem Sci. 1998;23:454–456. - PubMed
    1. Lopes Fischer N, Naseer N, Shin S, Brodsky IE. Effector-triggered immunity and pathogen sensing in metazoans. Nat Microbiol. 2020;5:14–26. - PMC - PubMed
    1. Tretina K, Park E, Maminska A, Macmicking JD. Interferon-induced guanylate-binding proteins : Guardians of host defense in health and disease. J Exp Med. 2019:1–19. - PMC - PubMed
    1. Kim B-H, Shenoy AR, Kumar P, Das R, Tiwari S, Mac Micking JD. A Family of IFN-γ-Inducible 65-kD GTPases Protects Against Bacterial Infection. Science. 2011;332:717–721. - PubMed

MeSH terms