. 2024 Jan;31(1):e16089.
doi: 10.1111/ene.16089. Epub 2023 Oct 5.

Plasma neurofilament light chain predicts Alzheimer's disease in patients with subjective cognitive decline and mild cognitive impairment: A cross-sectional and longitudinal study

Affiliations

Plasma neurofilament light chain predicts Alzheimer's disease in patients with subjective cognitive decline and mild cognitive impairment: A cross-sectional and longitudinal study

Salvatore Mazzeo et al. Eur J Neurol. 2024 Jan.

Abstract

Background and purpose: We aimed to evaluate the accuracy of plasma neurofilament light chain (NfL) in predicting Alzheimer's disease (AD) and the progression of cognitive decline in patients with subjective cognitive decline (SCD) and mild cognitive impairment (MCI).

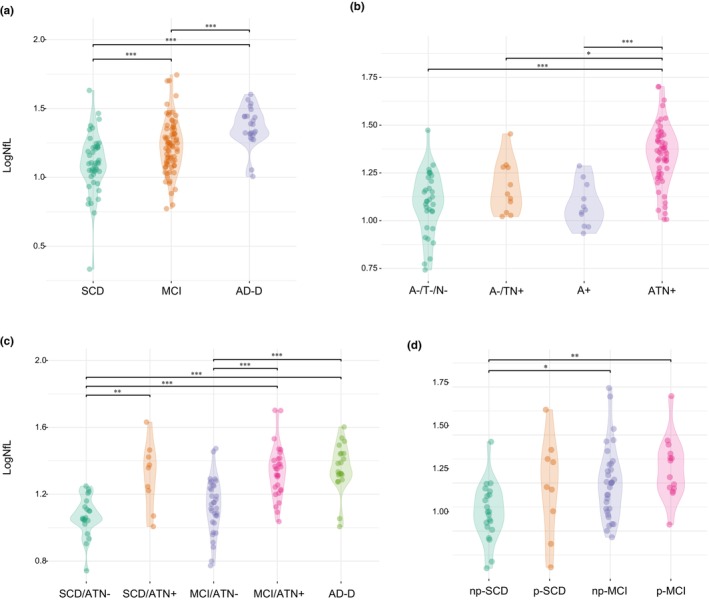
Methods: This longitudinal cohort study involved 140 patients (45 with SCD, 73 with MCI, and 22 with AD dementia [AD-D]) who underwent plasma NfL and AD biomarker assessments (cerebrospinal fluid, amyloid positron emission tomography [PET], and 18 F-fluorodeoxyglucose-PET) at baseline. The patients were rated according to the amyloid/tau/neurodegeneration (A/T/N) system and followed up for a mean time of 2.72 ± 0.95 years to detect progression from SCD to MCI and from MCI to AD. Forty-eight patients (19 SCD, 29 MCI) also underwent plasma NfL measurements 2 years after baseline.

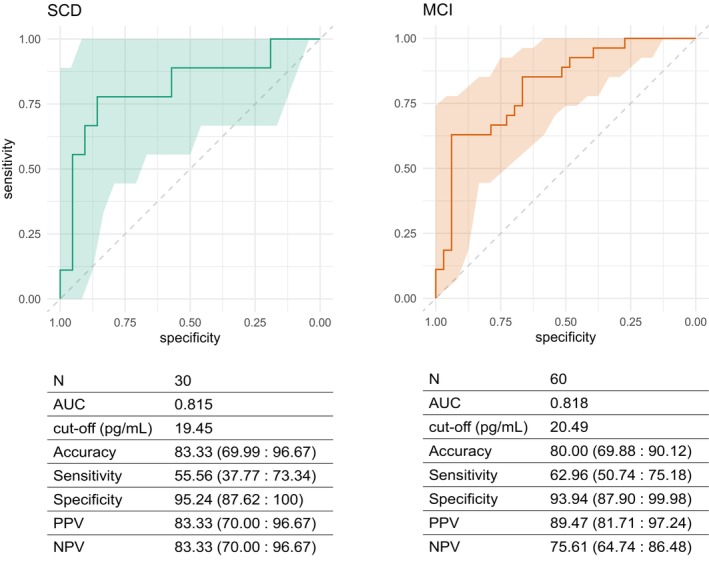
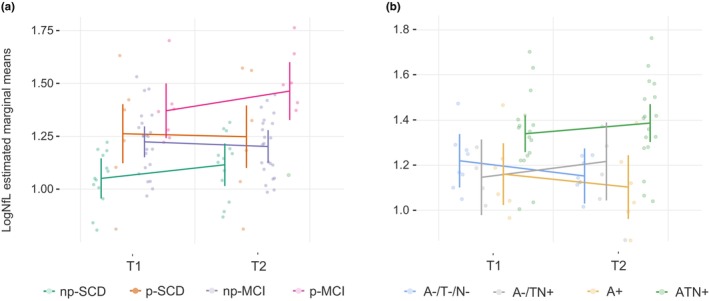
Results: At baseline, plasma NfL detected patients with biomarker profiles consistent with AD (A+/T+/N+ or A+/T+/N-) with high accuracy (area under the curve [AUC] 0.82). We identified cut-off values of 19.45 pg/mL for SCD and 20.45 pg/mL for MCI. During follow-up, nine SCD patients progressed to MCI (progressive SCD [p-SCD]), and 14 MCI patients developed AD dementia (progressive MCI [p-MCI]). The previously identified cut-off values provided good accuracy in identifying p-SCD (80% [95% confidence interval 65.69: 94.31]). The rate of NfL change was higher in p-MCI (3.52 ± 4.06 pg/mL) compared to non-progressive SCD (0.81 ± 1.25 pg/mL) and non-progressive MCI (-0.13 ± 3.24 pg/mL) patients. A rate of change lower than 1.64 pg/mL per year accurately excluded progression from MCI to AD (AUC 0.954).

Conclusion: Plasma NfL concentration and change over time may be a reliable, non-invasive tool to detect AD and the progression of cognitive decline at the earliest stages of the disease.

Keywords: Alzheimer's disease; biomarker; dementia; mild cognitive impairment; neurofilament.


Conflict of interest statement

All the authors declared that they have no conflicts of interest relevant to this work.

Figures

FIGURE 1
FIGURE 1
Log neurofilament light chain (logNfL) levels across groups. Values quoted in the y‐axis indicate LogNfL levels. Horizontal bars indicate significant differences between groups. (a) Comparisons between diagnosis groups: subjective cognitive decline (SCD) versus mild cognitive impairment (MCI; p = 0.002, Cohen's d = 0.671); SCD versus Alzheimer's disease (AD; p < 0.001, Cohen's d = 1.394); MCI versus AD (p = 0.010, Cohen's d = 0.723). (b) Comparisons between amyloid/tau/neurodegeneration (A/T/N) groups: A−/T−/N− versus A−/TN+ (p = 0.765, Cohen's d = 0.537); A−/T−/N− versus A+/T−/N− (p = 1.00, Cohen's d = 1.249); A−/T−/N− versus A+ (p < 0.001, Cohen's d = 1.562); A−/T−/N− versus ATN+ (p < 0.001, Cohen's d = 1.562); A−/TN+ versus A+ (p = 1.00, Cohen's d = 0.394); A−/TN+ versus ATN+ (p < 0.001, Cohen's d = 1.419); A+ versus ATN+ (p < 0.01, Cohen's d = 1.419). (c) Comparisons diagnosis/ATN groups: SCD/ATN− versus SCD/ATN+ (p = 0.003, Cohen's d = 1.571, MCI/ATN+ (p < 0.001, Cohen's d = 1.747); SCD/ATN− versus AD (p < 0.001, Cohen's d = 1.880); MCI/ATN− versus MCI/ATN+ (p < 0.001, Cohen's d = 1.343); MCI/ATN− versus AD (p < 0.001, Cohen's d = 1.476); SCD/ATN− versus MCI/ATN− (p = 1.00, Cohen's d = 0,447); SCD/ATN+ versus MCI/ATN+ (p = 1.00, Cohen's d = 0.176); MCI/ATN+ versus AD (p = 1.00, Cohen's d = 0.133). (d) Comparisons between progression groups: non‐progressive SCD (np‐SCD) versus progressive SCD (p‐SCD) (p = 0.428, Cohen's d = 0.729); np‐SCD versus non‐progressive MCI (np‐MCI) (p = 0.020, Cohen's d = 0.846); np‐SCD versus progressive MCI (p‐MCI) groups (p = 0.003, Cohen's d = 1.250); p‐SCD versus np‐MCI (p = 1.00, Cohen's d = 0.117), p‐SCD versus p‐MCI (p = 1.00, Cohen's d = 0.521); np‐MCI versus p‐MCI (p = 1.00, Cohen's d = 0.404).
FIGURE 2
FIGURE 2
Neurofilament light chain (NfL) accuracy in predicting amyloid/tau/neurodegeneration (A/T/N) status. Receiver‐operating characteristic curves for accuracy of NfL in distinguishing ATN− and ATN+ groups in SCD and MCI. Colored shapes indicate 95% confidence interval (CI). Cut‐off values estimated by Youden's method. Accuracy, sensitivity, specificity, positive predictive value (PPV) and negative predictive value (NPV) are expressed as percentages (95% CI). AUC, area under the curve.
FIGURE 3
FIGURE 3
Kaplan–Meier survival analysis for comparison of distributions of progression from SCD to MCI and from MCI to AD between neurofilament light chain (NfL)− and NfL+ groups. For patients who progressed, follow‐up time indicates the time of progression. Number at risk and p values for pairwise log‐rank comparisons between groups are reported. Colored shapes indicate 95% confidence interval.
FIGURE 4
FIGURE 4
Change in log neurofilament light chain (logNfL) distribution by progression and ATN groups. T1 and T2 indicate the first and second blood collection for plasma NfL measurement. (a) Effect of cognitive decline progression on logNfL change: F [3,44] = 5.2, p = 0.032, η 2 = 0.014. Post hoc analysis: non‐progressive SCD (np‐SCD) versus progressive SCD (p‐SCD) (mean difference = −0.18, p = 0.214); np‐SCD versus non‐progressive MCI (np‐MCI) (mean difference = −0.13, p = 0.223); np‐SCD versus progressive MCI (p‐MCI) (mean difference = −0.34, p < 0.001); p‐SCD versus np‐MCI (mean difference = 0.05, p = 1.00); p‐SCD versus p‐MCI (mean difference = −0.16, p = 1.00); np‐MCI versus p‐MCI (mean difference = −0.21, p = 0.033). (b) Effect of amyloid/tau/neurodegeneration (A/T/N) on NfL change: F [1,31] = 2.80, p = 0.056, η 2 = 0.213). Post hoc analysis: A−/T−/N− versus A−/TN+ (mean difference = 0.00, p = 1.00); A−/T−/N− versus A+ (mean difference = 0.05, p = 1.00); A−/T−/N− versus ATN+ (mean difference = −0.18, p = 0.077); A−/TN+ versus A+ (mean difference = 0.05, p = 1.00); A−/TN+ versus ATN+ (mean difference = −0.18, p = 0.269); A+ versus ATN+ (mean difference = −0.23, p = 0.024).

References

    1. Jessen F, Amariglio RE, van Boxtel M, et al. A conceptual framework for research on subjective cognitive decline in preclinical Alzheimer's disease. Alzheimers Dement. 2014;10:844‐852. - PMC - PubMed
    1. Albert MS, DeKosky ST, Dickson D, et al. The diagnosis of mild cognitive impairment due to Alzheimer's disease: recommendations from the National Institute on Aging‐Alzheimer's Association workgroups on diagnostic guidelines for Alzheimer's disease. Alzheimers Dement. 2011;7:270‐279. - PMC - PubMed
    1. Jack CR, Bennett DA, Blennow K, et al. NIA‐AA research framework: toward a biological definition of Alzheimer's disease. Alzheimers Dement. 2018;14:535‐562. - PMC - PubMed
    1. Cummings J, Zhou Y, Lee G, Zhong K, Fonseca J, Cheng F. Alzheimer's disease drug development pipeline: 2023. Alzheimer's Dement. 2023;9:e12385. - PMC - PubMed
    1. Margolis SA, Kelly DA, Daiello LA, et al. Anticholinergic/sedative drug burden and subjective cognitive decline in older adults at risk of Alzheimer's disease. J Gerontol A Biol Sci Med Sci. 2021;76:1037‐1043. - PubMed

Publication types

MeSH terms