. 2024 Mar;13(6):e2302907.
doi: 10.1002/adhm.202302907. Epub 2023 Oct 20.

Utilization of an Artery-on-a-Chip to Unravel Novel Regulators and Therapeutic Targets in Vascular Diseases

Affiliations

Utilization of an Artery-on-a-Chip to Unravel Novel Regulators and Therapeutic Targets in Vascular Diseases

Valentina Paloschi et al. Adv Healthc Mater. 2024 Mar.

Abstract

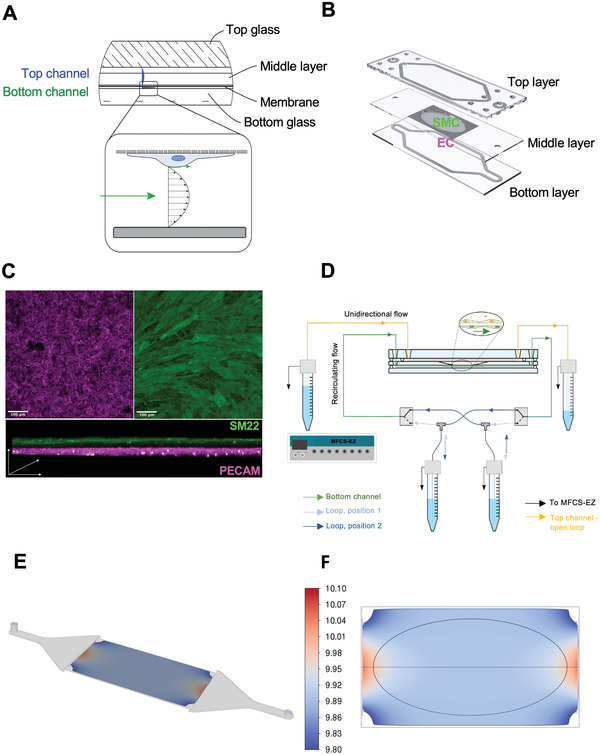
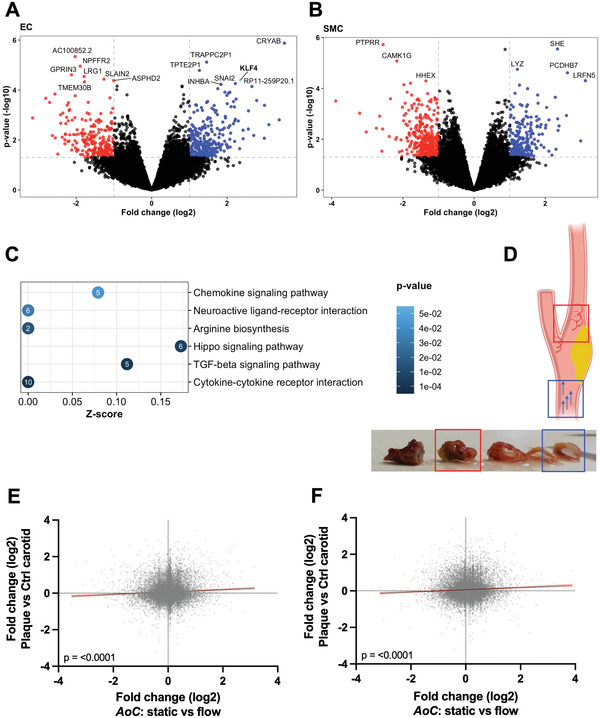
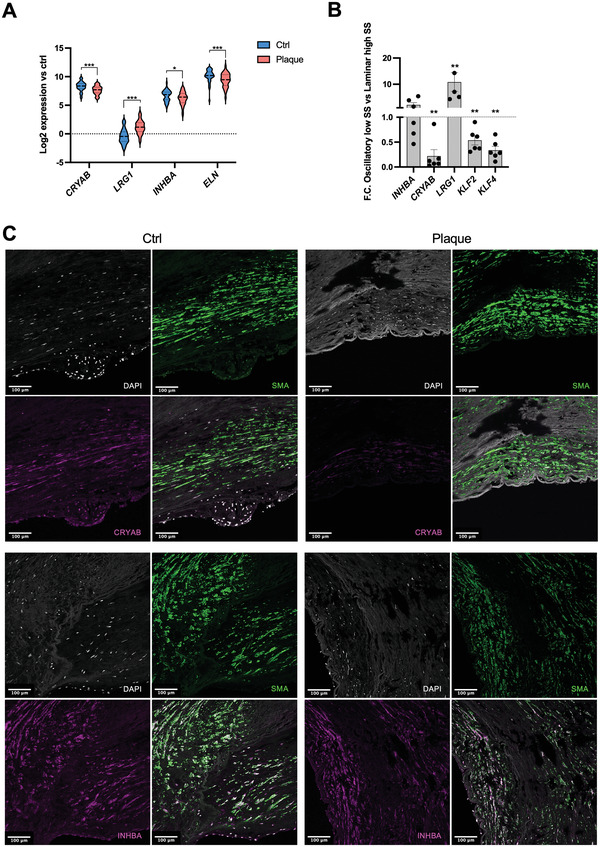
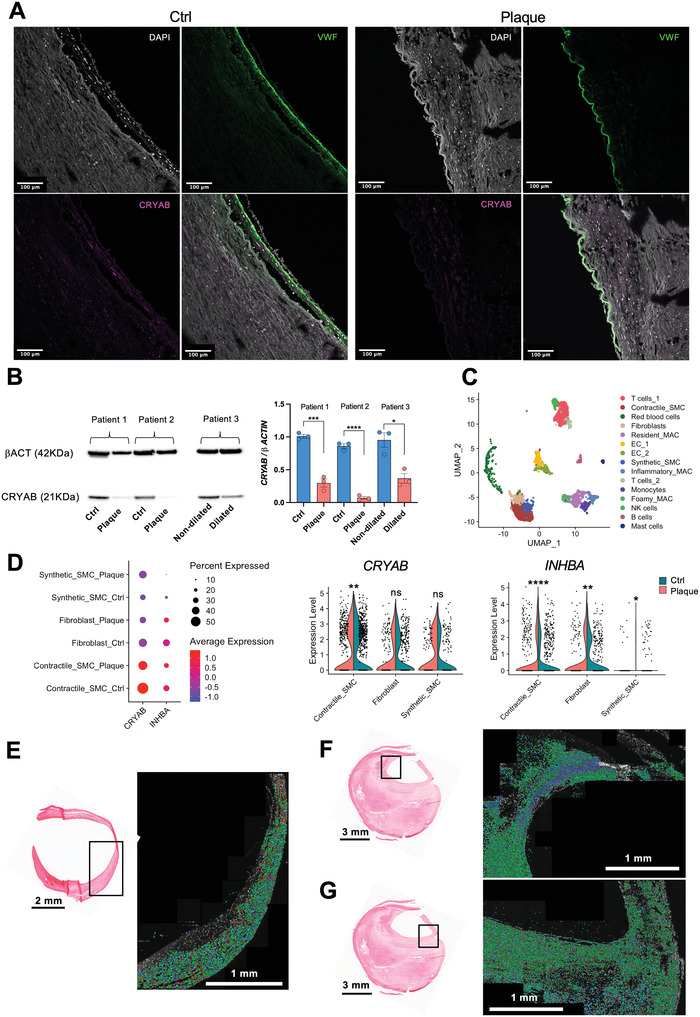
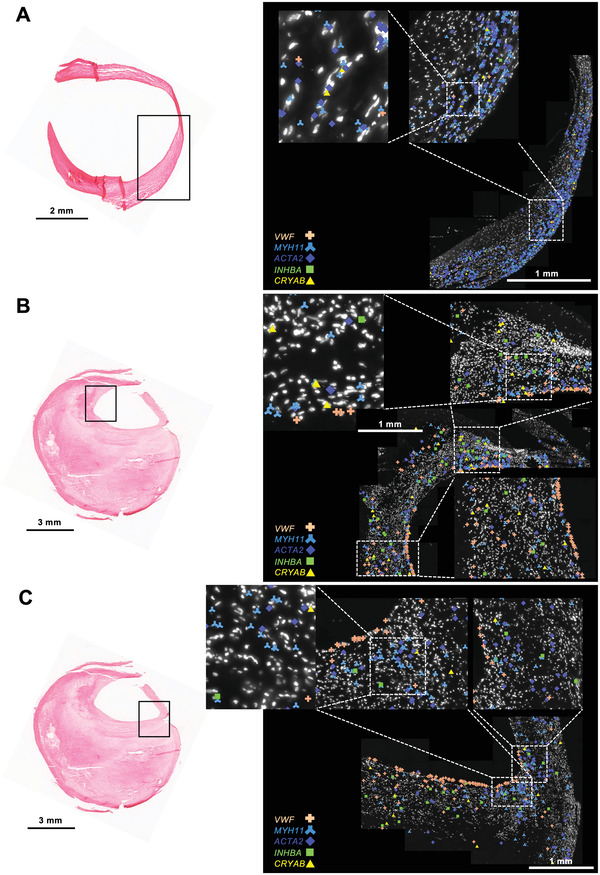
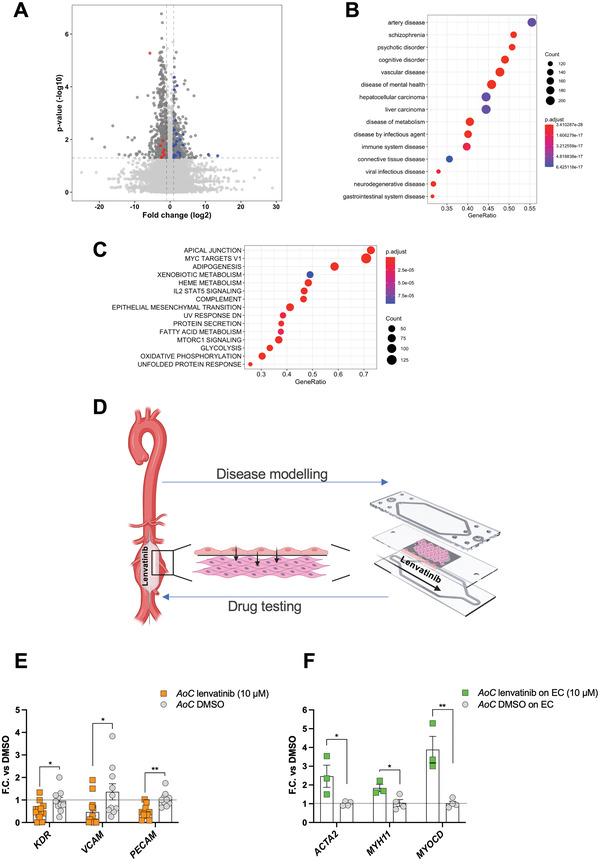
In this study, organ-on-chip technology is used to develop an in vitro model of medium-to-large size arteries, the artery-on-a-chip (AoC), with the objective to recapitulate the structure of the arterial wall and the relevant hemodynamic forces affecting luminal cells. AoCs exposed either to in vivo-like shear stress values or kept in static conditions are assessed to generate a panel of novel genes modulated by shear stress. Considering the crucial role played by shear stress alterations in carotid arteries affected by atherosclerosis (CAD) and abdominal aortic aneurysms (AAA) disease development/progression, a patient cohort of hemodynamically relevant specimens is utilized, consisting of diseased and non-diseased (internal control) vessel regions from the same patient. Genes activated by shear stress follow the same expression pattern in non-diseased segments of human vessels. Single cell RNA sequencing (scRNA-seq) enables to discriminate the unique cell subpopulations between non-diseased and diseased vessel portions, revealing an enrichment of flow activated genes in structural cells originating from non-diseased specimens. Furthermore, the AoC served as a platform for drug-testing. It reproduced the effects of a therapeutic agent (lenvatinib) previously used in preclinical AAA studies, therefore extending the understanding of its therapeutic effect through a multicellular structure.

Keywords: aortic aneurysms; arteries-on-a-chip; atherosclerosis; endothelial cells; smooth muscle cells; vascular diseases.


Conflict of interest statement

We declare the following competing interest: Lars Maegdefessel is a scientific consultant and adviser for Novo Nordisk (Malov, Denmark), DrugFarm (Shanghai, China), and Angiolutions (Hannover, Germany), and received research funds from Roche Diagnostics (Rotkreuz, Switzerland).

Figures

Figure 1
Figure 1
The AoC model. A) Cross‐sectional design depicting the layers of the AoC and the different flow profiles in the top (blue) and bottom (green) channel, respectively. B) The membrane for co‐culturing EC and SMC at opposite sides is inserted between the top and bottom layer. C) Immunofluorescence staining of the membrane shows EC and SMC, labelled by the respective cell markers (PECAM for EC and SM22 for SMC). D) Connection of the AoC to the microfluidic pump. Arrows indicate the flow direction or the connection to the pressure controller (MFCS‐EZ). E,F) Computational fluid dynamic analysis (CFD) of the AoC. E) 3D view of the bottom channel (EC side) showing the location of the membrane within the AoC. The membrane region is color coded by wall shear stress (WSS). F) Detailed 2D view showing WSS distribution (ranging from 9.80 to 10.1 dyne/cm2) along the membrane. The WSS threshold excludes the boundary layers located in the immediate proximity of lateral walls. EC is cultured within the ellipse.
Figure 2
Figure 2
Flow‐mediated transcriptomic changes identified in the AoC. Volcano plots depicting EC (A) and SMC (B), down‐ (red) and up‐ (blue) regulated mRNAs in AoCs exposed to shear versus null stress, as resulted by RNAseq experiments. Differentially expressed genes (DEGs) were identified using a statistical threshold of P < 0.01 with fold change ≥ 2. At this statistical cut‐off, 224 and 233 DEGs were identified in the EC and SMC contrasts respectively. The top DEGs with p‐value adjusted by False Discovery Rates (FDR) corrections < 0.1 are highlighted. C) Gene‐set overrepresentation analysis of KEGG pathway enrichment with enrichment Z‐score on the X axis and ‐log10(p‐value) on the Y axis. Point size represents pathway size and point color represents Z‐score calculated as Z = (Su – Sd)/√N, where Su and Sd are the number of significant up‐ and down‐regulated genes in the pathway respectively, and N is the total number of genes in the pathway. D) Pictures of human carotid vessels with their respective schematic representations are shown. The biopsies were isolated from the most diseased location (plaque) in the vessels (indicated by red squares) and from the adjacent non‐diseased area (internal control indicated by blue squares). Blue arrows show the predicted laminar flow in non‐diseased areas, rotating red arrows represents the predicted turbulent flow at the diseased areas. E,F) Correlation analysis between differential gene expression in AoC static versus flow and human carotid plaques versus healthy control. Scatterplot of gene expression fold change in AoC static versus flow conditions (x‐axis) and Plaque versus healthy Ctrl human carotids. All sequenced genes from the AoC experiment are shown. Black line: linear regression fit; red dashed lines: 95% confidence interval for slope. Pearson correlation p value = <0.0001 for both EC (E) and SMC (F) AoC experiments when compared with human carotid arteries.
Figure 3
Figure 3
AoC‐generated targets are identified in human vascular tissues. A) Non‐diseased (Ctrl) and diseased (Plaque) carotid vessels (n = 37), as depicted in Figure 2D, were subjected to RNA‐seq. ELN, CRAYB, INHBA and LRG1 expression levels are shown. Statistics: DEGs were determined by paired T‐test using a statistical threshold corrected for multiple testing using the false discovery rate (FDR). (*) FDR‐adjusted p‐value < 0.05; (***) FDR‐adjusted p‐value < 0.001. B) RNA was extracted from EC exposed for 24 h to laminar high stress (12 dyne/cm2) and oscillatory low shear stress (2 dyne/cm2) and followed by qPCR analysis of novel flow response genes (CRYAB, INHBA, LRG1, KLF2 and KLF4). Paired T‐test (n = 6) was performed. (**) p < 0.01. C) Double immunofluorescent staining of CRYAB (or INHBA) with SMA and nuclear DAPI in non‐disease and diseased human carotid sections. Imaging was carried out with confocal microscopy.
Figure 4
Figure 4
Decreased flow‐induced target CRYAB in diseased carotid vessels and aortas. A) Immunofluorescence on non‐disease and diseased carotid sections showing loss of CRYAB (purple) with a decrease degree of co‐localization with EC marker, VWF (green) signal in diseased specimens. Imaging was carried out with confocal microscopy. B) Protein lysates extracted from non‐diseased/diseased (plaque) carotid tissues (n = 2) and non‐dilated/dilated aorta (n = 1) submitted to western blot (WB) analysis for the detection of CRYAB. Protein levels are expressed as a ratio to beta actin (bACT). Quantification of WB was done with Fiji Image J software. Statistics: unpaired T‐test (*) p‐value < 0.05. C) Uniform Manifold Approximation and Projection (UMAP) plot showing the major cells clusters identified from scRNA‐seq performed on human carotid plaques (n = 9 patients. Ctrl and Plaque tissues are obtained from each patient). D) Dot plot and violin plot showing the higher expression and significant enrichment of CRYAB and INHBA in contractile SMC and fibroblast cell clusters originated by Ctrl as compared to Plaque specimens. The FindMarkers function was used to compare the DEGs between the Ctrl and Plaque, by using the “bimod test (Likelihood‐ratio test)”. (****) p<0.0001, (***) p<0.0002, (**) p<0.0021, (*) p< 0.0332. E,F,G) Ctrl (non‐diseased carotid vessel) and carotid plaque were subjected to spatial transcriptomics via HybRISS methodology. All detected transcripts are shown: 16.583 transcripts in Ctrl (E), 78.245 and 75.920 in two different plaque regions respectively (F, G). The specific areas processed for spatial transcriptomic are indicated in the histochemistry images on the left side.
Figure 5
Figure 5
Targeted spatial transcriptomics of flow‐induced targets. A) Ctrl (non‐diseased carotid vessel) and B,C) carotid Plaque were subjected to HybRISS methodology. VWF, ACTA and MYH11 were chosen as prototypical markers of EC (VWF) and SMC (ACTA, MYH11) in the arterial wall. VWF, ACTA2, MYH11, INHBA, and CRYAB transcripts were detected in the tissue section and are presented in different colors. The respective processed areas are marked. In the Plaque section two different regions of the fibrous cap were analyzed.
Figure 6
Figure 6
Vascular SMC express flow‐induced genes at single‐cell level in mice model of CAD and AAA. A) Inducible plaque rupture mouse model: carotid vessels were isolated from control side (left) or subjected to ligation (right). B) t‐distributed stochastic neighbor embedding (t‐SNE) plot showing the major cells clusters identified from scRNAseq performed on mice subjected to carotid ligation. n = 9 in control and carotid plaque group (control and diseased tissues are taken from the same mouse). C) Dot plot showing Cryab and Inhba enrichment in Fibro‐SMC clusters. D) Dot and E) violin plot show the higher expression and significant enrichment of Cryab and Inhba in control arteries. F) AAA mouse model (PPE infusion) and sham animals (Ctrl). G) UMAP plot showing the major cells clusters identified from scRNAseq performed on aortas isolated from control mice or subjected to the PPE‐induced AAA model. In control group n = 5, and in AAA group n = 6. H) Dot plot showing Cryab and Inhba mostly expressed in the Fibro‐SMC clusters. I) Dot and J) violin plot showing the significant enrichment Cryab and Inhba in Fibro‐SMC clusters of control mice aortas. The FindMarkers function was used to compare the DEGs between the control and carotid plaque/AAA tissue, by using the default “Wilcoxon Rank Sum test”. (****) p<0.0001, (**) p<0.0021.
Figure 7
Figure 7
AoC as a testing model for therapeutical agent Lenvatinib. A) Volcano‐plot with de‐regulated genes 48 h after transfection with siCRYAB in CaSMC. Highlighted are genes contributing to GSEA score enrichment of Disease Ontology terms “Artery disease” and “Vascular disease”. B,C) Gene Set Enrichment Analysis (GSEA) using Disease Ontology (B) and MSigDB Hallmark (C) gene sets. D) Scheme representing the utilization of the AoC as translational tool. Lenvatinib‐coated balloon showed a therapeutical effect in halting aneurysmal progression in a pre‐clinical porcine model. AAA disease modelling is partially obtained by AoC populated by AAA‐derived SMC. Testing lenvatinib on the AoC can unravel its mechanism of action. E,F) AoCs exposed to lenvatinib or DMSO (ctrl) were submitted to qRT‐PCR to monitor gene expression in EC and AAA‐derived SMC separately. For EC analysis: DMSO group n = 10; Lenvatinib group n = 13. For AAA‐derived SMC analysis: DMSO group n = 4; Lenvatinib group n = 3. Statistics: unpaired T‐test (*) p‐value < 0.05; (**) p‐value < 0.01.

References

    1. Aske K. C., Waugh C. A., EMBO Rep. 2017, 18, 1490. - PMC - PubMed
    1. Ronaldson‐Bouchard K., Vunjak‐Novakovic G., Cell Stem Cell 2018, 22, 310. - PMC - PubMed
    1. Jackson E. L., Lu H., Integr. Biol. (Camb). 2016, 8, 672. - PMC - PubMed
    1. Bhatia S. N., Ingber D. E., Nat. Biotechnol. 2014, 32, 760. - PubMed
    1. Song P., Fang Z., Wang H., Cai Y., Rahimi K., Zhu Y., Fowkes F. G. R., Fowkes F. J. I., Rudan I., Lancet Global Health 2020, 8, E721. - PubMed

Publication types