. 2023 Oct 17;4(10):101211.
doi: 10.1016/j.xcrm.2023.101211. Epub 2023 Oct 4.

Human APOBEC3B promotes tumor development in vivo including signature mutations and metastases

Affiliations

Human APOBEC3B promotes tumor development in vivo including signature mutations and metastases

Cameron Durfee et al. Cell Rep Med. .

Abstract

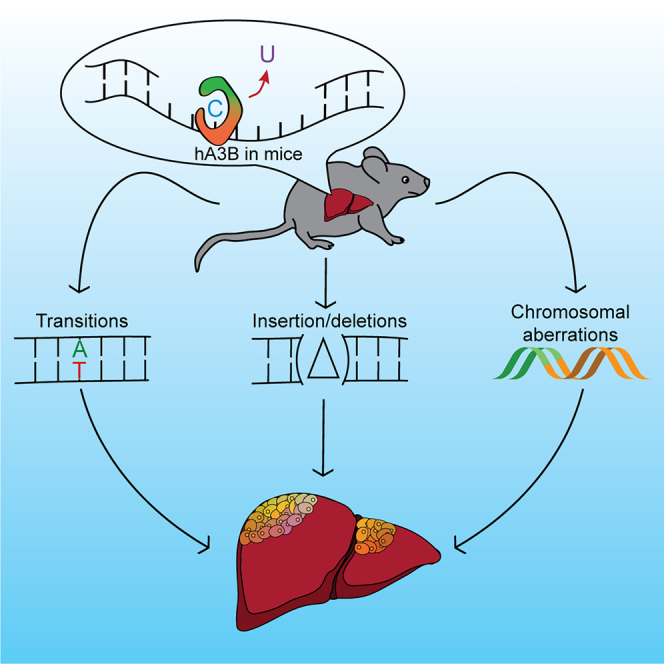
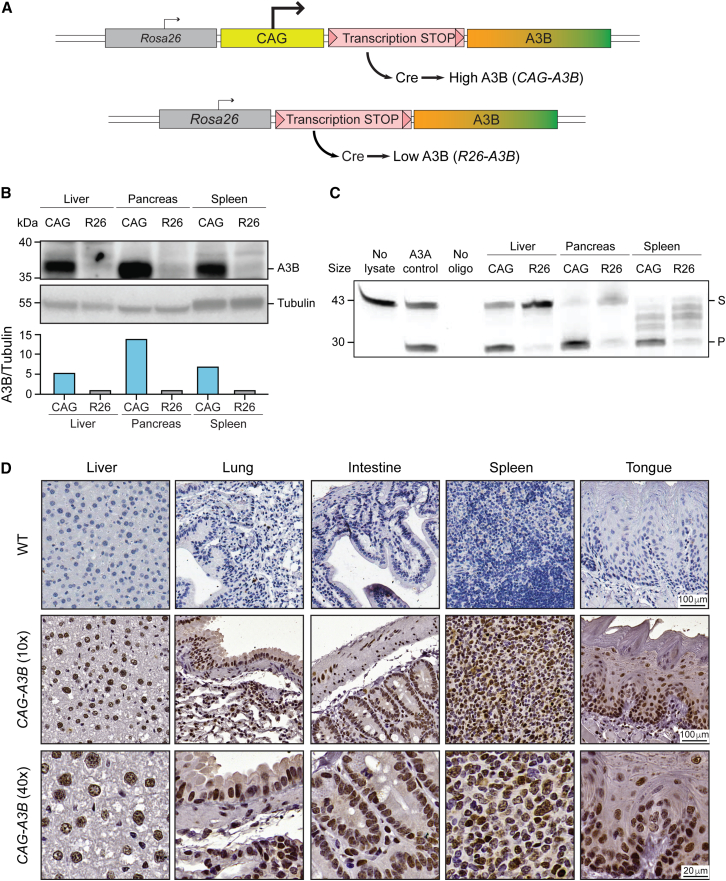
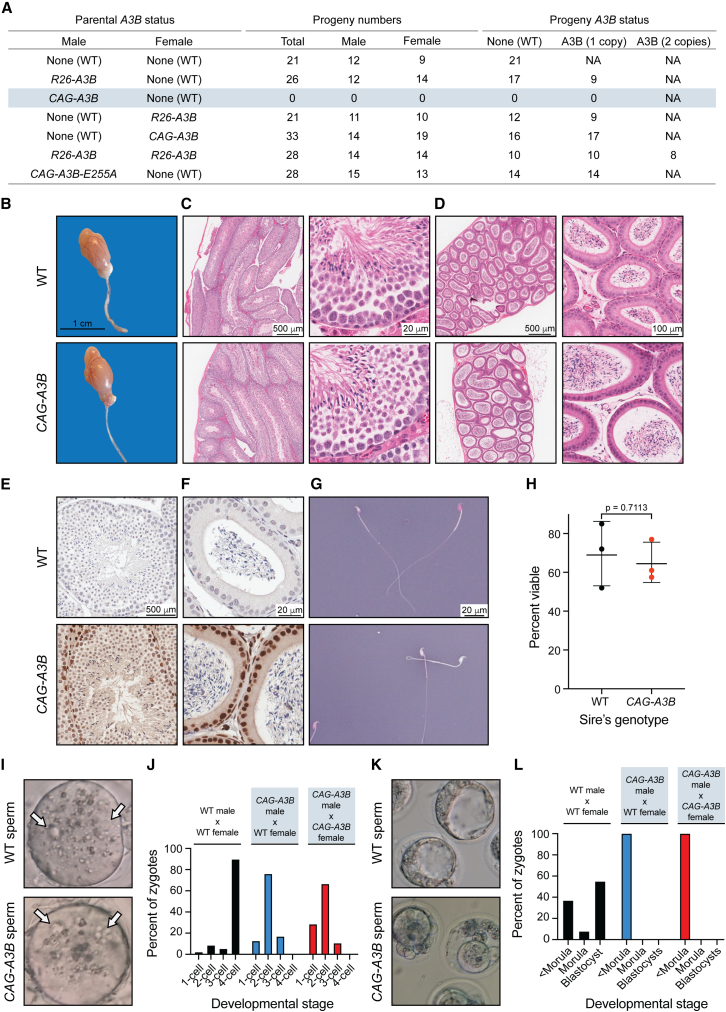
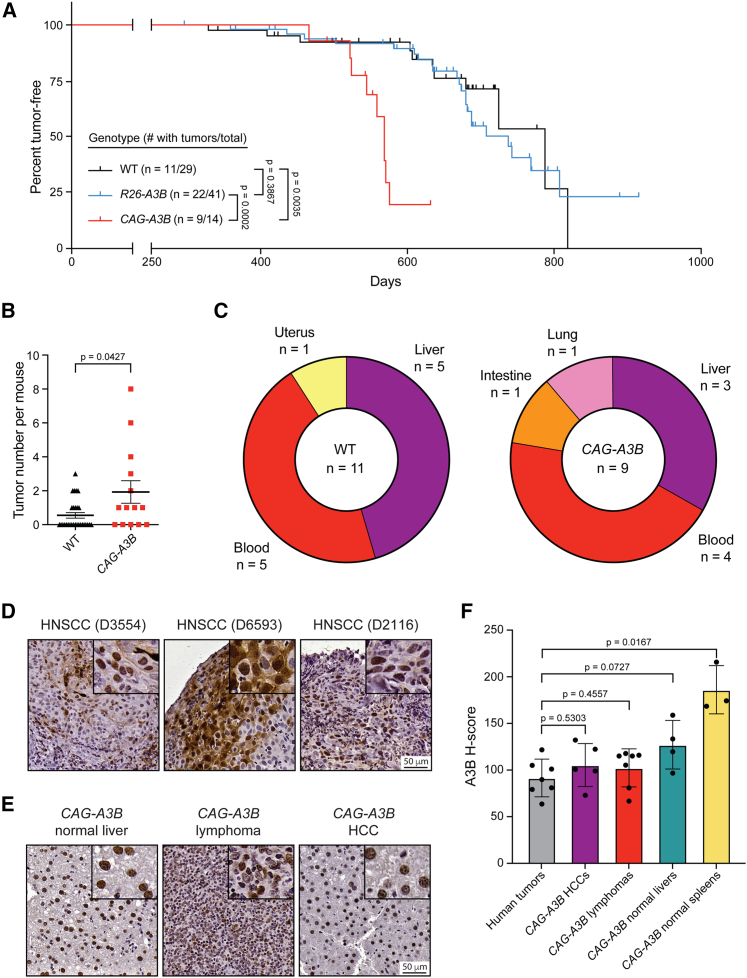
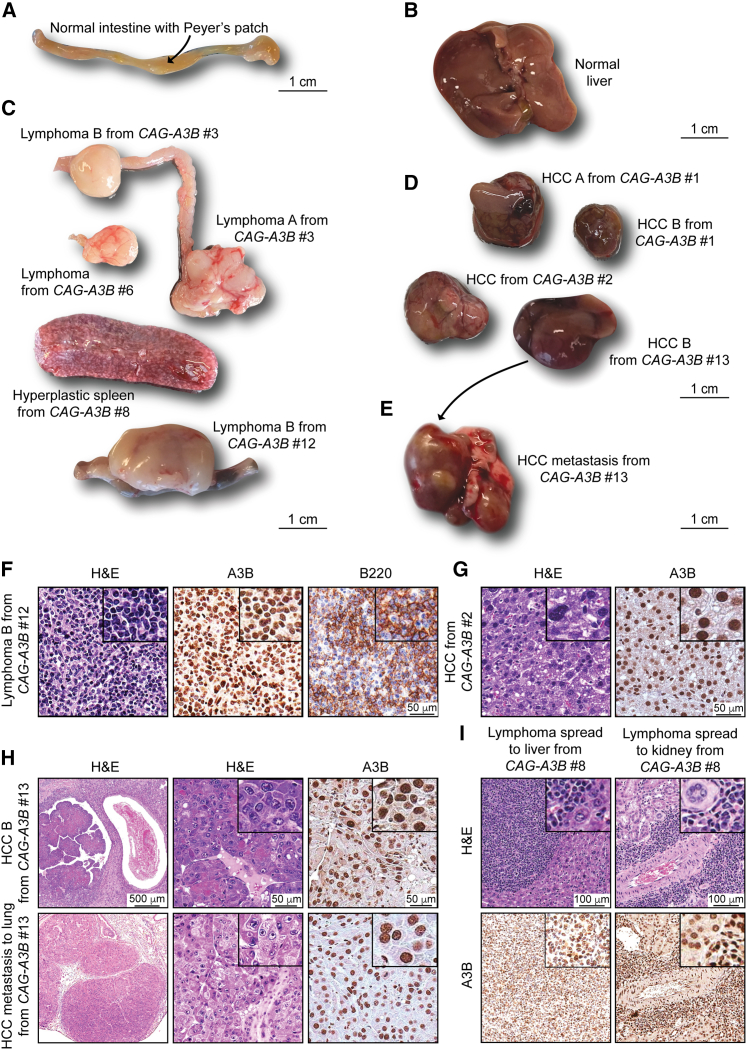
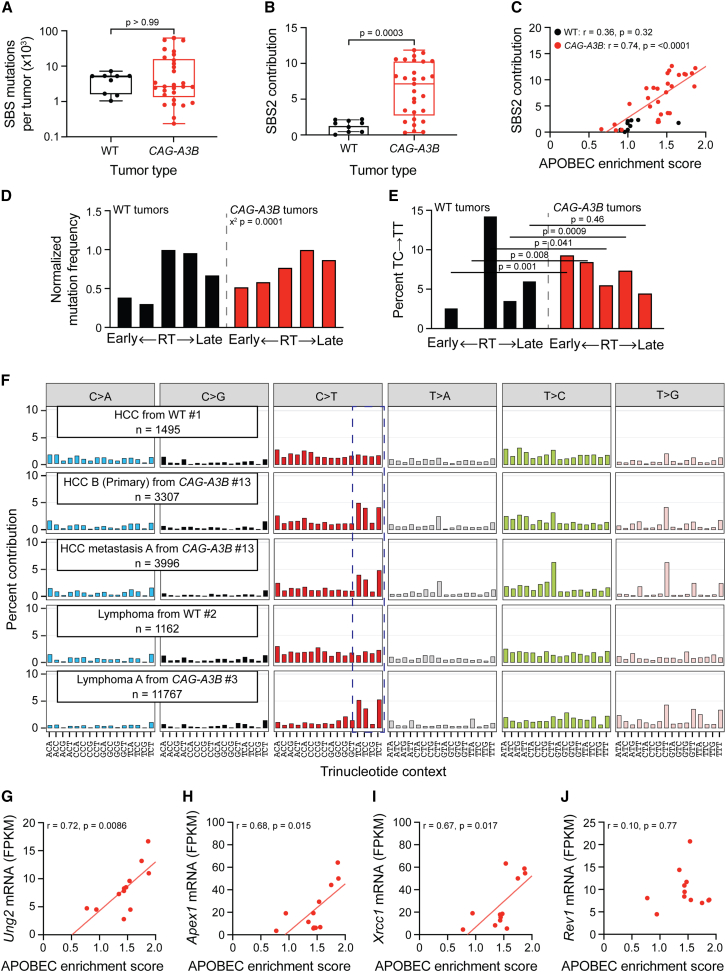
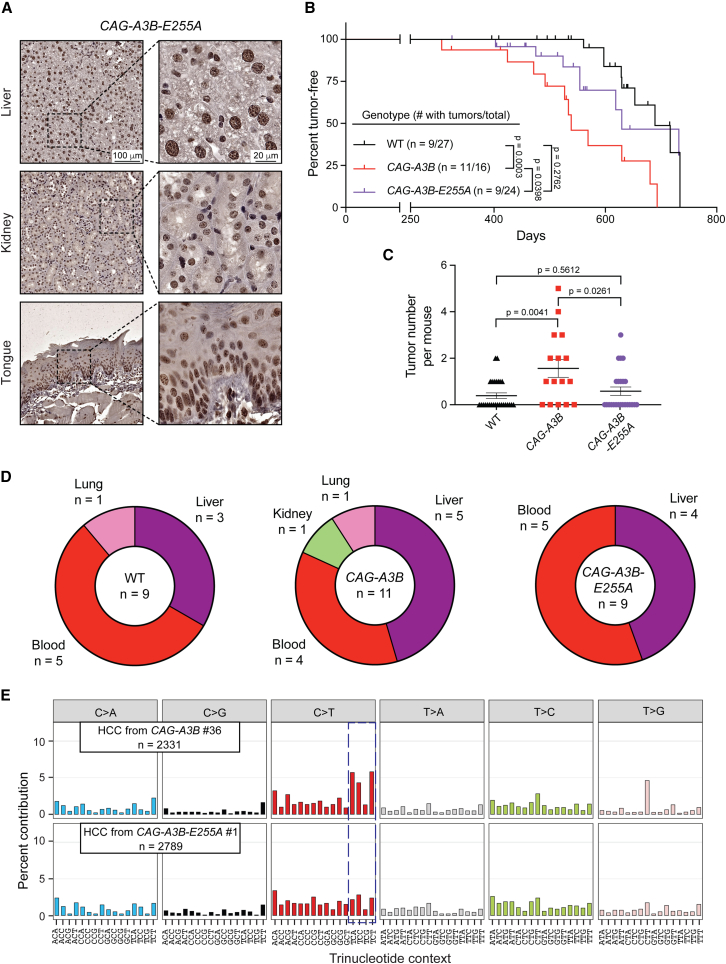
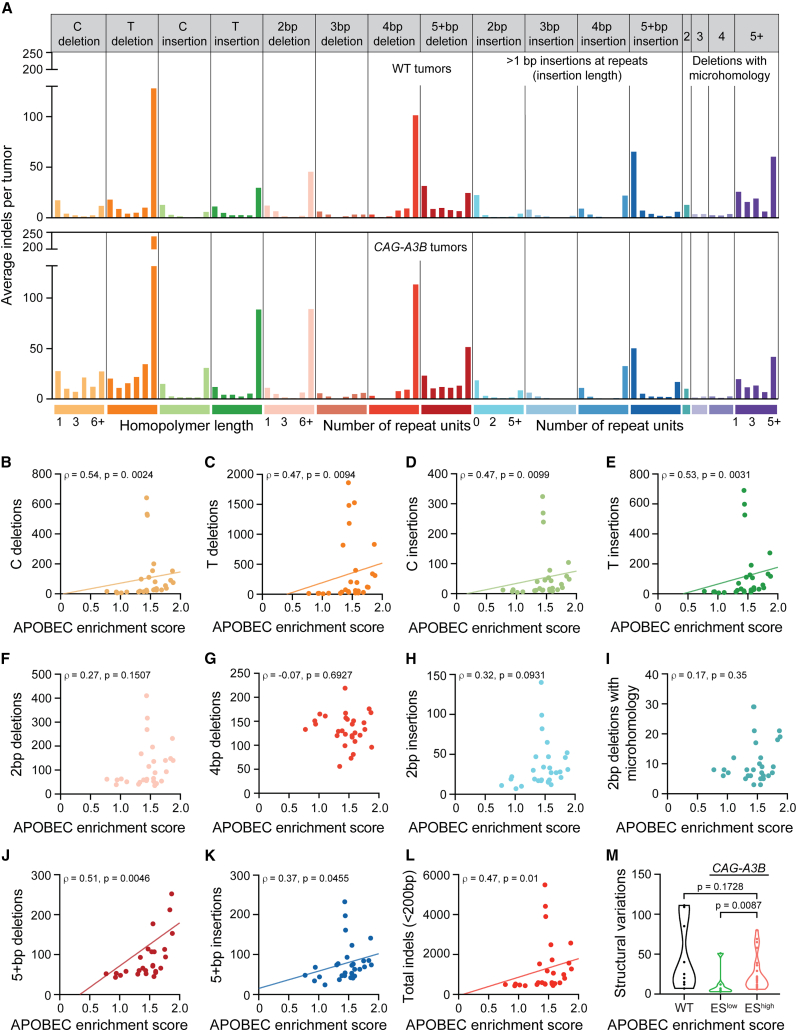
The antiviral DNA cytosine deaminase APOBEC3B has been implicated as a source of mutation in many cancers. However, despite years of work, a causal relationship has yet to be established in vivo. Here, we report a murine model that expresses tumor-like levels of human APOBEC3B. Animals expressing full-body APOBEC3B appear to develop normally. However, adult males manifest infertility, and older animals of both sexes show accelerated rates of carcinogenesis, visual and molecular tumor heterogeneity, and metastasis. Both primary and metastatic tumors exhibit increased frequencies of C-to-T mutations in TC dinucleotide motifs consistent with the established biochemical activity of APOBEC3B. Enrichment for APOBEC3B-attributable single base substitution mutations also associates with elevated levels of insertion-deletion mutations and structural variations. APOBEC3B catalytic activity is required for all of these phenotypes. Together, these studies provide a cause-and-effect demonstration that human APOBEC3B is capable of driving both tumor initiation and evolution in vivo.

Keywords: APOBEC3B; DNA mutagenesis; cancer; lymphoma; murine tumor model; tumor heterogeneity.


Conflict of interest statement

Declaration of interests The authors declare no competing interests.

Figures

None
Graphical abstract
Figure 1
Figure 1
Murine models for inducible expression of human A3B (A) Schematics of our two different Rosa26 knockin A3B minigene constructs. Human A3B expression at high (CAG-A3B) or low (R26-A3B) levels, respectively, occurs after Cre-mediated excision of the loxP (pink triangle)-flanked transcription stop cassette. (B and C) Immunoblot and ssDNA deaminase activity of human A3B protein expressed in the indicated tissues from CAG-A3B and R26-A3B animals. Tubulin provides a loading control, and recombinant A3A is a positive control for activity (S, substrate; P, product). Normalized A3B signal quantification relative to tubulin is shown below the immunoblot. (D) Anti-A3B IHC staining of representative tissues from WT and CAG-A3B mice (40× magnifications are enlargements of regions of the corresponding 10× images). See also Figure S1.
Figure 2
Figure 2
High A3B levels cause male-specific infertility (A) Progeny numbers and A3B status for the indicated crosses (n = 3 litters per cross). In parental animals with A3B, the indicated A3B minigene (R26 or CAG) is heterozygous in combination with a WT Rosa26 locus (data not shown). The A3B status of progeny is dictated by the parental cross. (B) Images of a representative testicle and epididymis from WT and CAG-A3B males. (C and D) H&E-stained sections of WT (top) and CAG-A3B (bottom) testicle and epididymis, respectively. (E and F) Anti-A3B IHC staining of the seminiferous tubule and epididymal lumen from WT and CAG-A3B males, respectively. (G and H) Representative images and quantification of spermatozoa from WT and CAG-A3B males, stained with eosin-nigrosin to distinguish live (white) and dead (pink) cells, respectively (mean ± SD of n = 200 sperm from 3 independent males; unpaired t test p value indicated). (I) Images of zygotes 7 h postfertilization of a WT ovum with spermatozoa from the indicated male genotypes. Arrows point to pronuclei, which indicate successful fertilization. (J) Proportion of embryos at the indicated developmental stage 48 h postfertilization in vitro (n > 50 zygotes analyzed per condition). (K) Images of developing embryos 96 h postfertilization in vitro. (L) Proportion of embryos at the indicated developmental stage 96 h postfertilization in vitro (n > 50 zygotes analyzed per condition; continuation of experiment reported in J).
Figure 3
Figure 3
CAG-A3B mice exhibit accelerated rates of tumor progression and elevated tumor numbers (A) Kaplan-Meier curves comparing tumor-free survival of WT (n = 29), R26-A3B (n = 41), and CAG-A3B (n = 14) mice. The number of animals with tumors is shown over the total number of animals in each group (log rank Mantel-Cox test p values indicated). Vertical lines on each curve indicate mice that were censored. (B) Dot plot of the number of tumors per mouse in each respective genotype (mean ± SEM; Mann-Whitney U test p value indicated). (C) Pie chart summarizing primary tumor locations in WT and CAG-A3B mice. (D) Anti-A3B IHC staining of representative tissues from human head and neck squamous cell carcinomas (HNSCCs). Inset boxes show the same tissues at 4× additional magnification. (E) Anti-A3B IHC staining of representative tissues from CAG-A3B mouse tissues. Inset boxes show portions of the same tissues with 4× additional magnification. (F) Quantification of anti-A3B IHC staining in HNSCCs (n = 7), CAG-A3B HCCs (n = 5), CAG-A3B lymphomas (n = 7), CAG-A3B healthy liver tissues (n = 4), and CAG-A3B healthy spleens (n = 3) (mean ± SD; Mann-Whitney U test p values indicated). See also Figures S1–S3 and Tables S1 and S2.
Figure 4
Figure 4
Heterogeneity and evidence for metastasis in tumors from CAG-A3B animals (A and B) Representative healthy intestine with Peyer’s patch (arrow) and healthy liver tissues, respectively, from CAG-A3B mice. (C and D) Macroscopic pictures of a heterogeneous assortment of lymphomas and HCCs, respectively, from CAG-A3B mice. (E) Representative image of a primary HCC that metastasized to the lung (HCC B from CAG-A3B #13 in D). (F) H&E, anti-A3B, and anti-B220 IHC of lymphoma B from CAG-A3B #12. Inset boxes show portions of the same tumors at 4× additional magnification. (G) H&E and anti-A3B IHC of HCC from CAG-A3B #2. Inset boxes show portions of the same tumors at 4× additional magnification. (H) H&E and anti-A3B IHC staining of a primary HCC (top) and its metastatic dissemination to the lung (bottom) from CAG-A3B #13. Inset boxes show portions of the same tumors at 4× additional magnification. (I) H&E and anti-A3B IHC staining of a diffuse large B cell lymphoma in the liver (left) and kidney (right). Inset boxes show the same tumors at 4× additional magnification. See also Figure S4 and Table S1.
Figure 5
Figure 5
CAG-A3B tumors exhibit APOBEC3 signature mutations (A and B) Box and whisker plots of the total number of SBS mutations and the percentage of SBS2, respectively, in tumors from WT and CAG-A3B mice. The middle horizontal line is the median, the top and bottom of the box specify the upper and lower quartiles, and the whiskers outside the box represent the maximum and minimum values (Mann-Whitney U test p value indicated). (C) Scatterplots comparing APOBEC mutation signature enrichment scores to the percentage contribution of SBS2 in tumors from WT and CAG-A3B animals (Pearson correlation coefficient and p values indicated). Linear regression shown for CAG-A3B data (not possible for WT). (D) Bar plots showing the proportion of mutations in WT and CAG-A3B tumors according to early- to late-replicating regions (mutation numbers normalized to the largest quintile in each group). The chi-squared test p value is indicated. (E) Bar plots showing the percentage of TC-to-TT mutations as a percentage of all mutations in each quintile in (D) (Mann-Whitney U-test p values indicated). (F) Representative SBS mutation profiles for the indicated tumors from WT or CAG-A3B animals (mutation numbers shown). The dashed box highlights APOBEC3-preferred TC motifs characteristic of SBS2. (G–J) Scatterplots of APOBEC enrichment scores from CAG-A3B lymphomas (n = 12) compared to the mRNA levels of Ung2, Apex1, Xrcc1, and Rev1, respectively, from the same tumors (linear regression lines and Pearson correlation coefficients and corresponding p values indicated). See also Figures S5–S7 and Table S1.
Figure 6
Figure 6
DNA deaminase activity is required for A3B-driven tumor phenotypes (A) Anti-A3B IHC staining of representative tissues from CAG-A3B-E255A mice (40× magnifications on right are enlargements of regions of the corresponding 10× images on left). (B) Kaplan-Meier curves comparing tumor-free survival of WT (n = 27), CAG-A3B (n = 16), and CAG-A3B-E255A (n = 24) mice (log rank Mantel-Cox test p values indicated). The number of animals with tumors is shown over the total number of animals in each group. Vertical lines on each curve indicate mice that were censored. (C) Dot plot of the number of tumors per mouse in each respective genotype (mean ± SEM; Mann-Whitney U test p values indicated). (D) Pie chart summarizing tumor locations in CAG-A3B and CAG-A3B-E255A mice. (E) Representative SBS mutation profiles for the indicated tumors from CAG-A3B and CAG-A3B-E255A animals (mutation numbers shown). The dashed box highlights APOBEC3-preferred TC motifs characteristic of SBS2. See also Figure S6.
Figure 7
Figure 7
Hypermutated CAG-A3B tumors also exhibit higher frequencies of a range of structural variations (A) Composite spectrum of the average number of small indels in tumors from WT (n = 9) and CAG-A3B (n = 29) animals. (B–K) Scatterplots showing relationships between APOBEC mutation signature enrichment scores from CAG-A3B tumors and the indicated indel types (linear regression lines, except F–I, and Spearman’s rank correlation coefficients and corresponding p values indicated). (L) Scatterplot showing the relationship between APOBEC mutation signature enrichment scores from CAG-A3B tumors and the total number of indels <200 bp in each tumor (linear regression line and Spearman’s rank correlation coefficient and corresponding p value indicated). (M) Violin plots of the total number of structural variations in tumors from WT mice in comparison with tumors from CAG-A3B animals with low or high APOBEC mutation signature enrichment scores (ES; Mann-Whitney U test p values indicated). See also Figure S7.

Update of

References

    1. Hanahan D. Hallmarks of cancer: new dimensions. Cancer Discov. 2022;12:31–46. doi: 10.1158/2159-8290.CD-21-1059. - DOI - PubMed
    1. Persi E., Wolf Y.I., Horn D., Ruppin E., Demichelis F., Gatenby R.A., Gillies R.J., Koonin E.V. Mutation–selection balance and compensatory mechanisms in tumour evolution. Nat. Rev. Genet. 2021;22:251–262. doi: 10.1038/s41576-020-00299-4. - DOI - PubMed
    1. Reiter J.G., Baretti M., Gerold J.M., Makohon-Moore A.P., Daud A., Iacobuzio-Donahue C.A., Azad N.S., Kinzler K.W., Nowak M.A., Vogelstein B. An analysis of genetic heterogeneity in untreated cancers. Nat. Rev. Cancer. 2019;19:639–650. doi: 10.1038/s41568-019-0185-x. - DOI - PMC - PubMed
    1. Koh G., Degasperi A., Zou X., Momen S., Nik-Zainal S. Mutational signatures: emerging concepts, caveats and clinical applications. Nat. Rev. Cancer. 2021;21:619–637. doi: 10.1038/s41568-021-00377-7. - DOI - PubMed
    1. Alexandrov L.B., Kim J., Haradhvala N.J., Huang M.N., Tian Ng A.W., Wu Y., Boot A., Covington K.R., Gordenin D.A., Bergstrom E.N., et al. The repertoire of mutational signatures in human cancer. Nature. 2020;578:94–101. doi: 10.1038/s41586-020-1943-3. - DOI - PMC - PubMed

Publication types

Substances