

doi: 10.1016/j.cardfail.2023.07.006.
Epub 2023 Sep 26.
Heart Failure Epidemiology and Outcomes Statistics: A Report of the Heart Failure Society of America
Affiliations
- PMID: 37797885
- PMCID: PMC10864030
- DOI: 10.1016/j.cardfail.2023.07.006
Item in Clipboard
Heart Failure Epidemiology and Outcomes Statistics: A Report of the Heart Failure Society of America
J Card Fail.
2023 Oct.
No abstract available
Keywords: Heart failure; epidemiology; incidence; mortality; outcomes; prevalence.
Figures
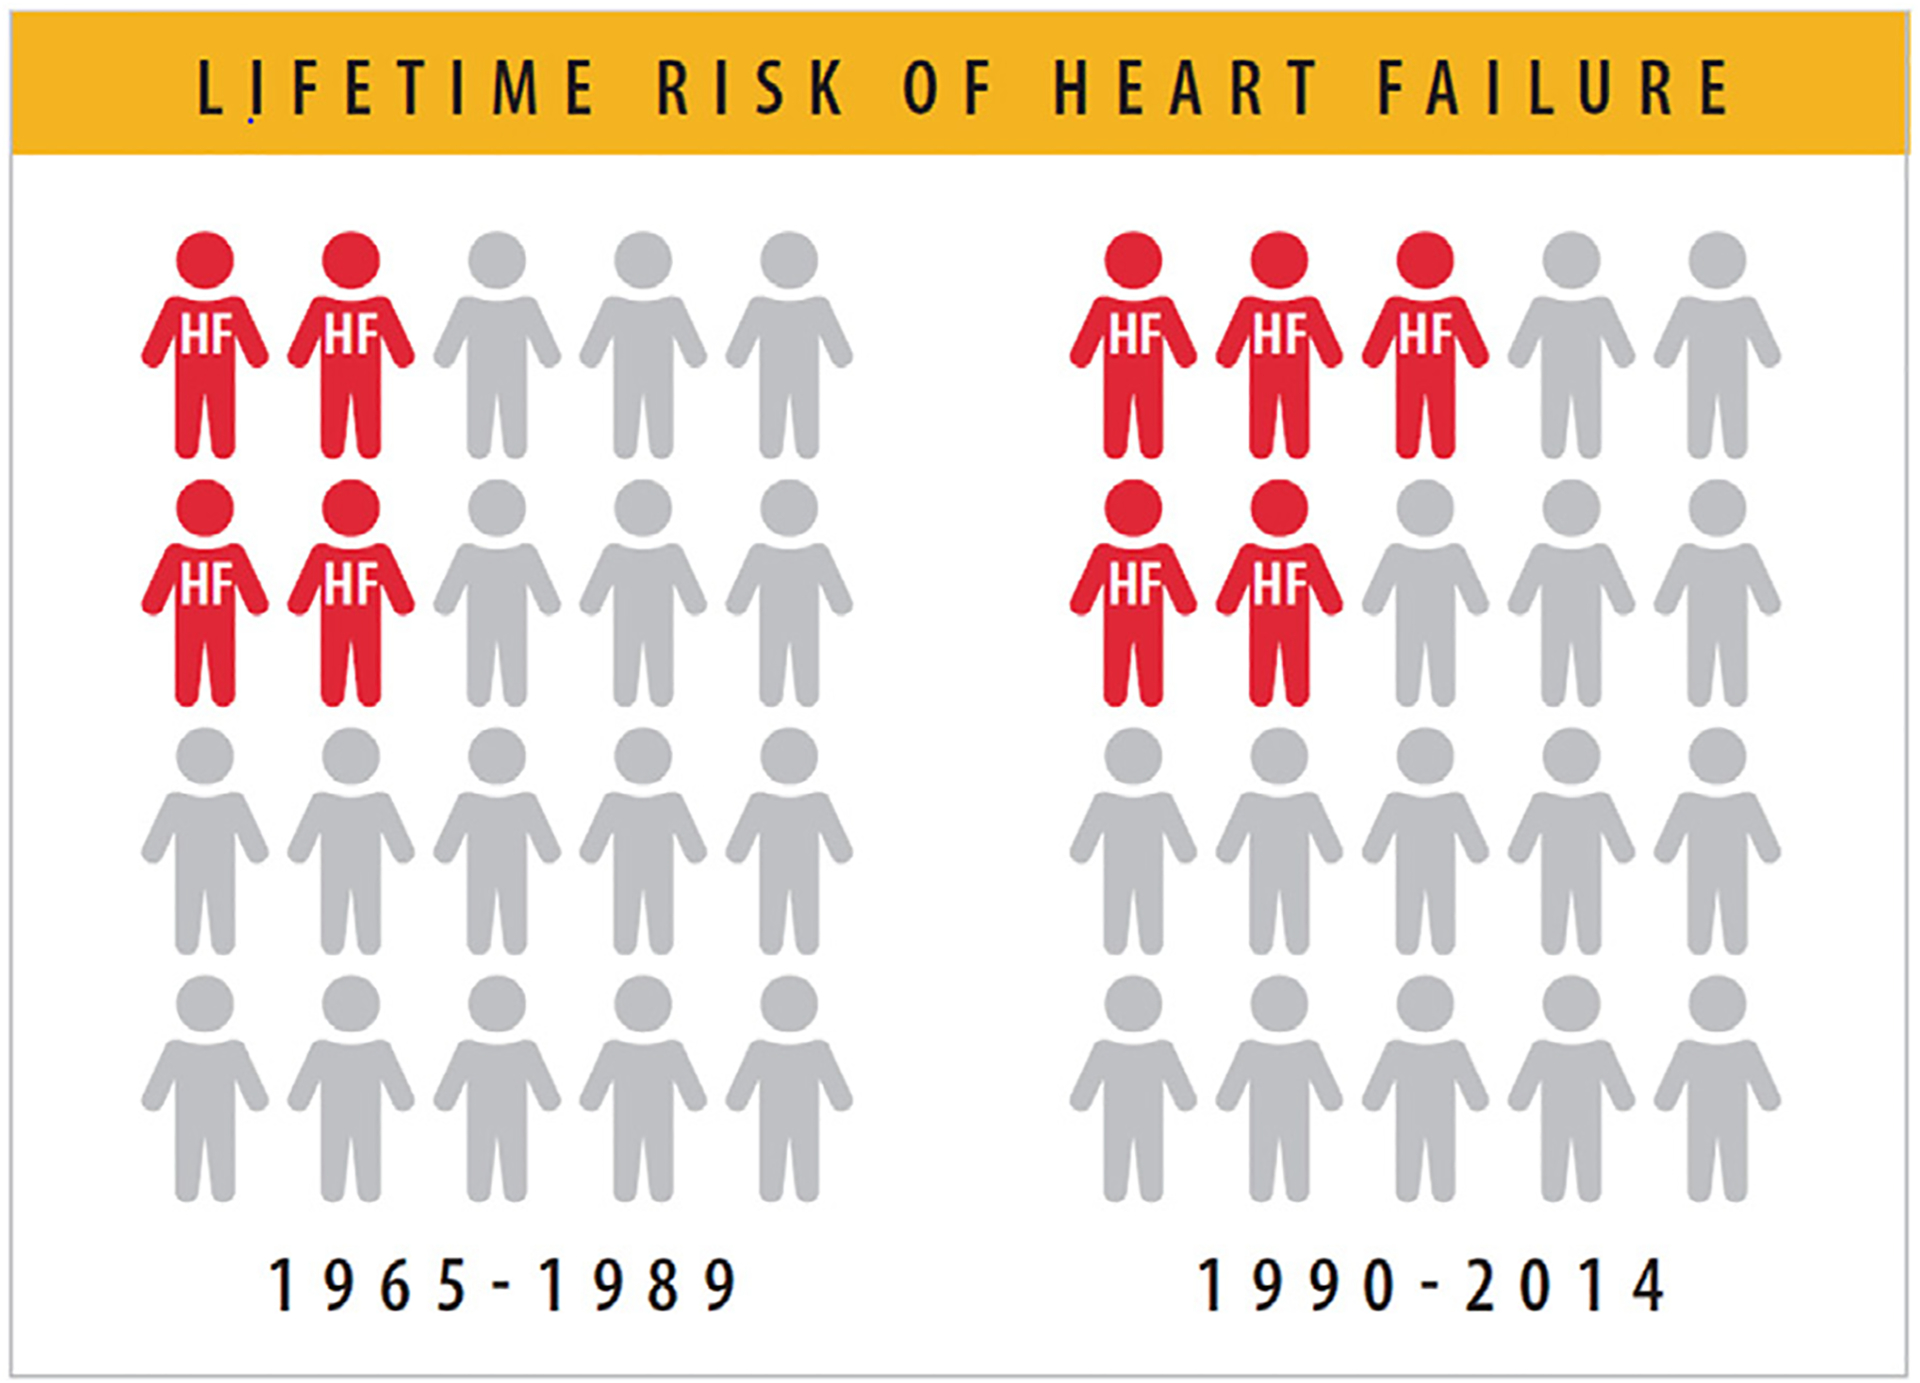
Lifetime risk of HF has increased from 1 in 5 to 1 in 4 people. HF = heart failure. Modified from Vasan RS, Enserro DM, Beiser AS, Xanthakis V. Lifetime risk of heart failure among participants in the Framingham Study. J Am Coll Cardiol 2022;79:250–63.
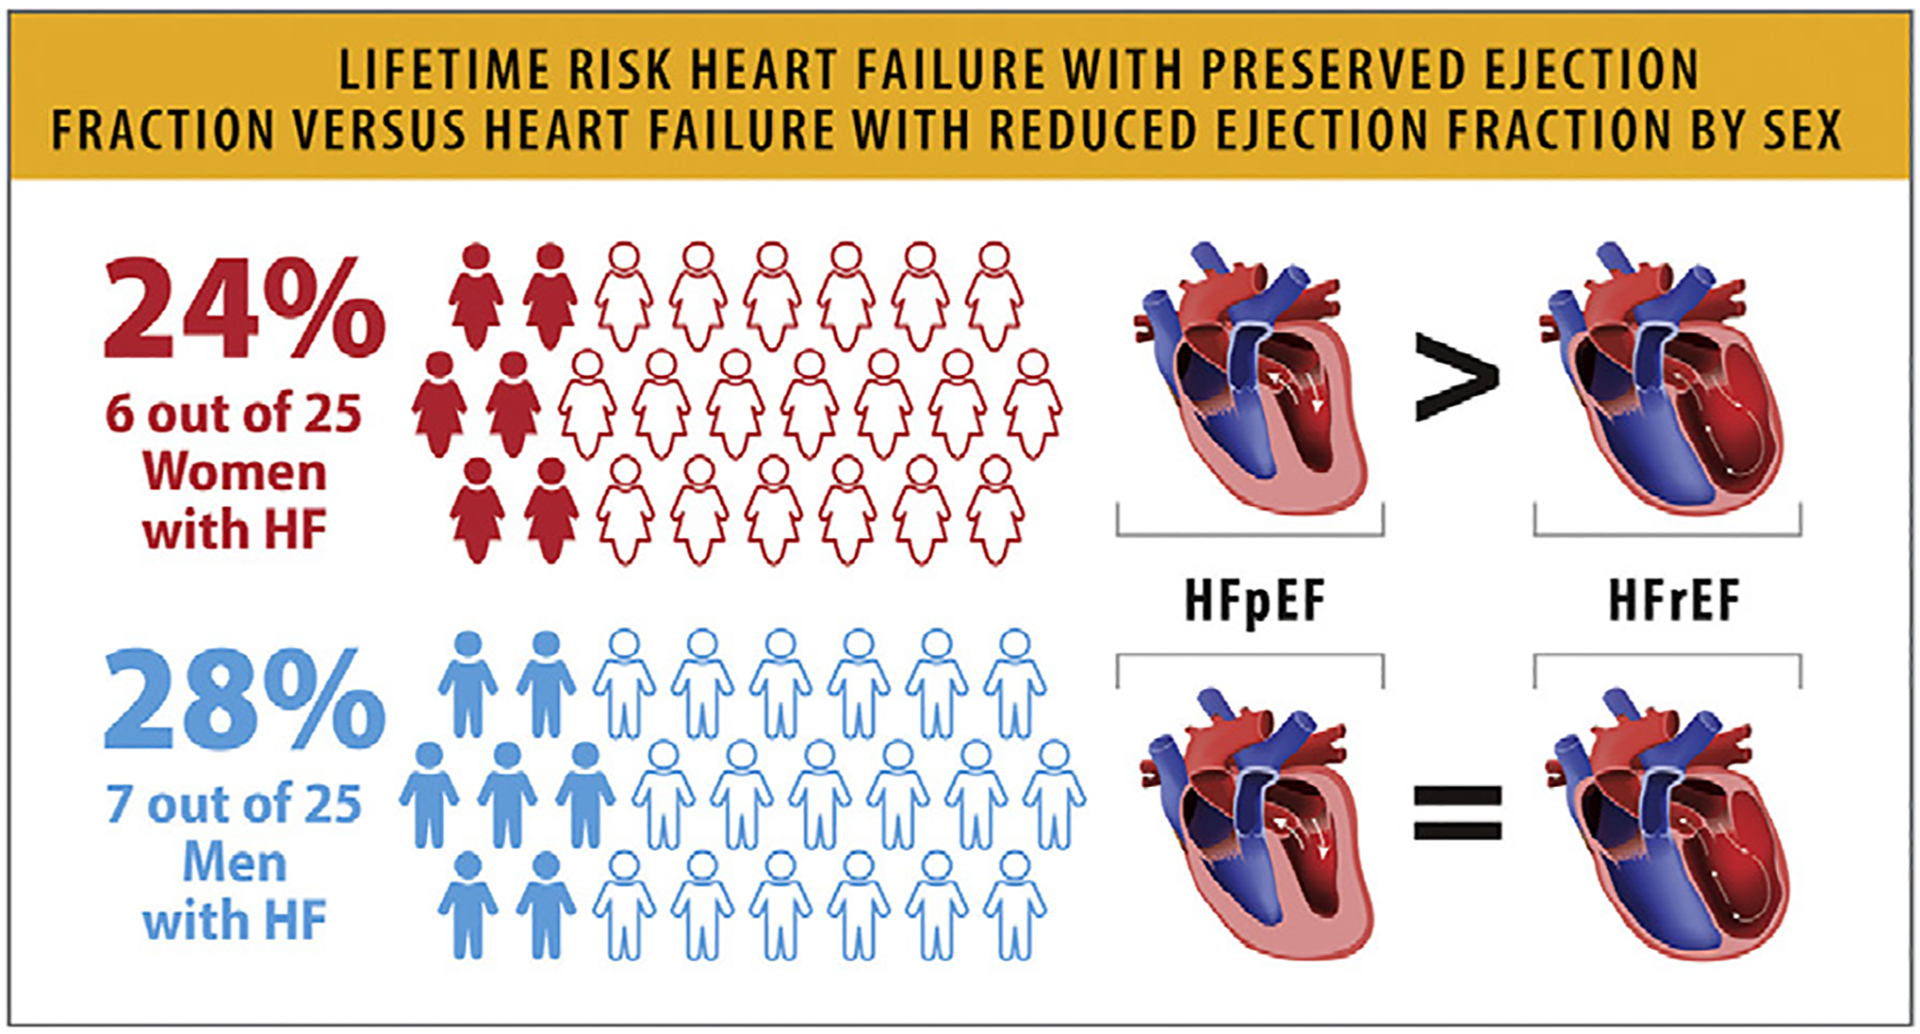
Lifetime risk of HFpEF vs HFrEF by sex. HF = heart failure; HFpEF = heart failure with preserved ejection fraction; HFrEF = heart failure with reduced ejection fraction. Modified from Pandey A, Omar W, Ayers C, LaMonte M, Klein L, Allen NB, et al. Sex and race differences in lifetime risk of heart failure with preserved ejection fraction and heart failure with reduced ejection fraction. Circulation 2018;137:1814–23.
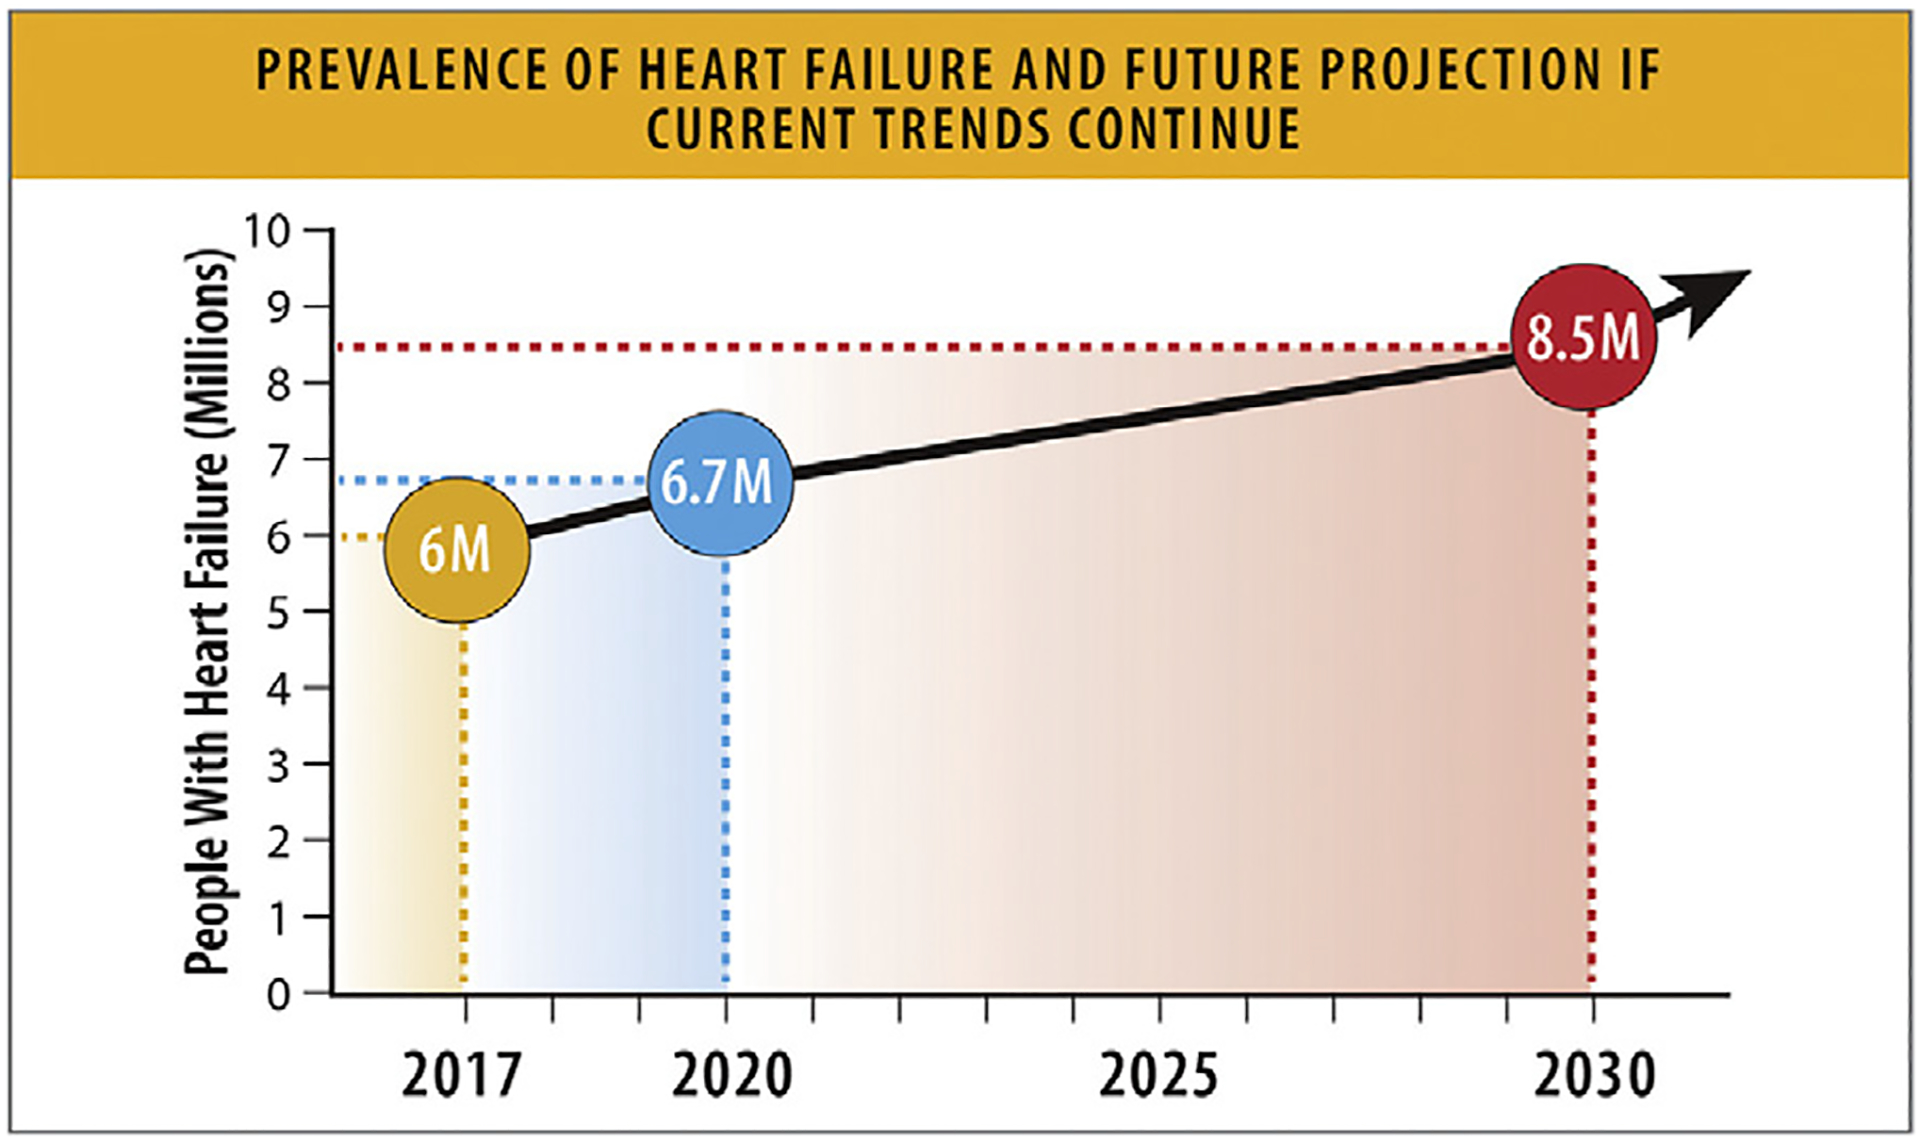
Prevalence of HF and future projection if current trends continue. HF = heart failure. Modified from Van Nuys KE, Xie Z, Tysinger B, Hlatky MA, Goldman DP. Innovation in heart failure treatment: life expectancy, disability, and health disparities. JACC Heart Fail 2018;6:401–9 and Heidenreich PA, Albert NM, Allen LA, Bluemke DA, Butler J, Fonarow GC, et al. Forecasting the impact of heart failure in the United States: a policy statement from the American Heart Association. Circ Heart Fail 2013;6:606–19.
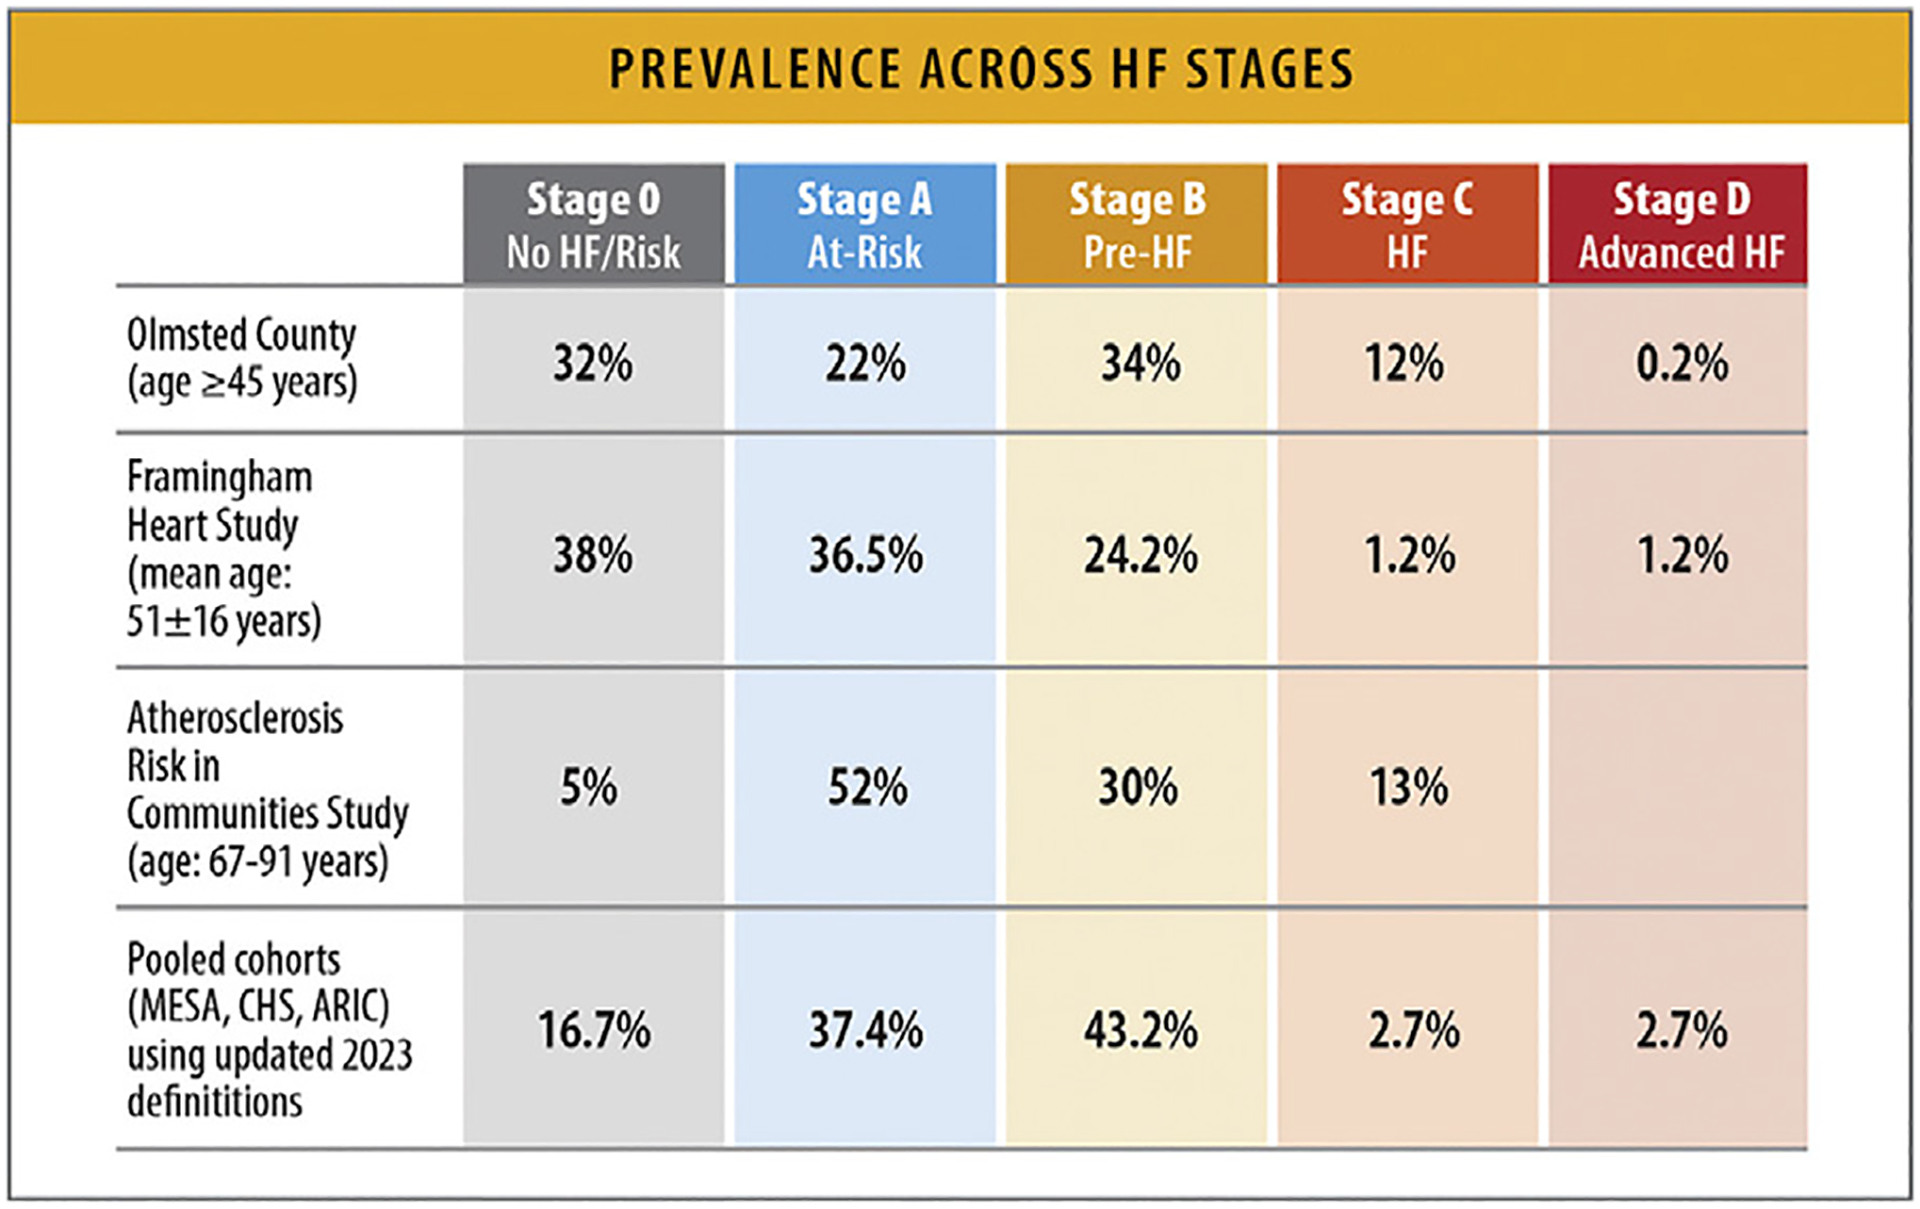
Prevalence across HF stages. ARIC = Atherosclerosis Risk in Communities Study; CHS = Cardiovascular Health Study; HF = heart failure; FHS = Framingham Heart Study; MESA = Multi-Ethnic Study of Atherosclerosis. Modified from Xanthakis V, Enserro DM, Larson MG, Wollert KC, Januzzi JL, Levy D, et al. Prevalence, neurohormonal correlates, and prognosis of heart failure stages in the community. JACC Heart Fail 2016;4:808–15; and Ammar KA, Jacobsen SJ, Mahoney DW, Kors JA, Redfield MM, Burnett JC, et al. Prevalence and prognostic significance of heart failure stages: application of the American College of Cardiology/American Heart Association heart failure staging criteria in the community. Circulation 2007;115:1563–70; and Shah AM, Claggett B, Loehr LR, Chang PP, Matsushita K, Kitzman D, et al. Heart failure stages among older adults in the community: the Atherosclerosis Risk in Communities Study. Circulation 2017;135:224–40.
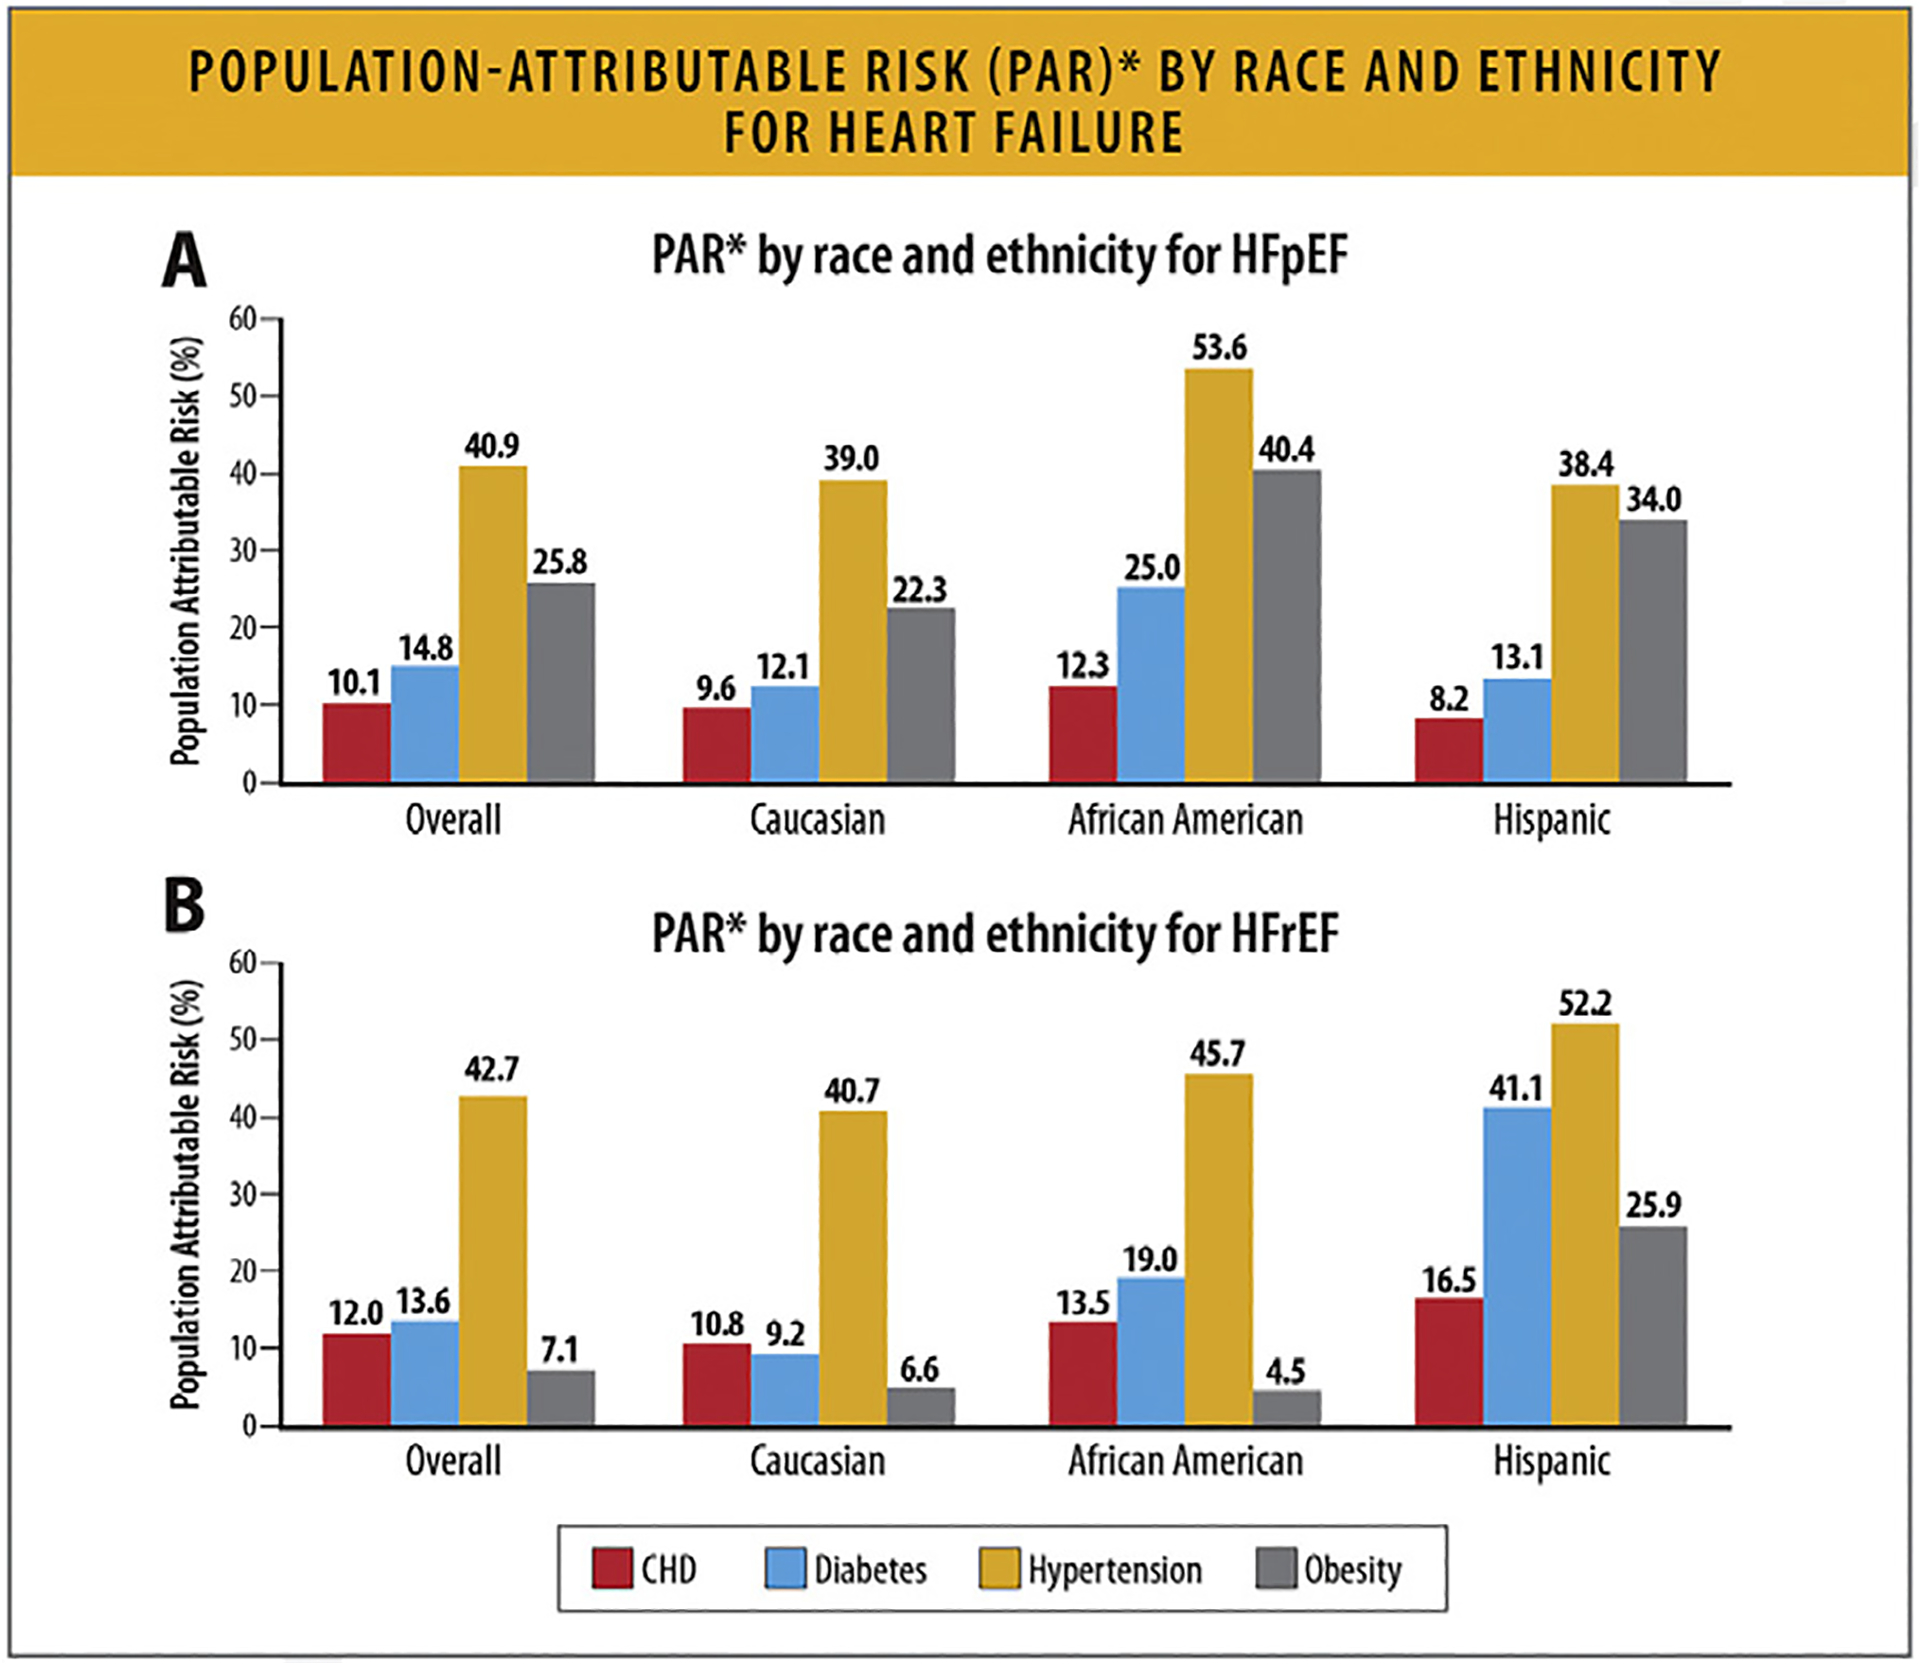
PAR* by race and ethnicity for HF. (A) PAR* by race and ethnicity for HFpEF. *Sum of PAR% within race/ethnicity may be >100% as incidence rates are not adjusted for other risk factors. (B) PAR* by race, and ethnicity for HFrEF. *Sum of PAR% within race/ethnicity may be >100% as incidence rates are not adjusted for other risk factors. CHD = coronary heart disease; HF = heart failure; PAR = population attributable risk. Modified from Eaton CB, Pettinger M, Rossouw J, Martin LW, Foraker R, Quddus A, et al. Risk factors for incident hospitalized heart failure with preserved versus reduced ejection fraction in a multiracial cohort of postmenopausal women. Circ Heart Fail 2016;9:e002883.
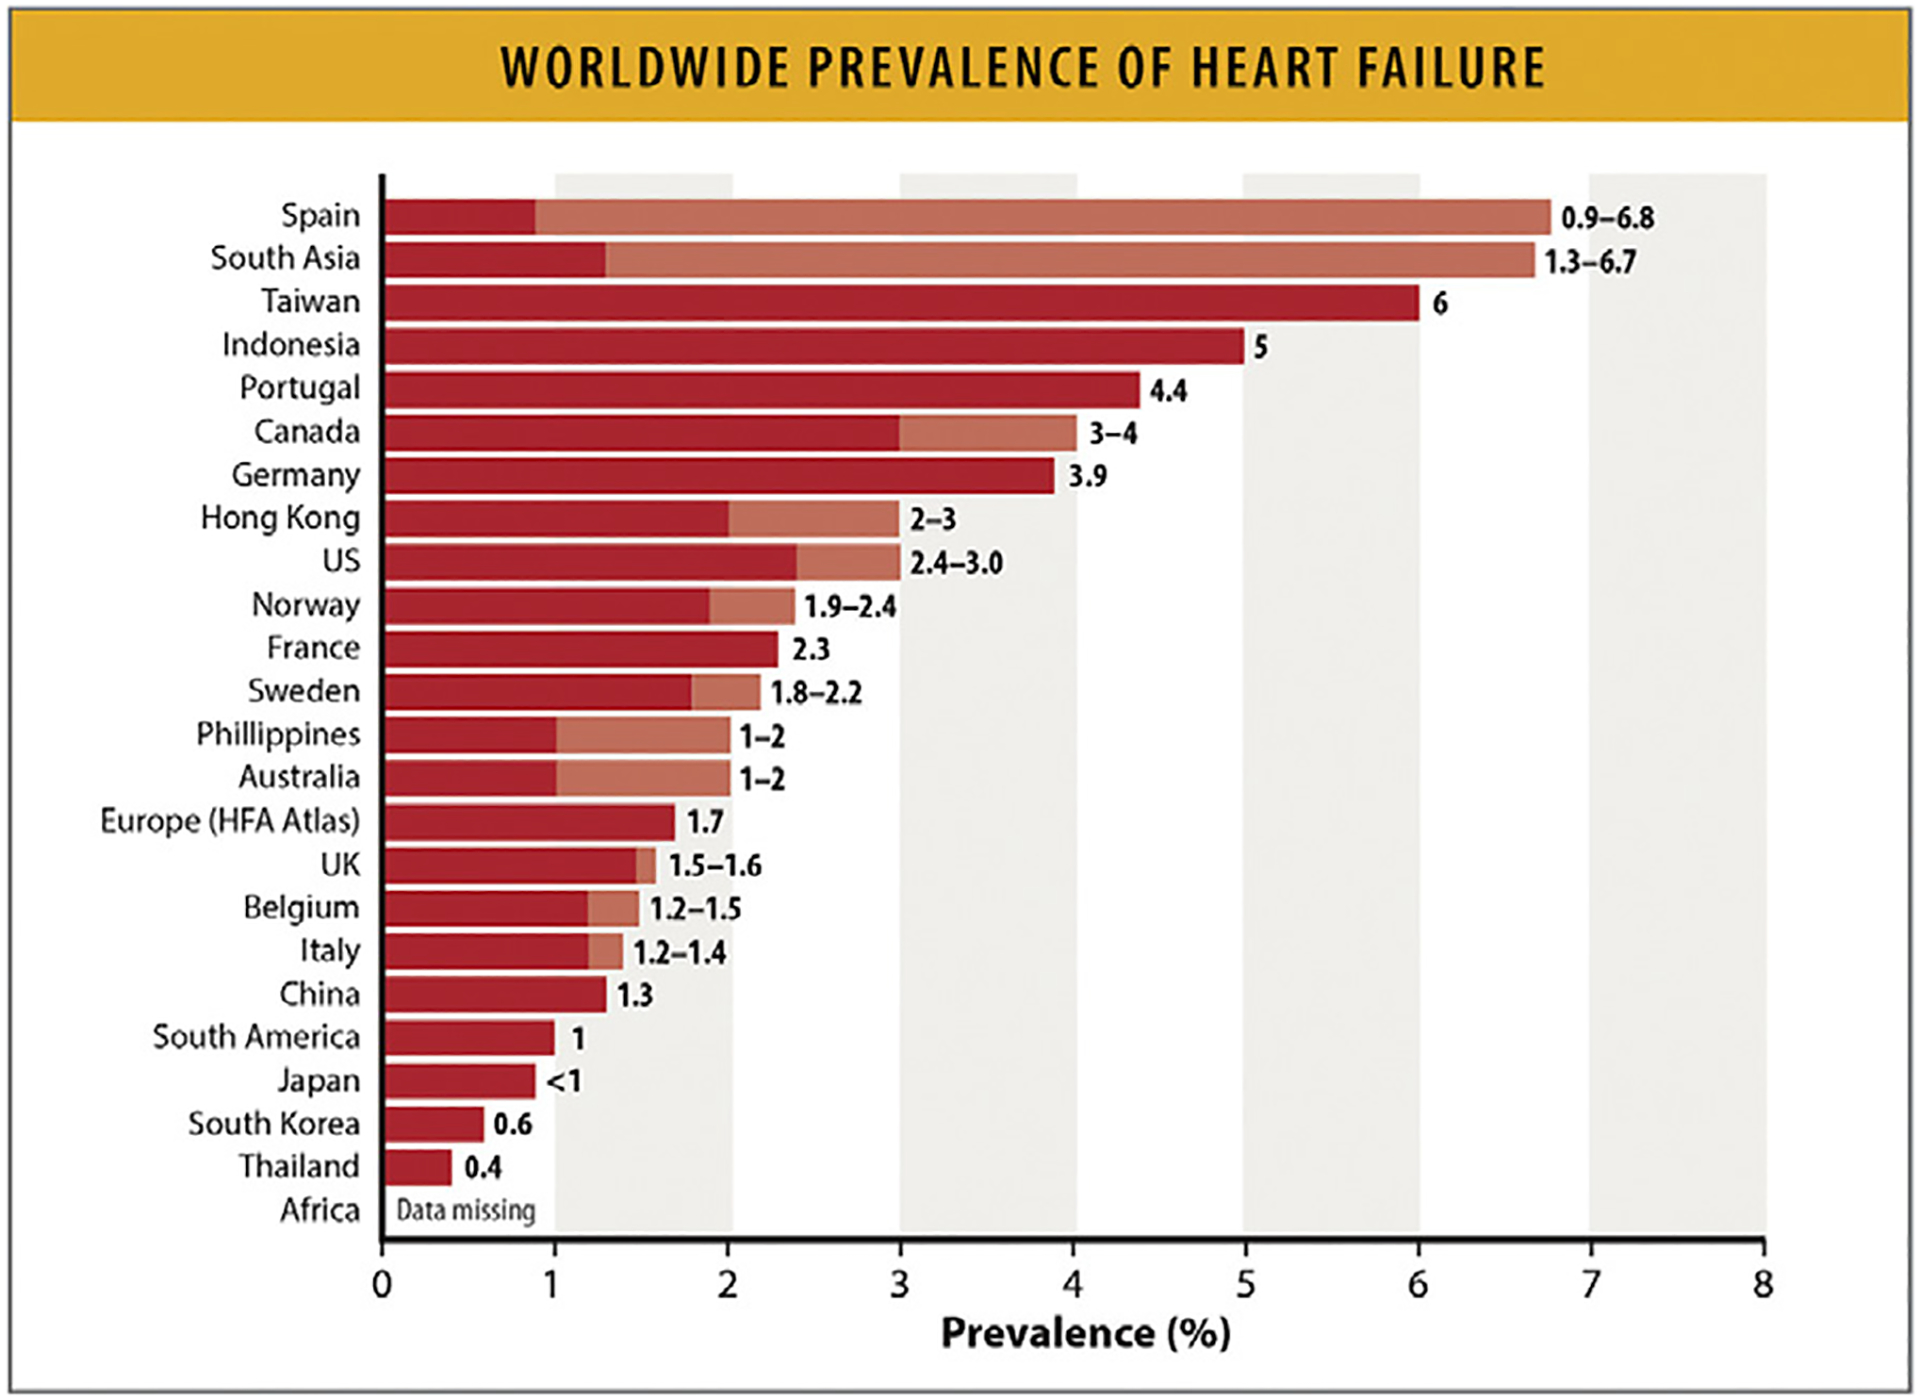
Worldwide prevalence of HF. Values represent age-adjusted prevalence rates from different countries (for some countries a prevalence range is noted and data are derived from more than 1 study. Shades of color represent the ranges of prevalence. HF = heart failure; HFA = Heart Failure Association; US = United States. Modified from Savarese G, Becher PM, Lund LH, Seferovic P, Rosano GMC, Coats AJS. Global burden of heart failure: a comprehensive and updated review of epidemiology. Cardiovasc Res 2023;118:3272–87.
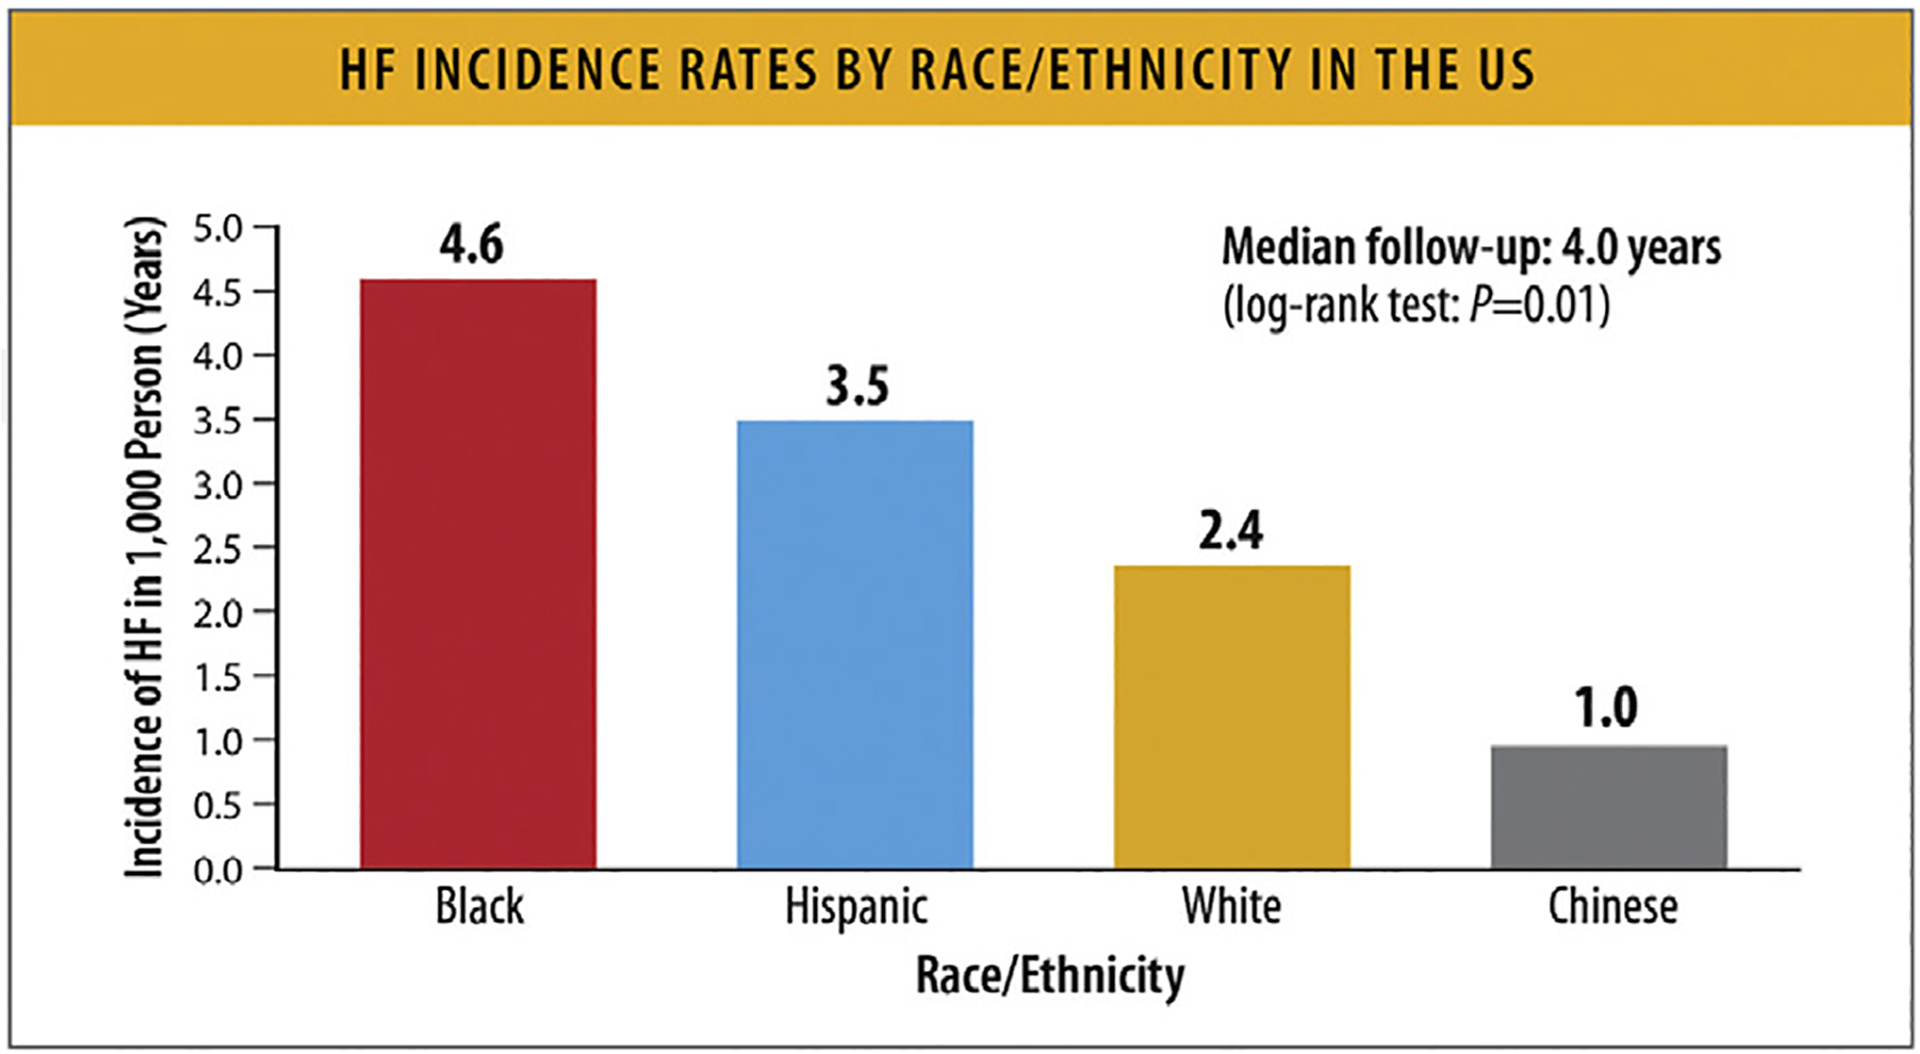
HF incidence rates by race/ethnicity in the United States. HF = heart failure; PY = person-years. Modified from Piña IL, Jimenez S, Lewis EF, Morris AA, Onwuanyi A, Tam E, et al. Race and ethnicity in heart failure: JACC focus seminar 8/9. J Am Coll Cardiol 2021;78:2589–98.
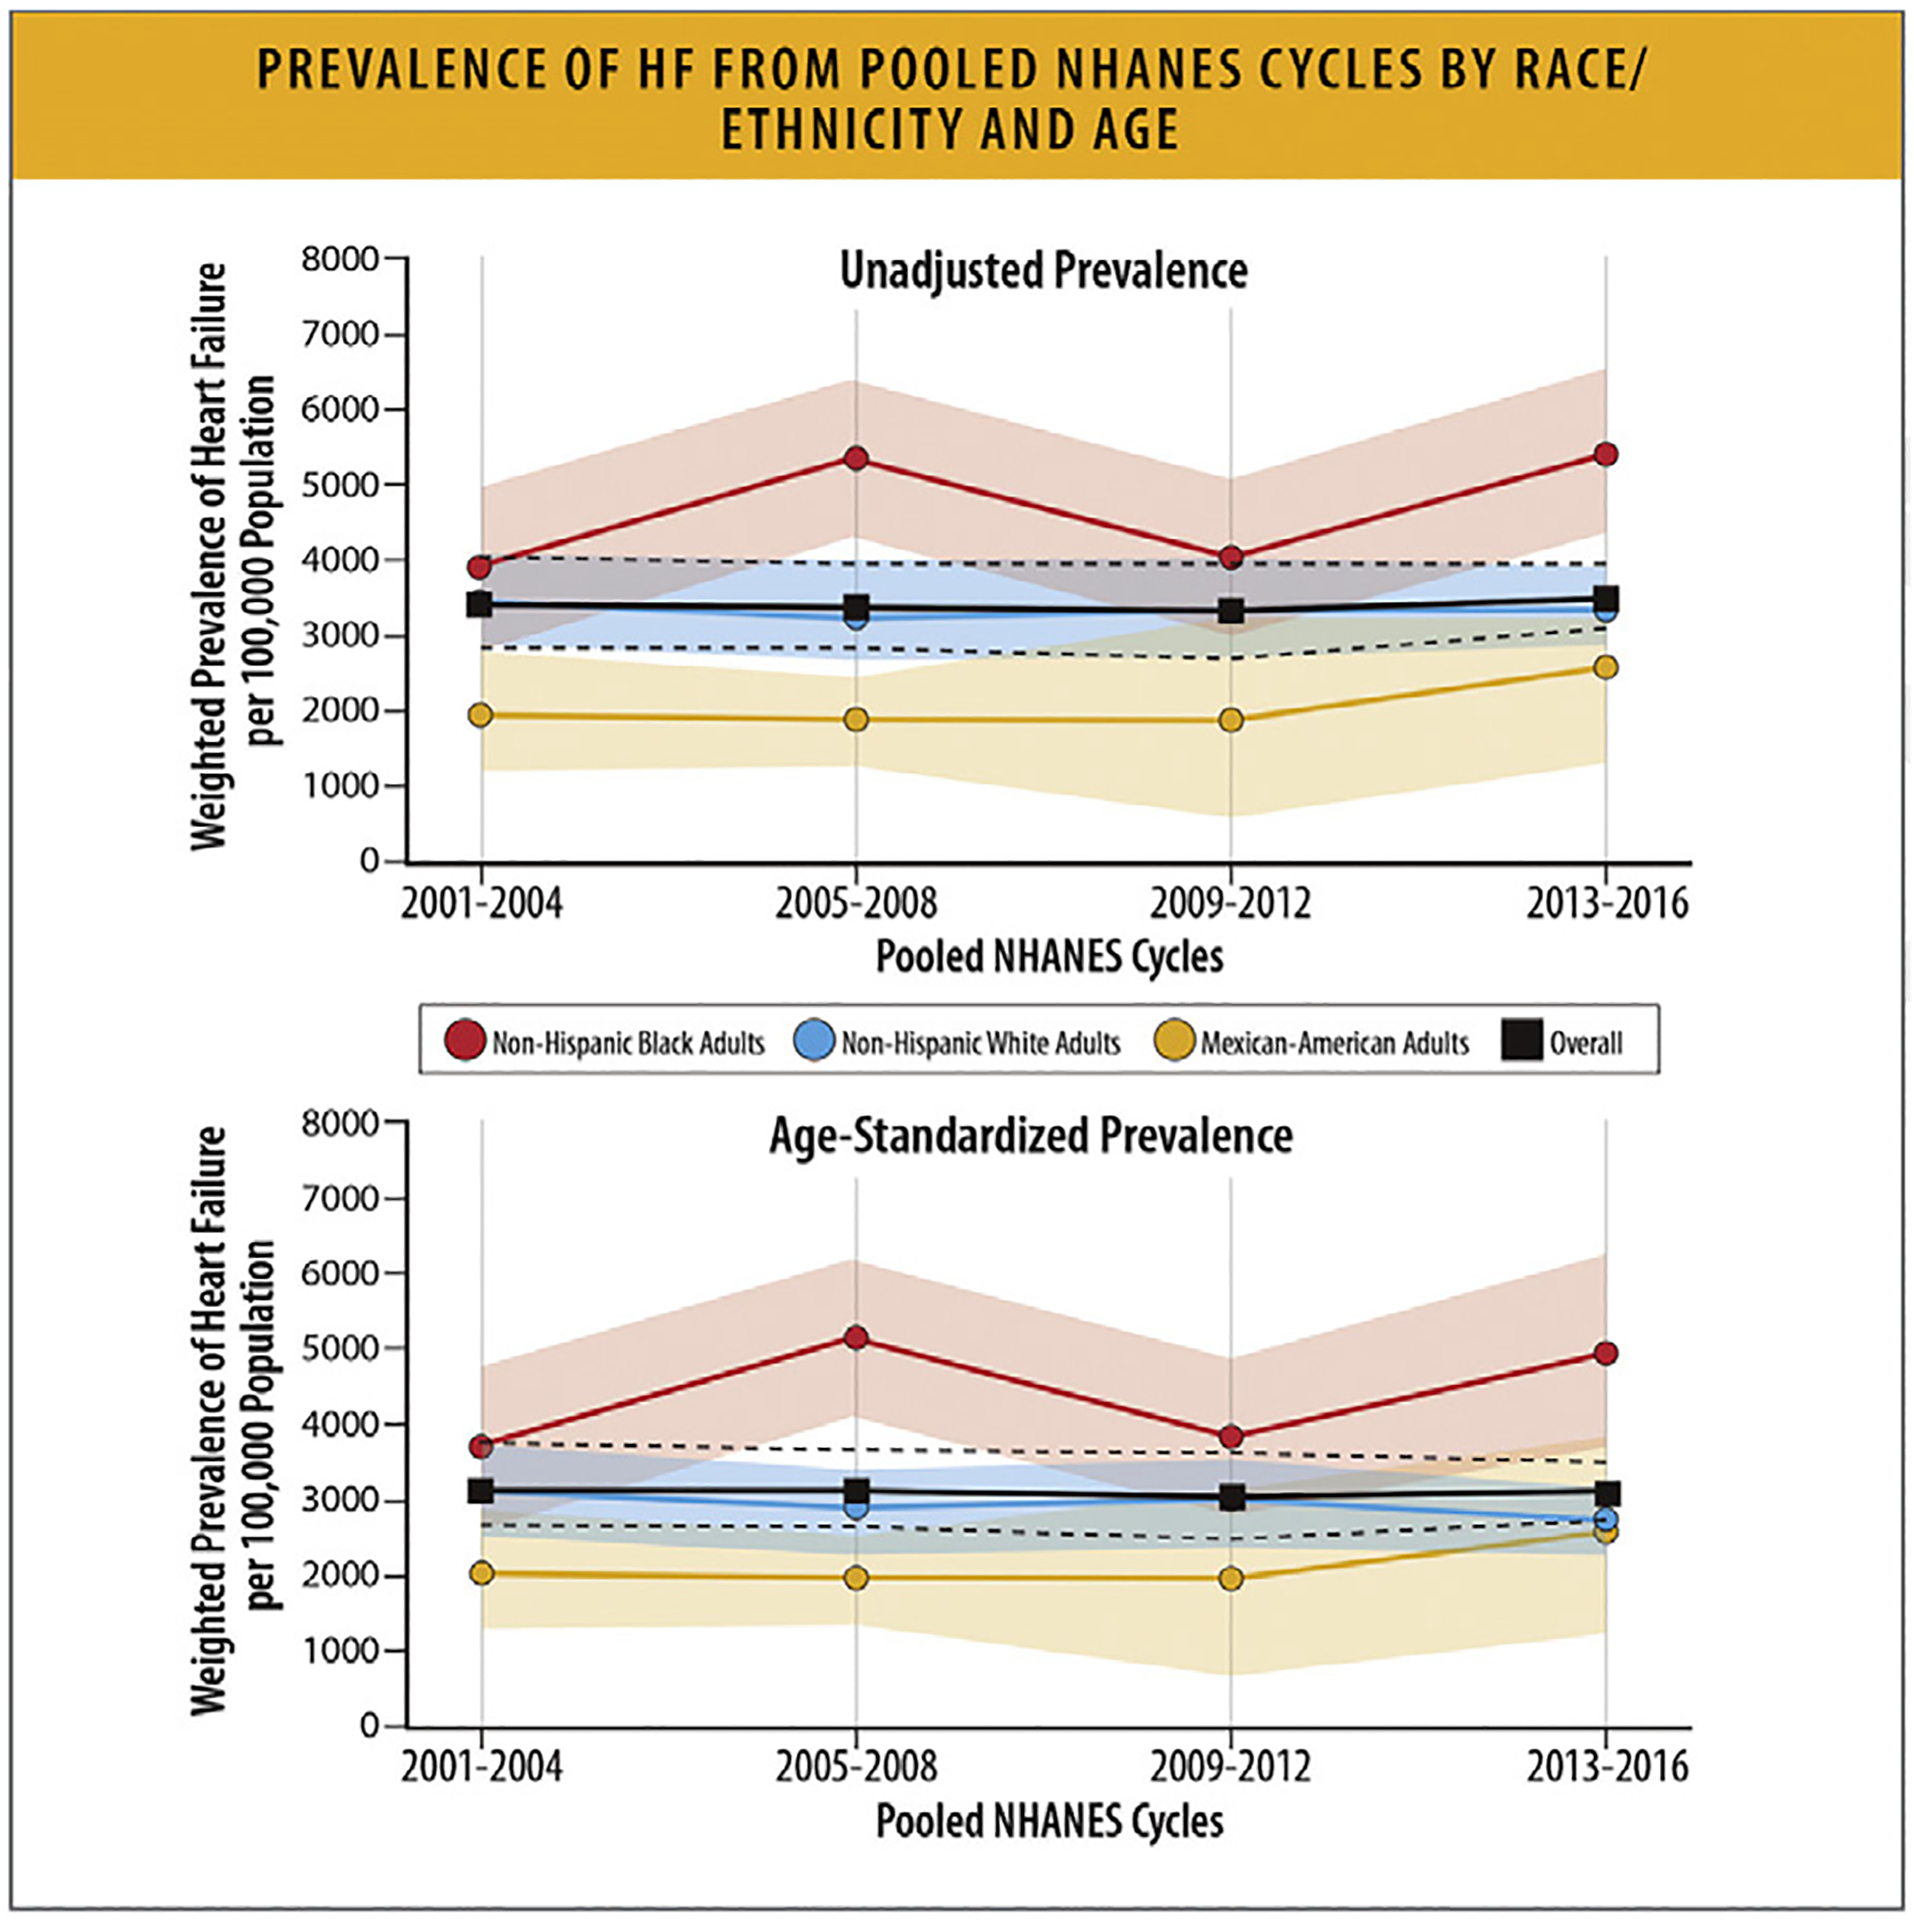
Prevalence of HF from pooled NHANES cycles by race/ethnicity and age. HF = heart failure; NHANES = National Health and Nutrition Examination Survey. Modified from Rethy L, Petito LC, Vu THT, Kershaw K, Mehta R, Shah NS, et al. Trends in the prevalence of self-reported heart failure by race/ethnicity and age from 2001 to 2016. JAMA Cardiol 2020;5:1425–9.
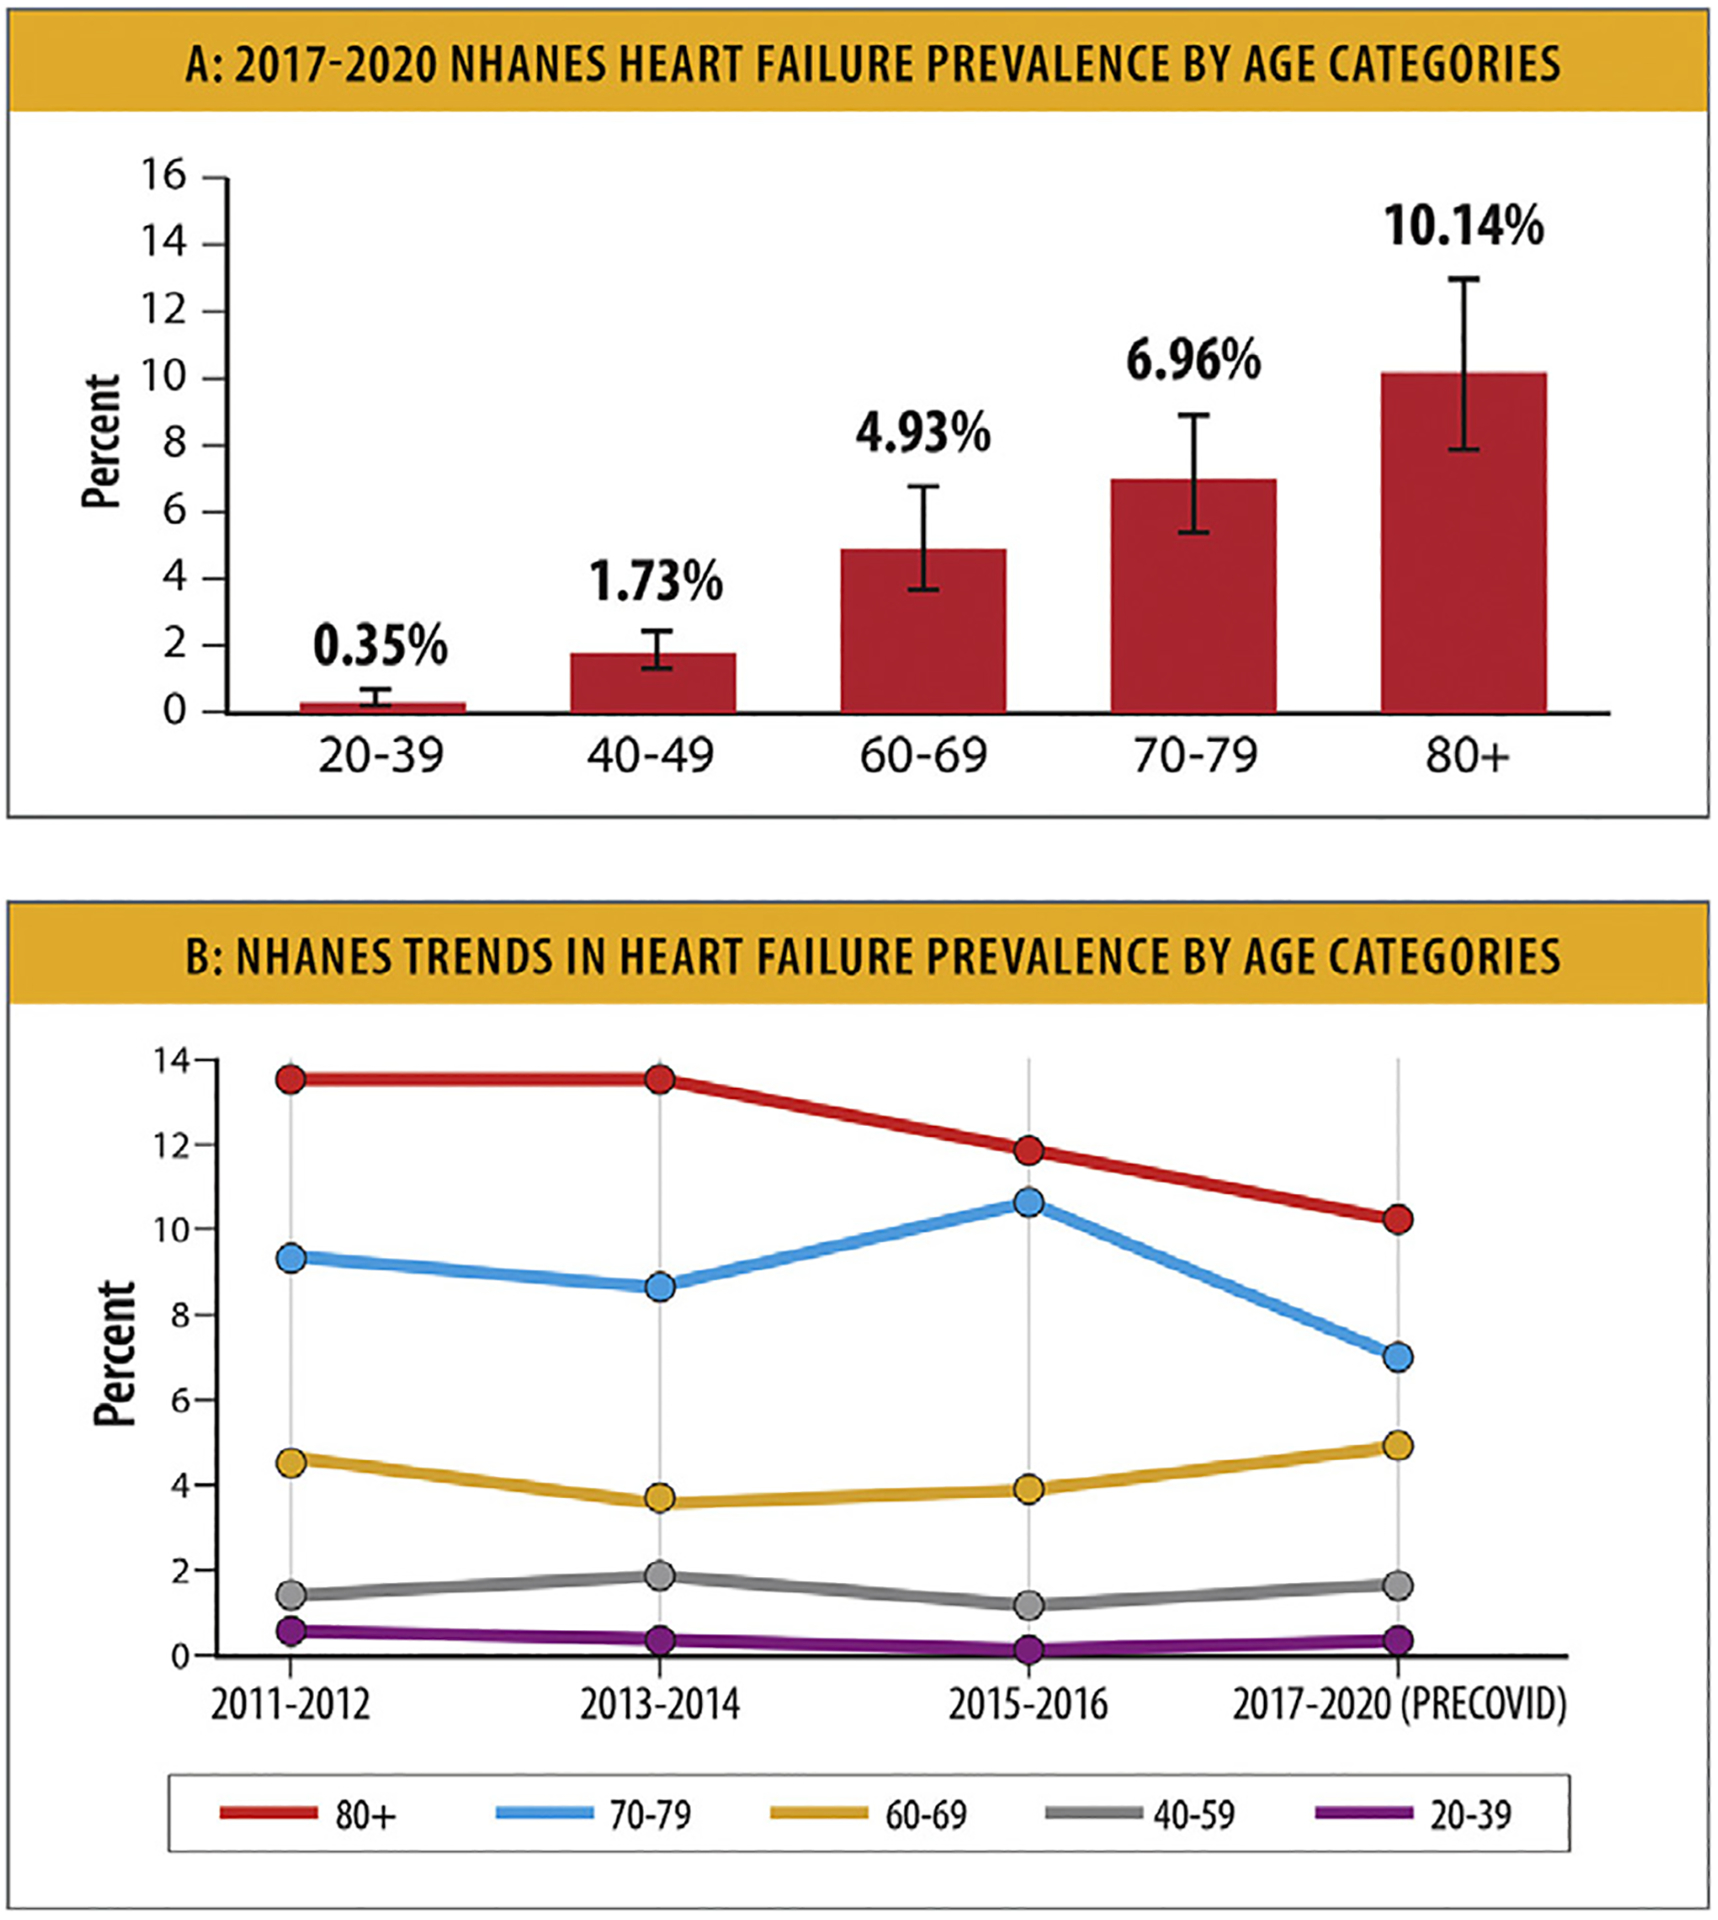
NHANES trends in heart failure prevalence. (A) 2017 to 2020 NHANES HF prevalence by age categories. (B) NHANES trends in HF prevalence by age categories. HF = heart failure; NHANES = National Health and Nutrition Examination Survey. Modified from Centers for Disease Control and Prevention National Center for Health Statistics. Centers for Disease Control and Prevention. 2023 [cited 2023 Feb 2]. National Health and Nutrition Examination Survey (NHANES) Public Use Data Files. Available from: https://www.cdc.gov/nchs/nhanes/index.htm
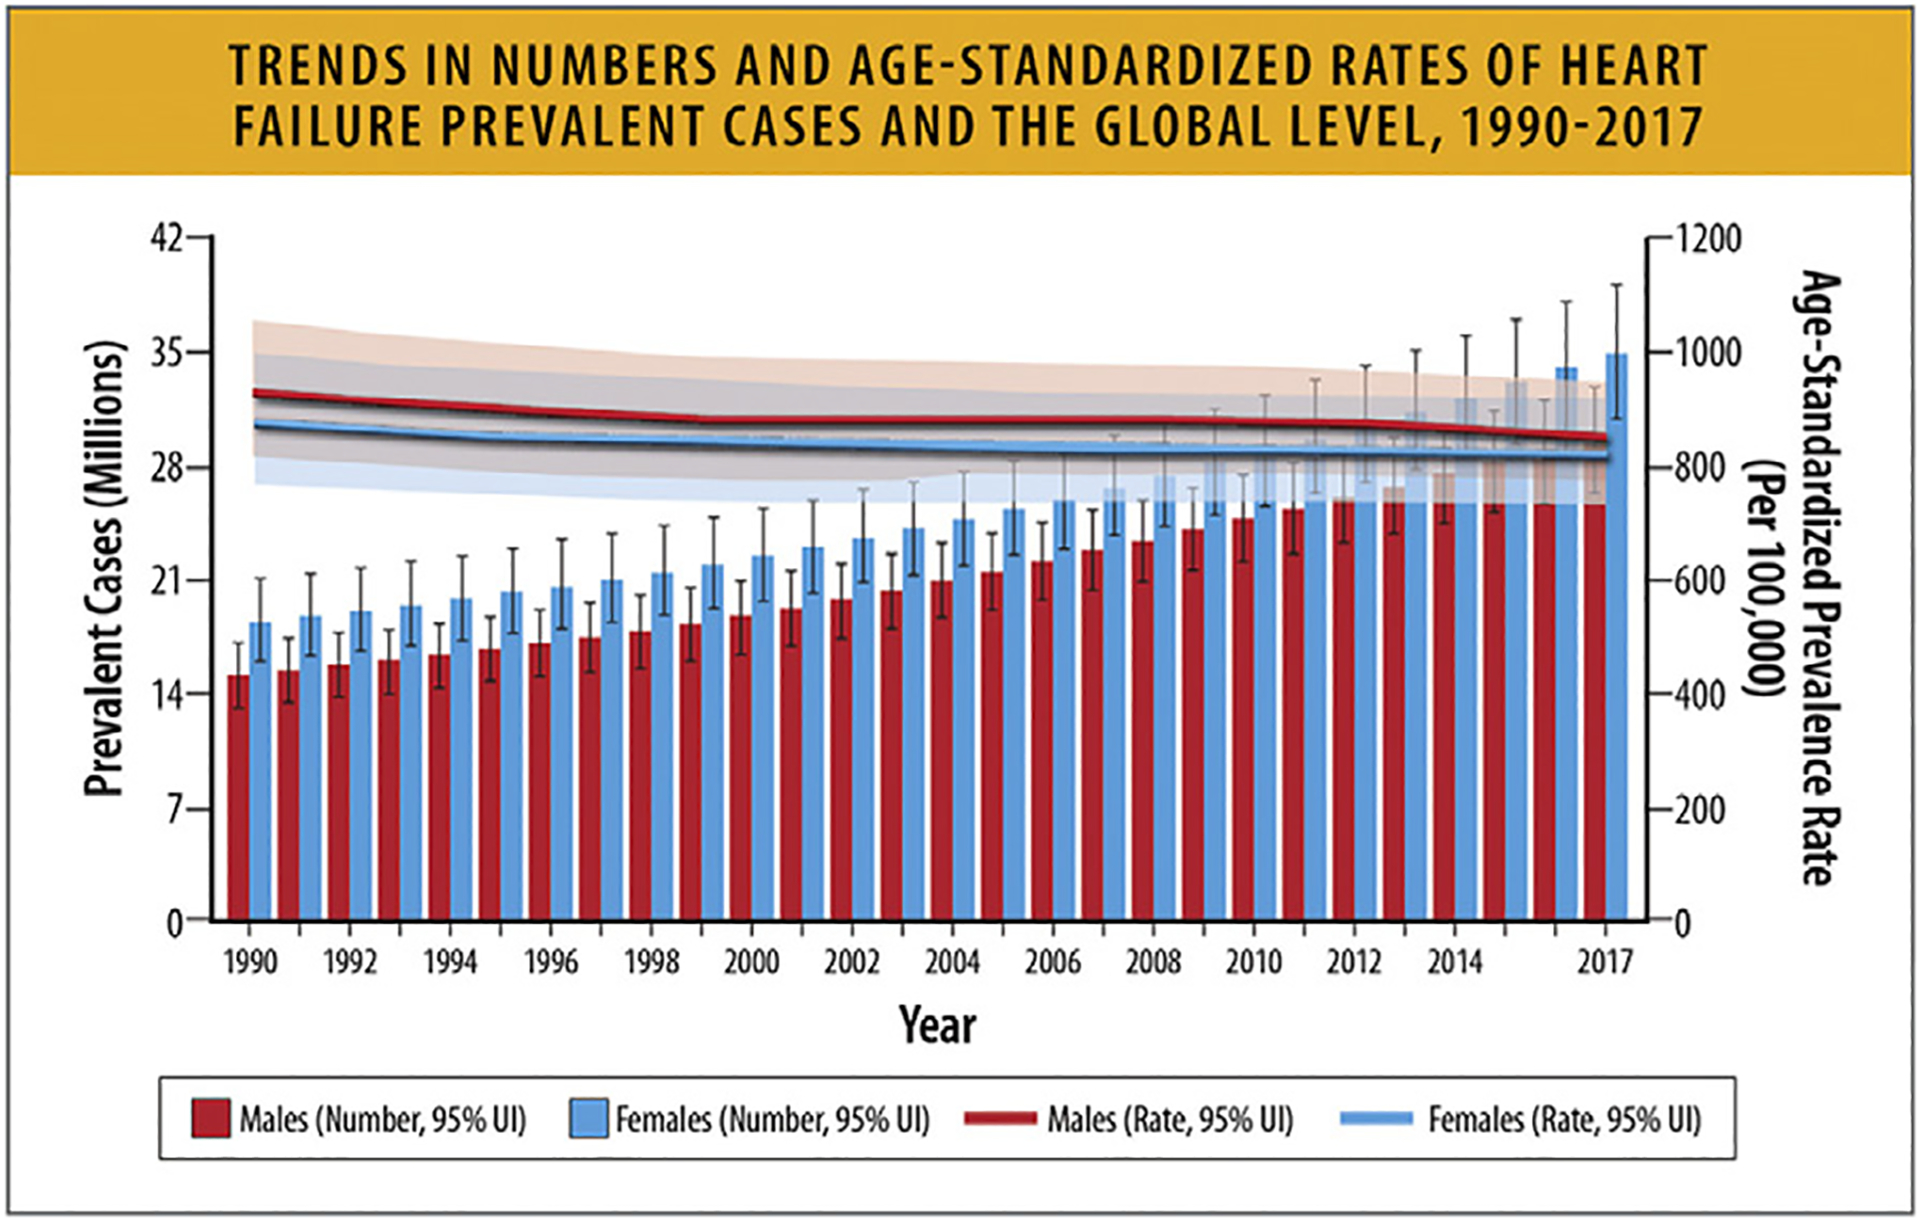
Trends in numbers and age-standardized rates of heart failure prevalent cases and the global level, 1990 to 2017. UI = uncertainty interval. Modified from Bragazzi NL, Zhong W, Shu J, Abu Much A, Lotan D, Grupper A, et al. Burden of heart failure and underlying causes in 195 countries and territories from 1990 to 2017. Eur J Prev Cardiol 2021;28:1682–90.
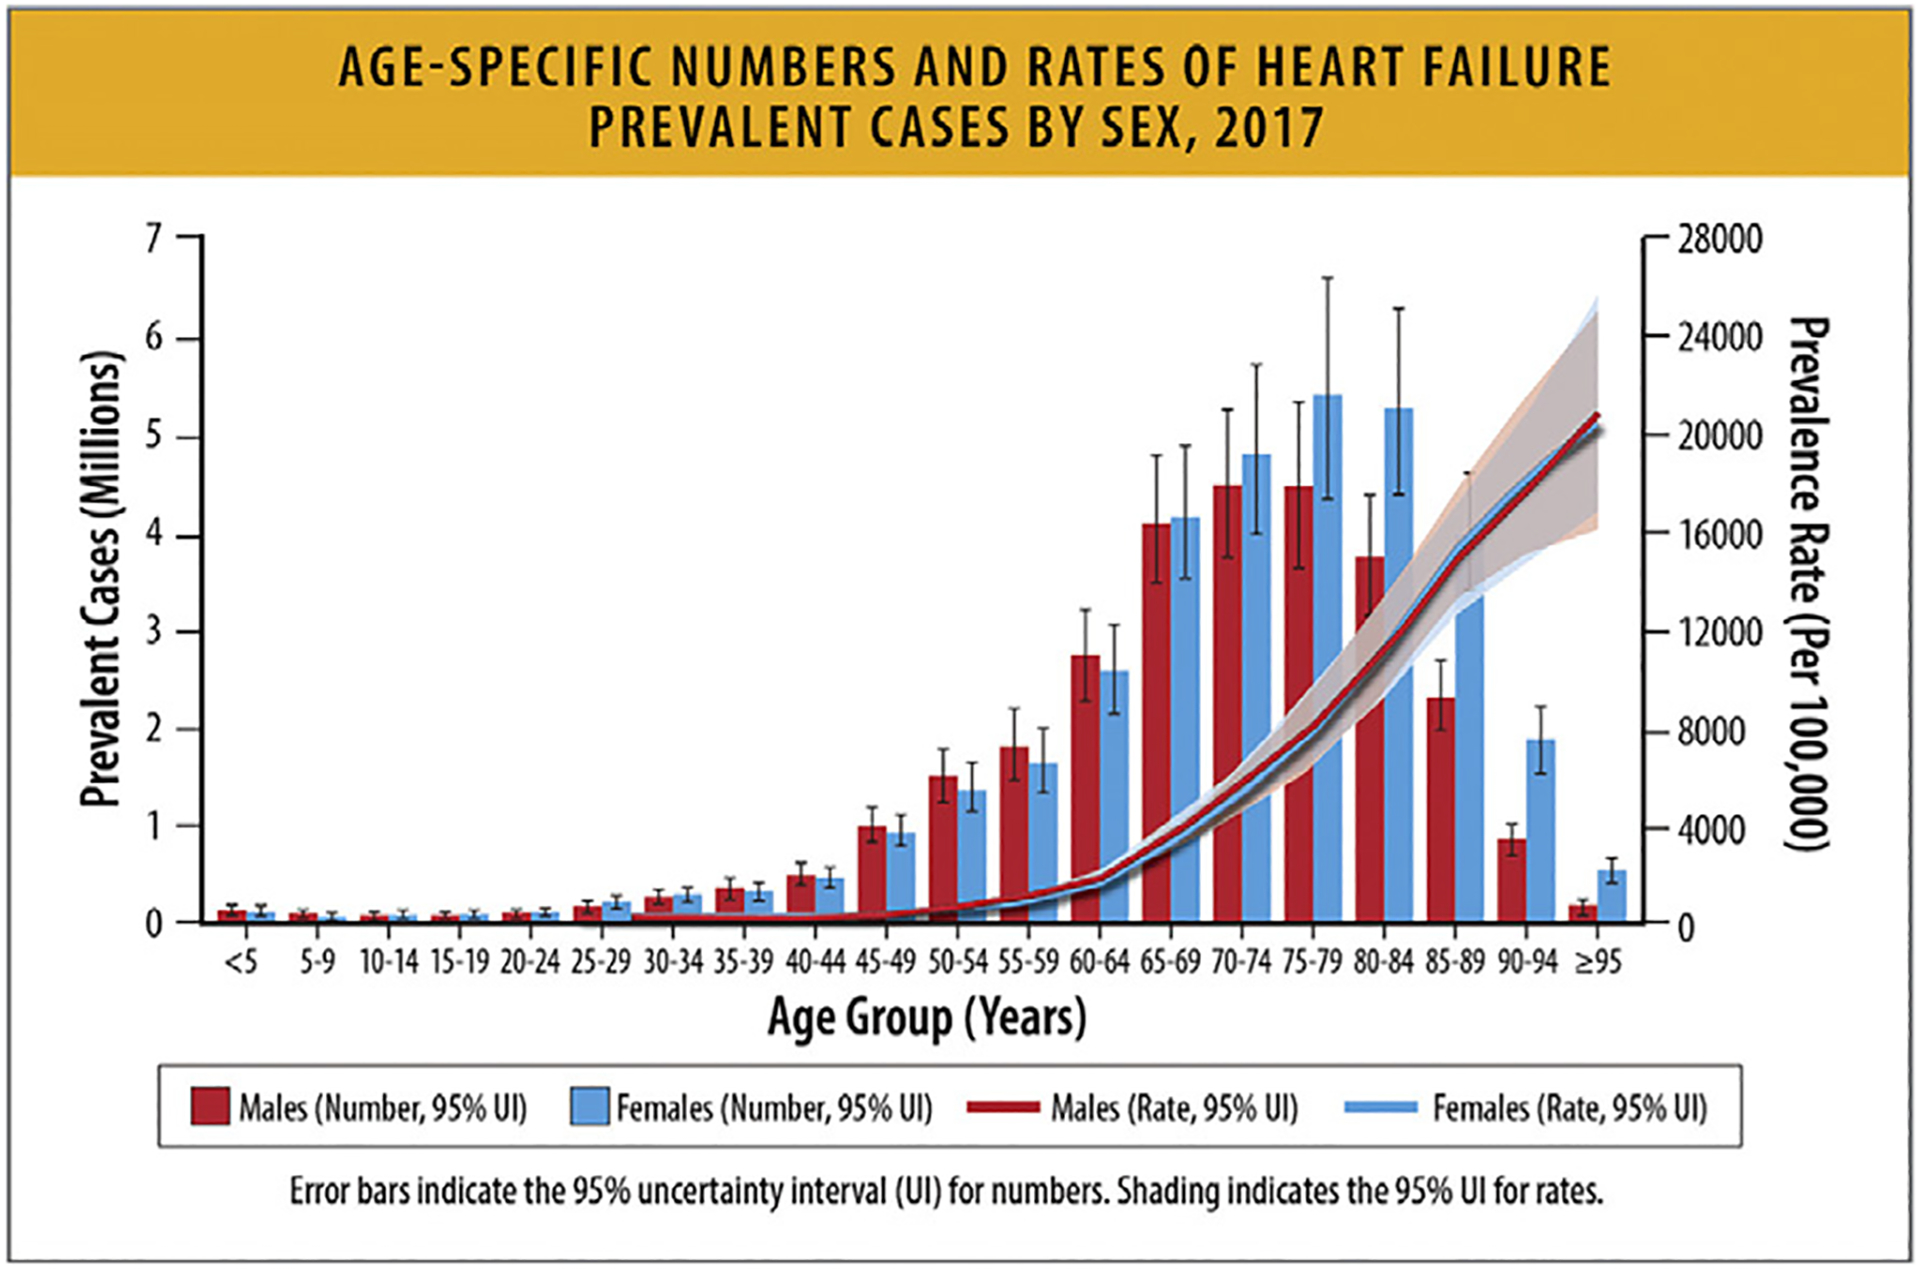
Age-specific numbers and rates of heart failure prevalent cases by sex, 2017. HF = heart failure; UI = uncertainty interval. Modified from Bragazzi NL, Zhong W, Shu J, Abu Much A, Lotan D, Grupper A, et al. Burden of heart failure and underlying causes in 195 countries and territories from 1990 to 2017. Eur J Prev Cardiol 2021;28:1682–90.
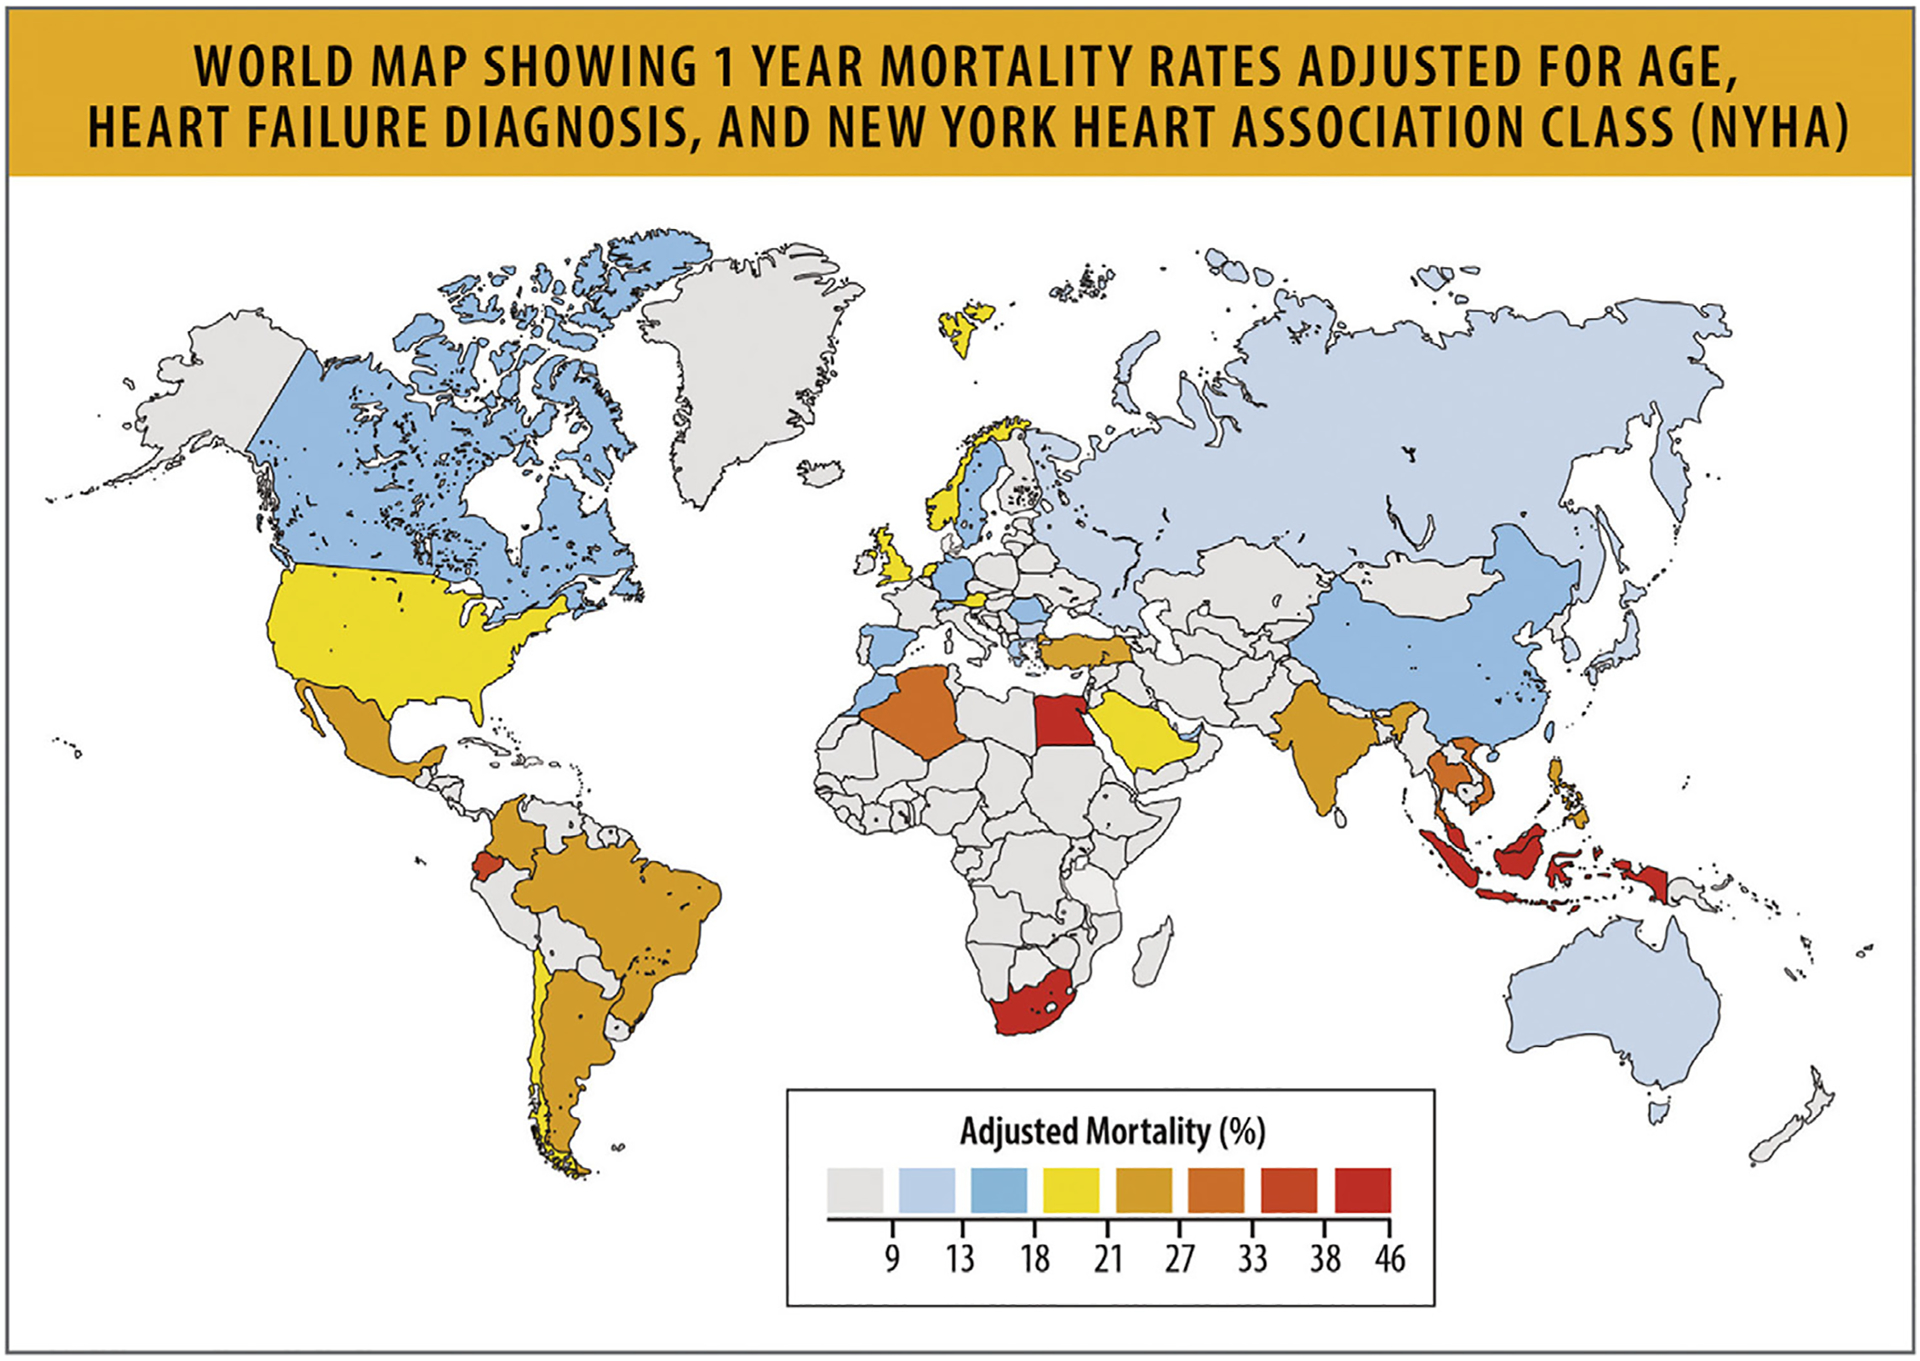
World map showing 1-year mortality rates adjusted for age, HF diagnosis, and NYH) functional class. HF = heart failure; NYHA = New York Heart Association; UI = uncertainty interval. Modified from Tromp J, Beusekamp JC, Ouwerkerk W, van der Meer P, Cleland JGF, Angermann CE, et al. Regional differences in precipitating factors of hospitalization for acute heart failure: insights from the REPORT-HF Registry. Eur J Heart Fail 2022;24:645–52.
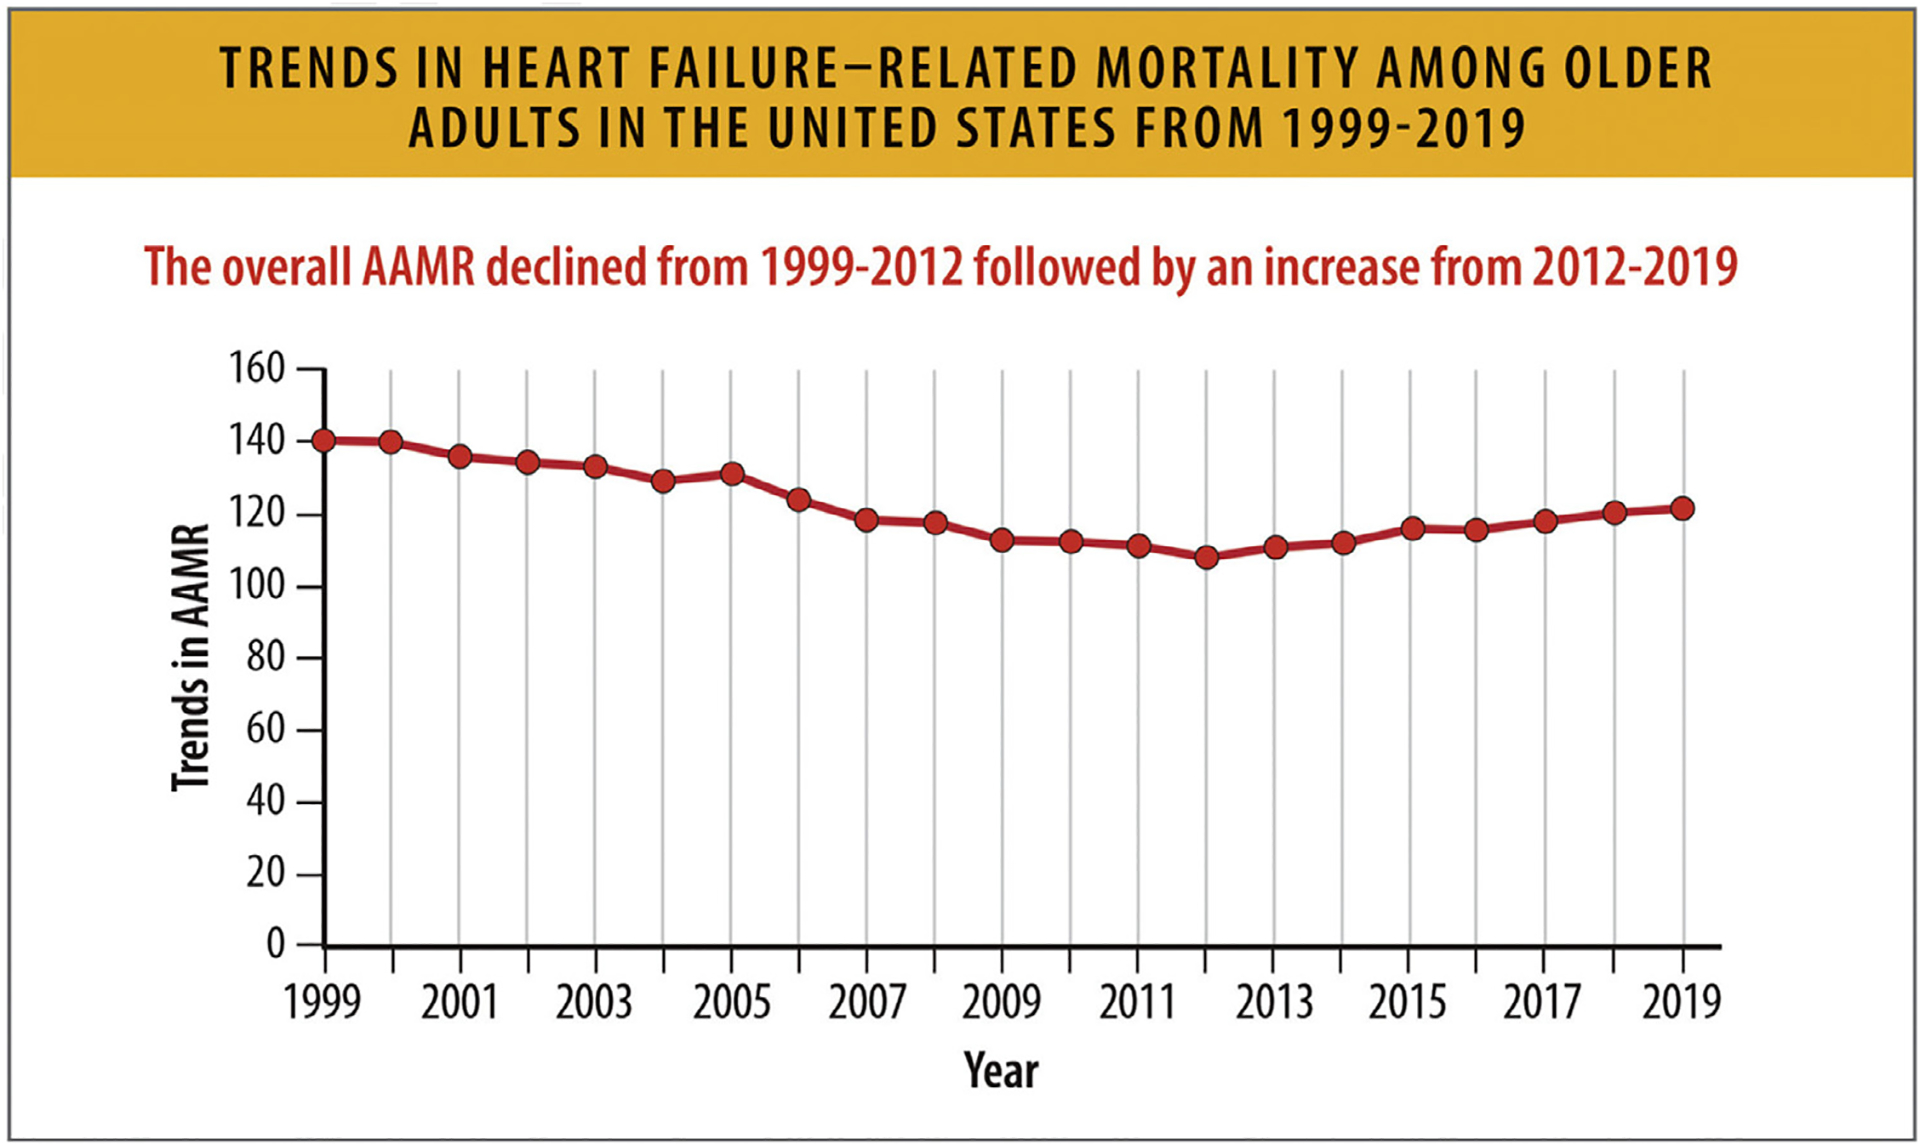
Trends in HF-related mortality among older adults in the United States from 1999 to 2019. AAMR = age-adjusted mortality rates, HF = heart failure; US = United States; UI = uncertainty interval. Modified from Siddiqi TJ, Khan Minhas AM, Greene SJ, Van Spall HGC, Khan SS, Pandey A, et al. Trends in heart failure-related mortality among older adults in the United States From 1999–2019. JACC Heart Fail 2022;10:851–9.
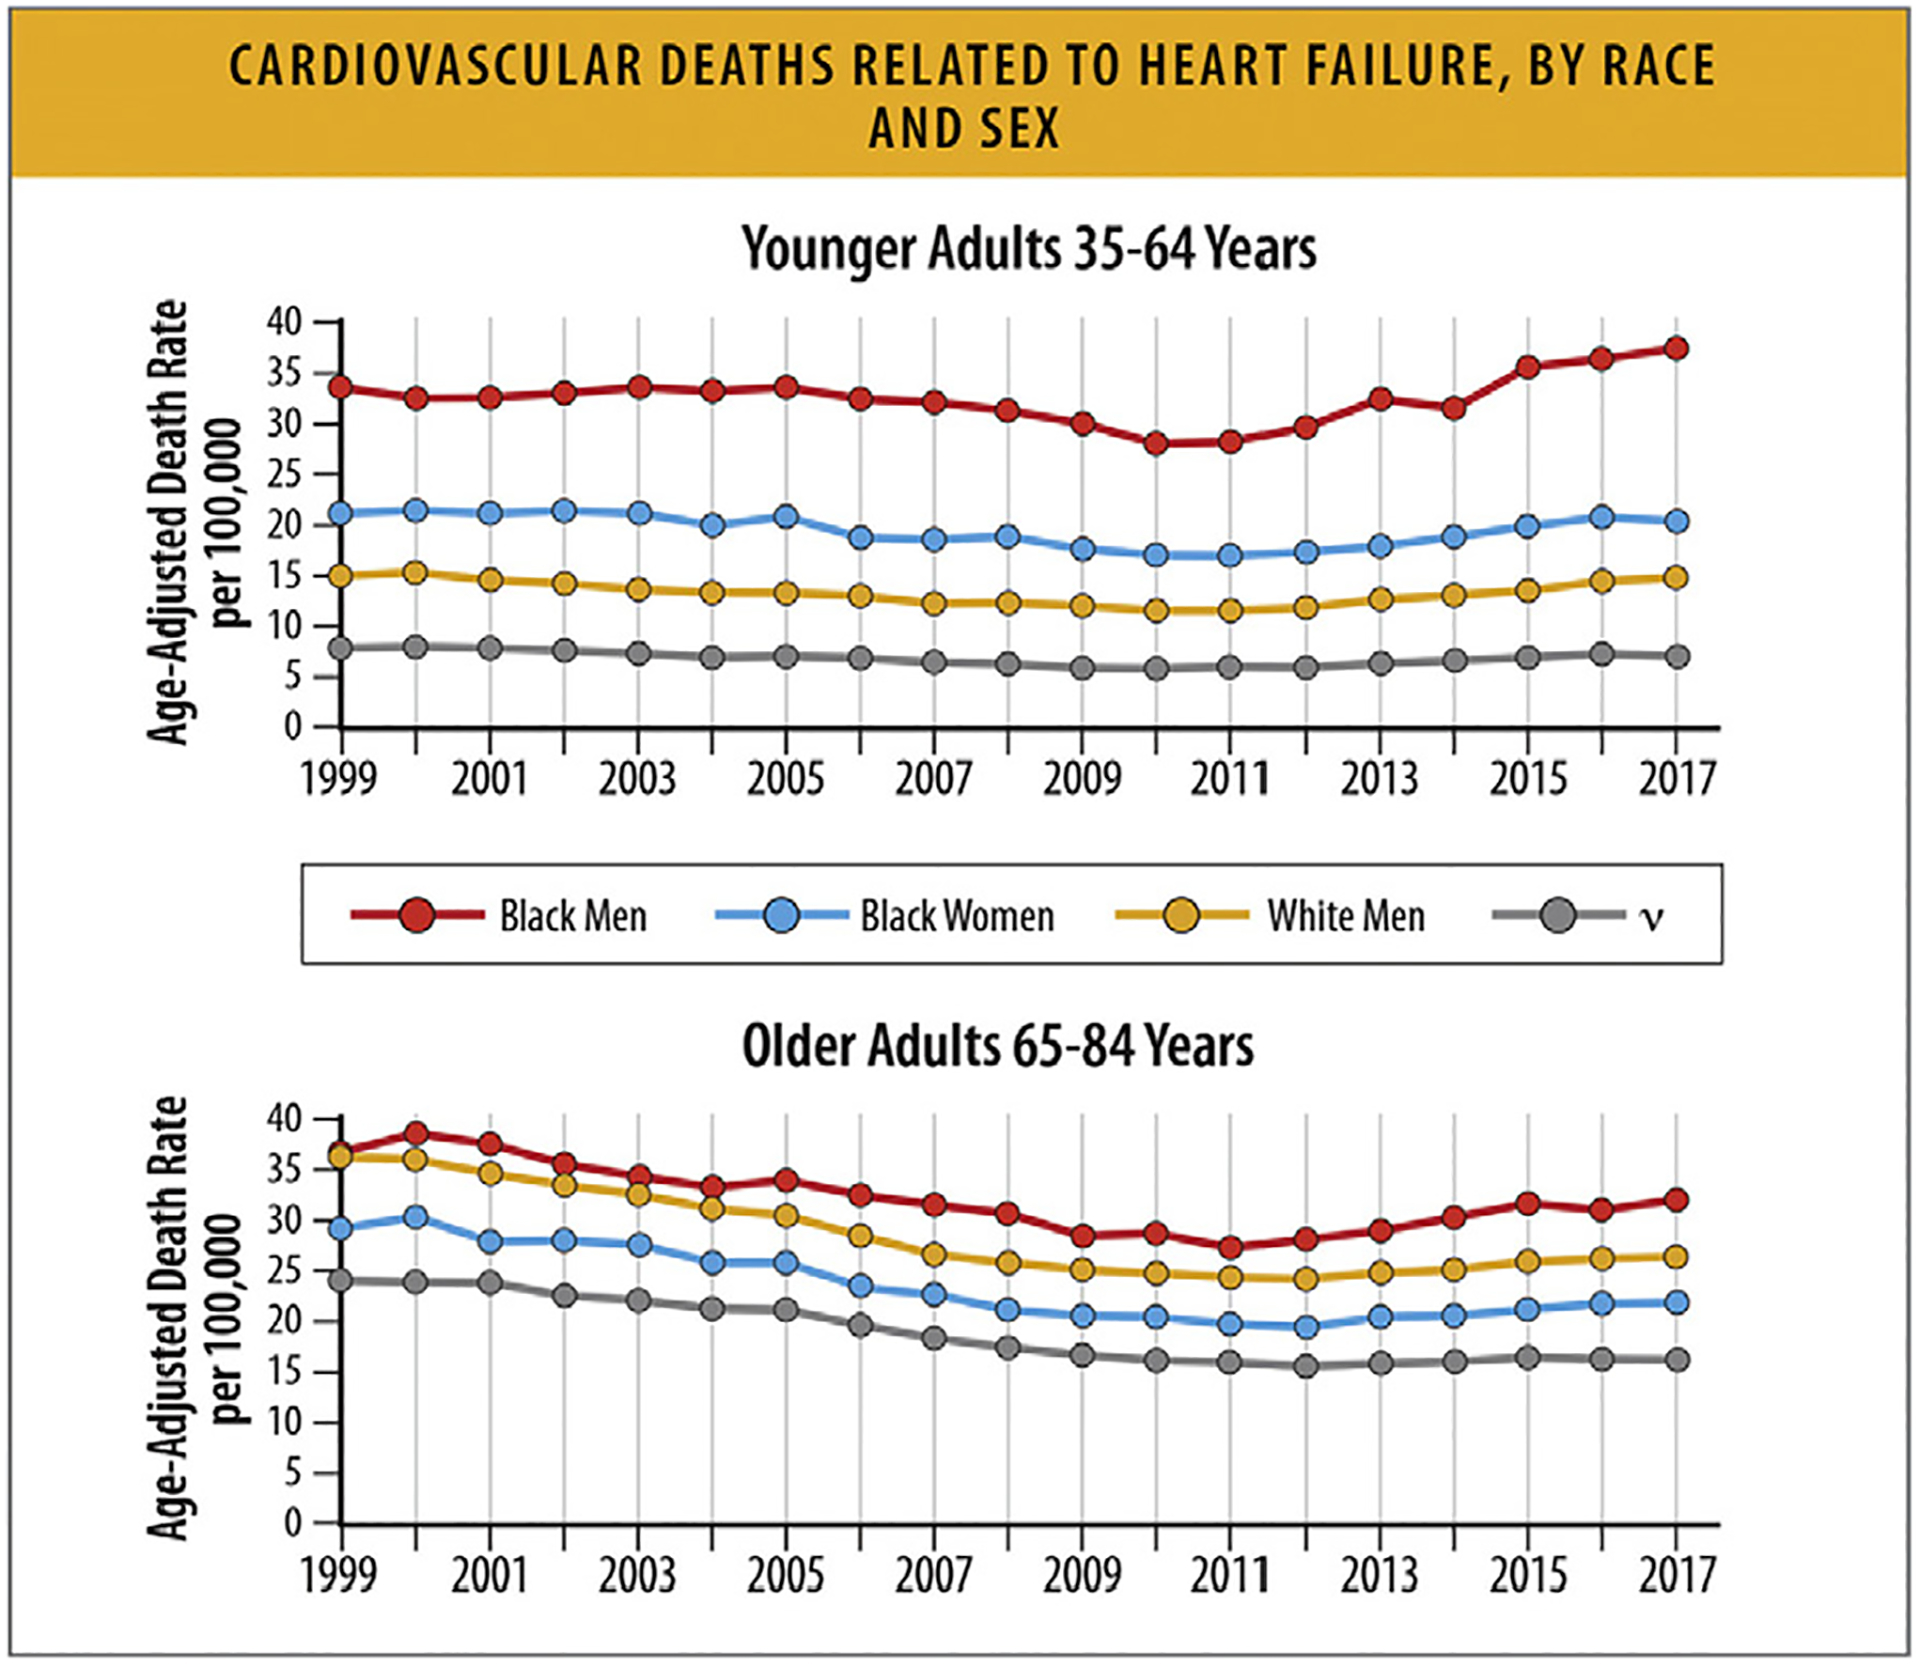
Cardiovascular deaths related to HF, by race and sex. HF = heart failure. Modified from Glynn P, Lloyd-Jones DM, Feinstein MJ, Carnethon M, Khan SS. Disparities in cardiovascular mortality related to heart failure in the United States. J Am Coll Cardiol 2019;73:2354–5; and Tromp J, Beusekamp JC, Ouwerkerk W, van der[C0]Meer P, Cleland JGF, Angermann CE, et al. Regional differences in precipitating factors of hospitalization for acute heart failure: insights From the REPORT-HF Registry. Eur J Heart Fail 2022;24:645–52.
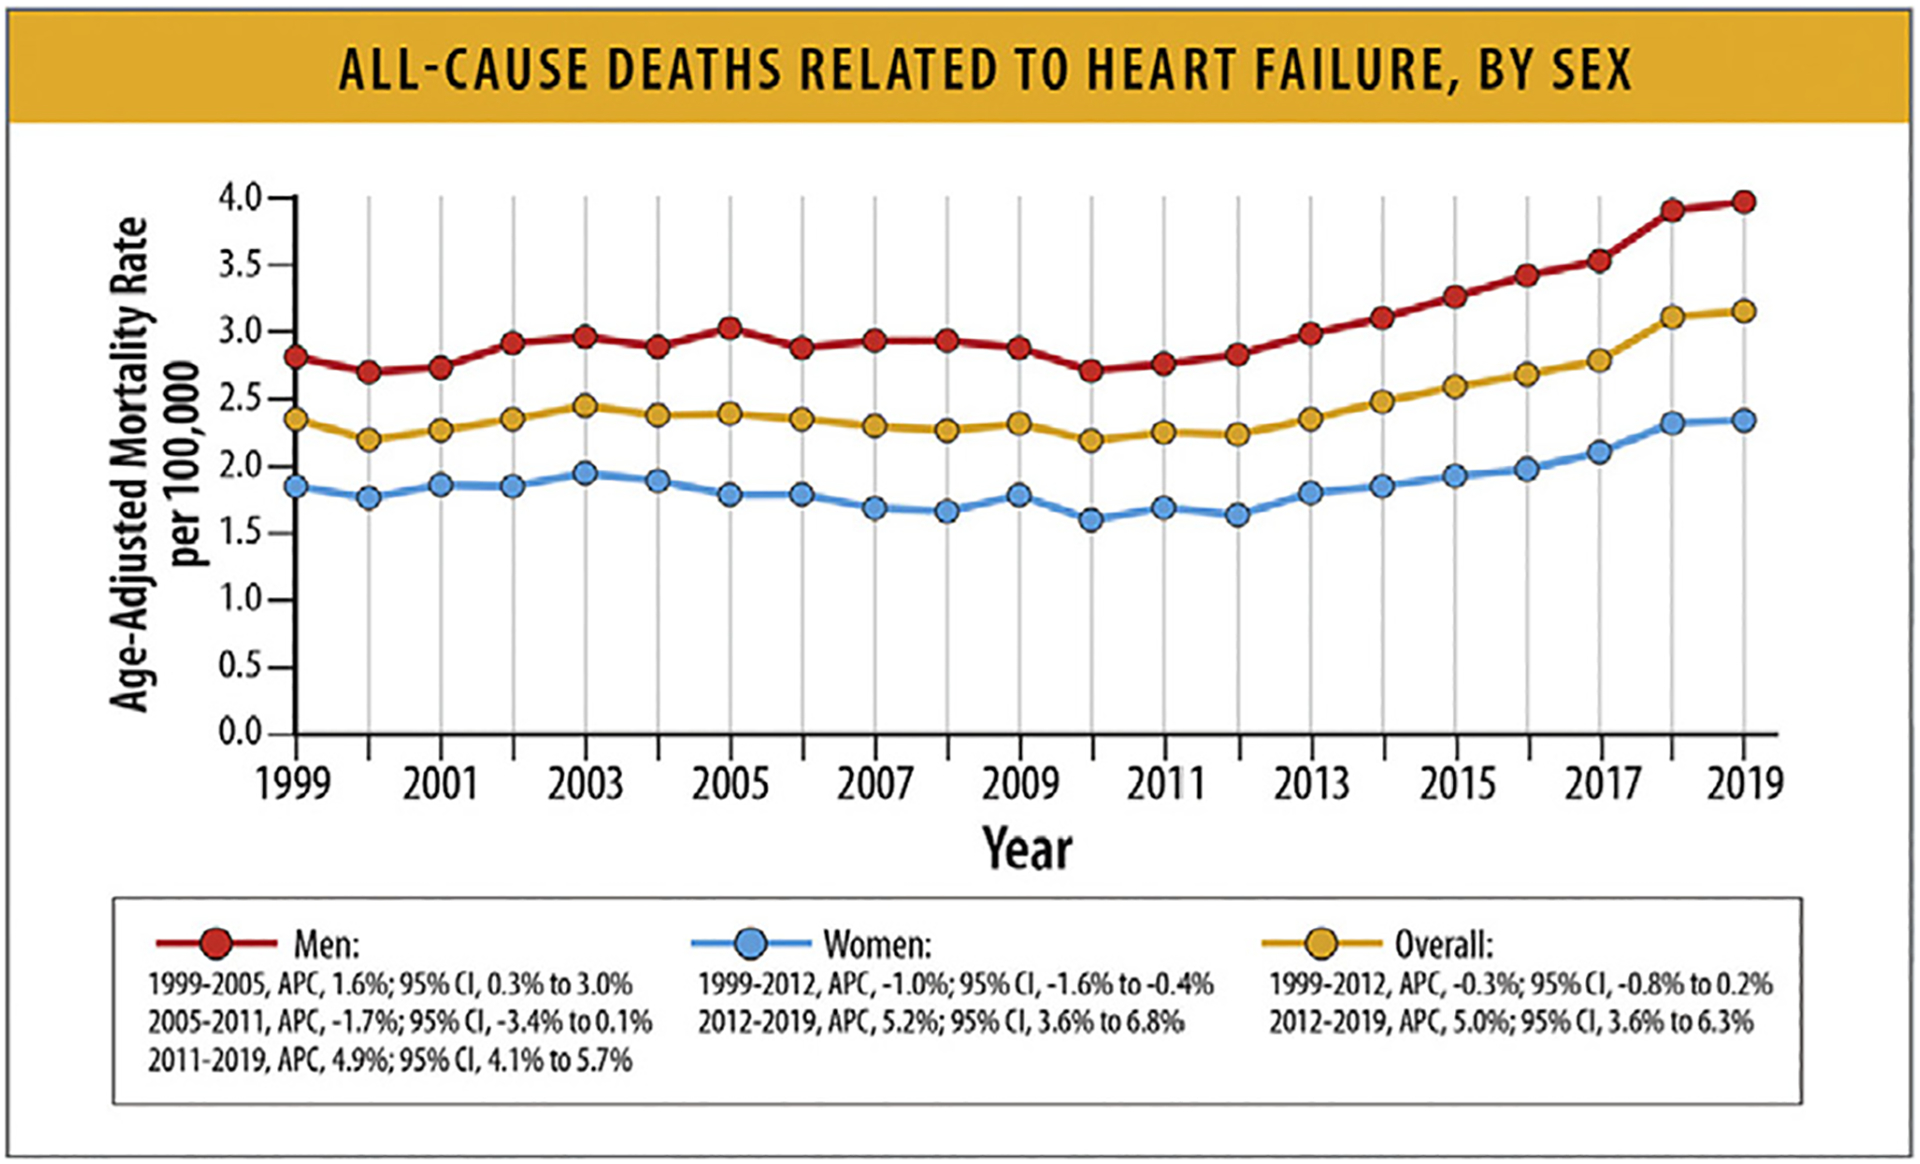
All-cause deaths related to HF, by sex. APC = annual percentage change; CI = confidence interval; HF = heart failure. Modified from Glynn P, Lloyd-Jones DM, Feinstein MJ, Carnethon M, Khan SS. Disparities in cardiovascular mortality related to heart failure in the United States. J Am Coll Cardiol 2019;73:2354–5; and Tromp J, Beusekamp JC, Ouwerkerk W, van der Meer P, Cleland JGF, Angermann CE, et al. Regional differences in precipitating factors of hospitalization for acute heart failure: insights from the REPORT-HF Registry. Eur J Heart Fail 2022;24:645–52.
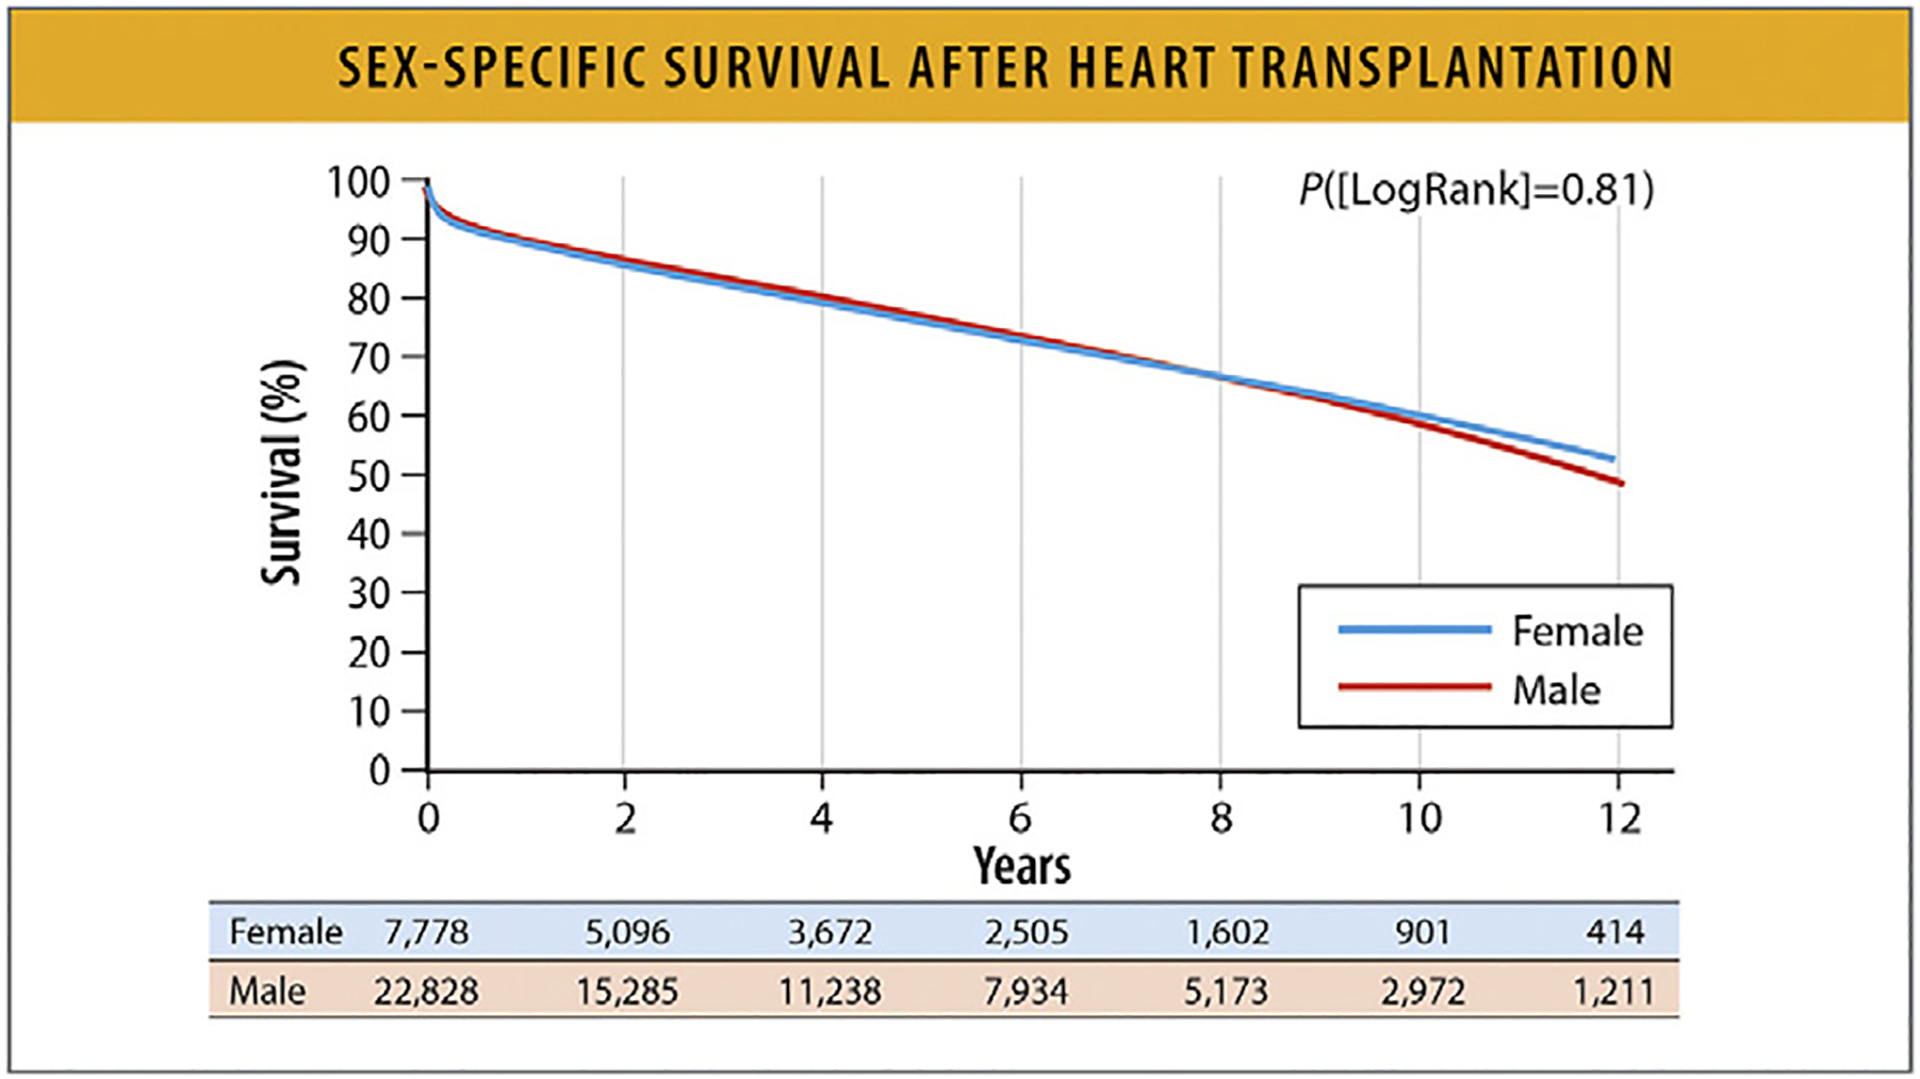
Sex-specific survival after heart transplantation. Modified from Hsich EM, Blackstone EH, Thuita LW, McNamara DM, Rogers JG, Yancy CW, et al. Heart transplantation: an in-depth survival analysis. JACC Heart Fail 2020;8:557–68.
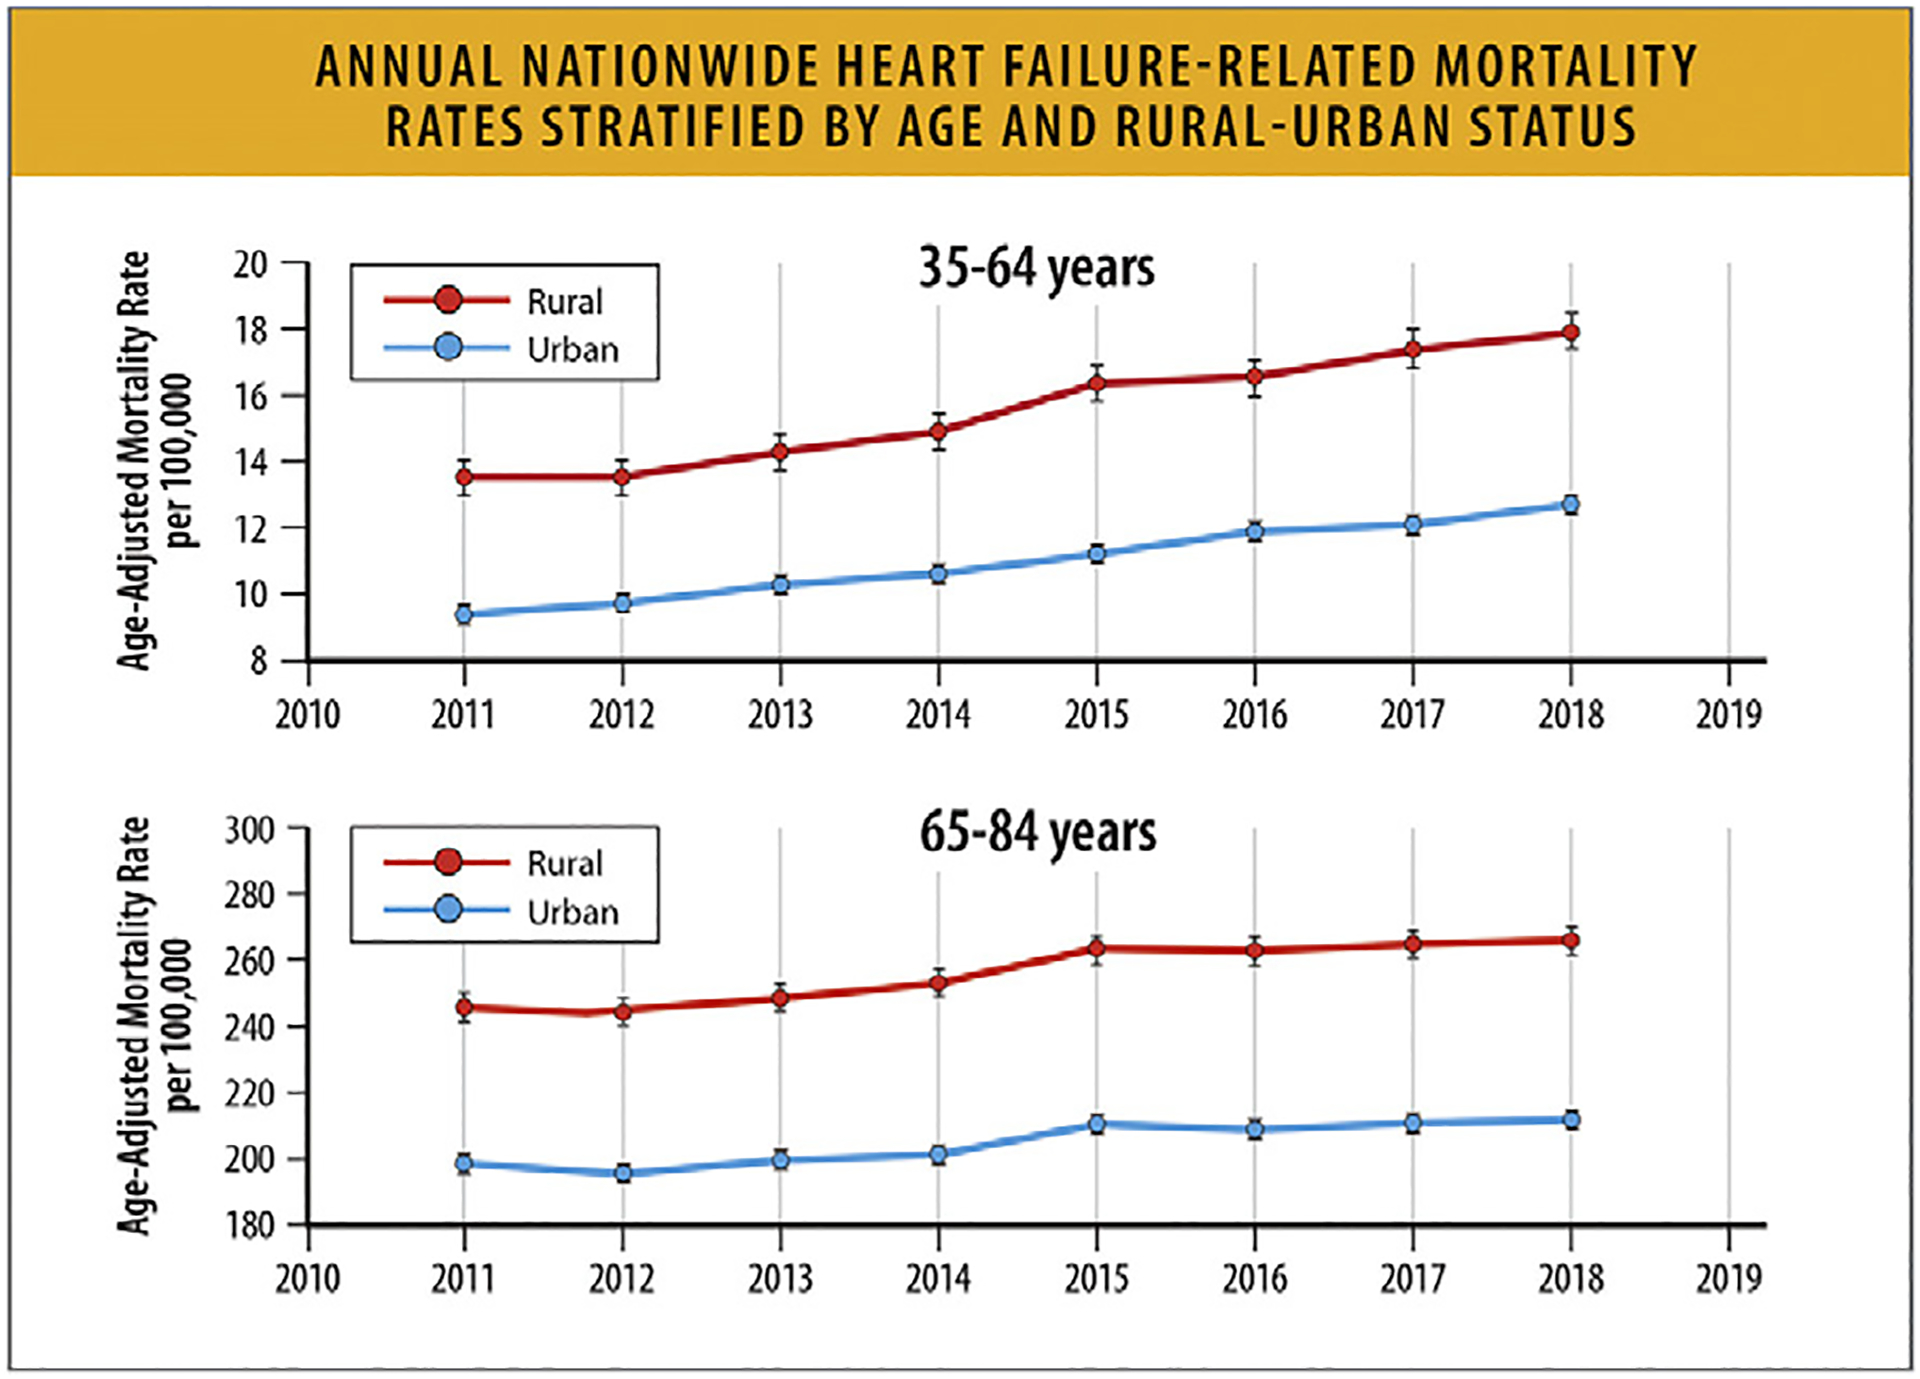
Annual nationwide HF-related mortality rates stratified by age and rural–urban status, CDC WONDER 2011–2018. CDC = Centers for Disease Control and Prevention; HF = heart failure; WONDER = Wide-ranging Online Data for Epidemiologic Research. Modified from Pierce JB, Shah NS, Petito LC, Pool L, Lloyd-Jones DM, Feinglass J, et al. Trends in heart failure-related cardiovascular mortality in rural versus urban United States counties, 2011–2018: a cross-sectional study. PLoS One 2021;16:e0246813.
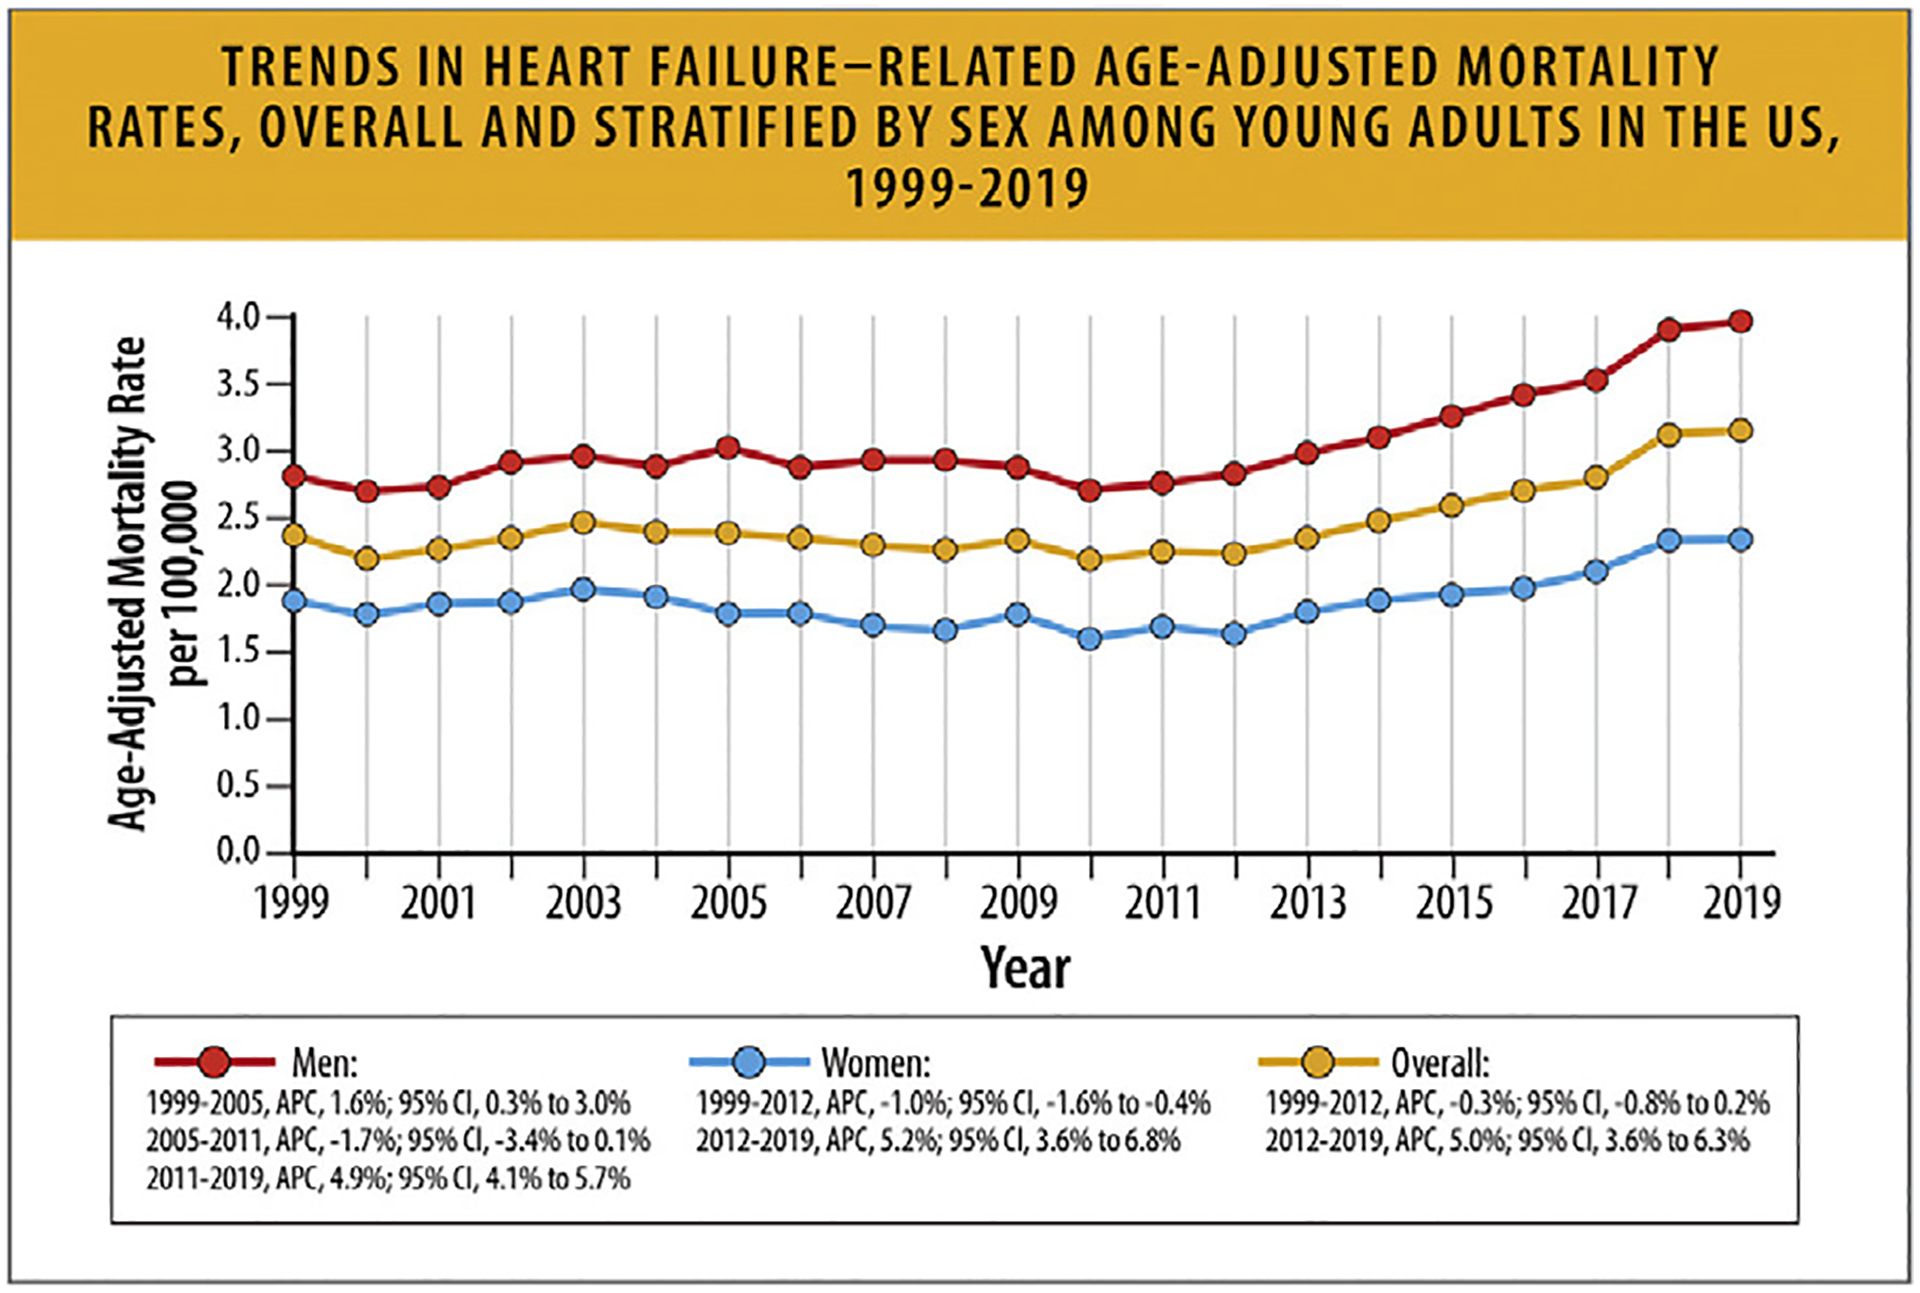
Trends in HF-related age-adjusted mortality rates, overall and stratified by sex among young adults in the United States, 1999 to 2019. APC = annual percentage change; CI = confidence interval; HF = heart failure; US = United States. Modified from Jain V, Minhas AMK, Morris AA, Greene SJ, Pandey A, Khan SS, et al. Demographic and regional trends of heart failure-related mortality in young adults in the United States, 1999–2019. JAMA Cardiol 2022;7:900–4.
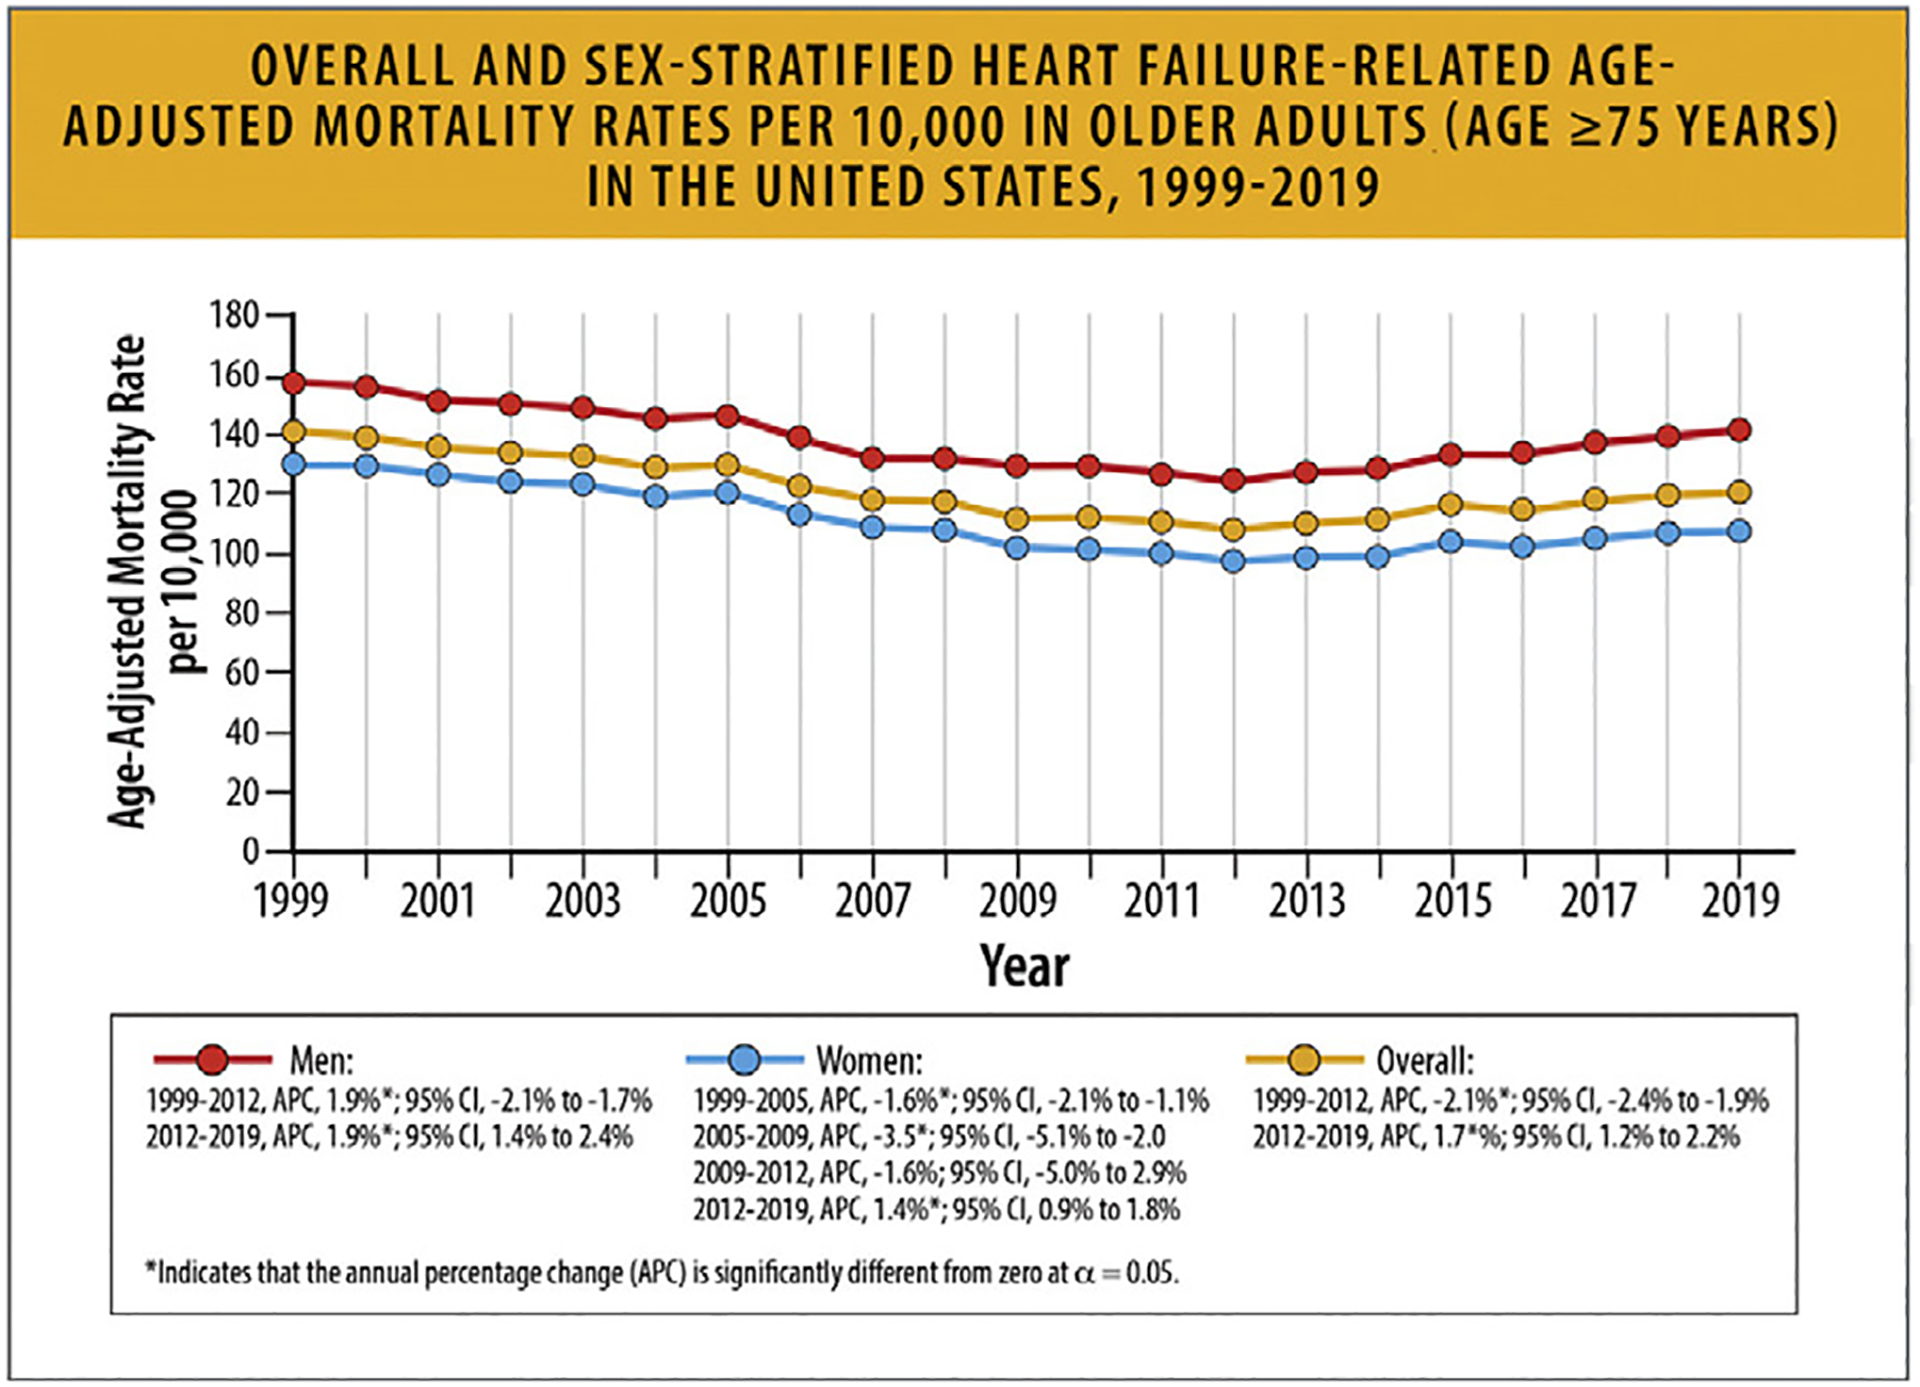
Overall and sex-stratified hf-related age-adjusted mortality rates per 10,000 in older adults (age ≥ 75 years) in the United States, 1999–2019. HF = heart failure; US = United States. Modified from TJ, Khan Minhas AM, Greene SJ, Van Spall HGC, Khan SS, Pandey A, et al. Trends in heart failure-related mortality among older adults in the United States from 1999–2019. JACC Heart Fail 2022;10:851–9.
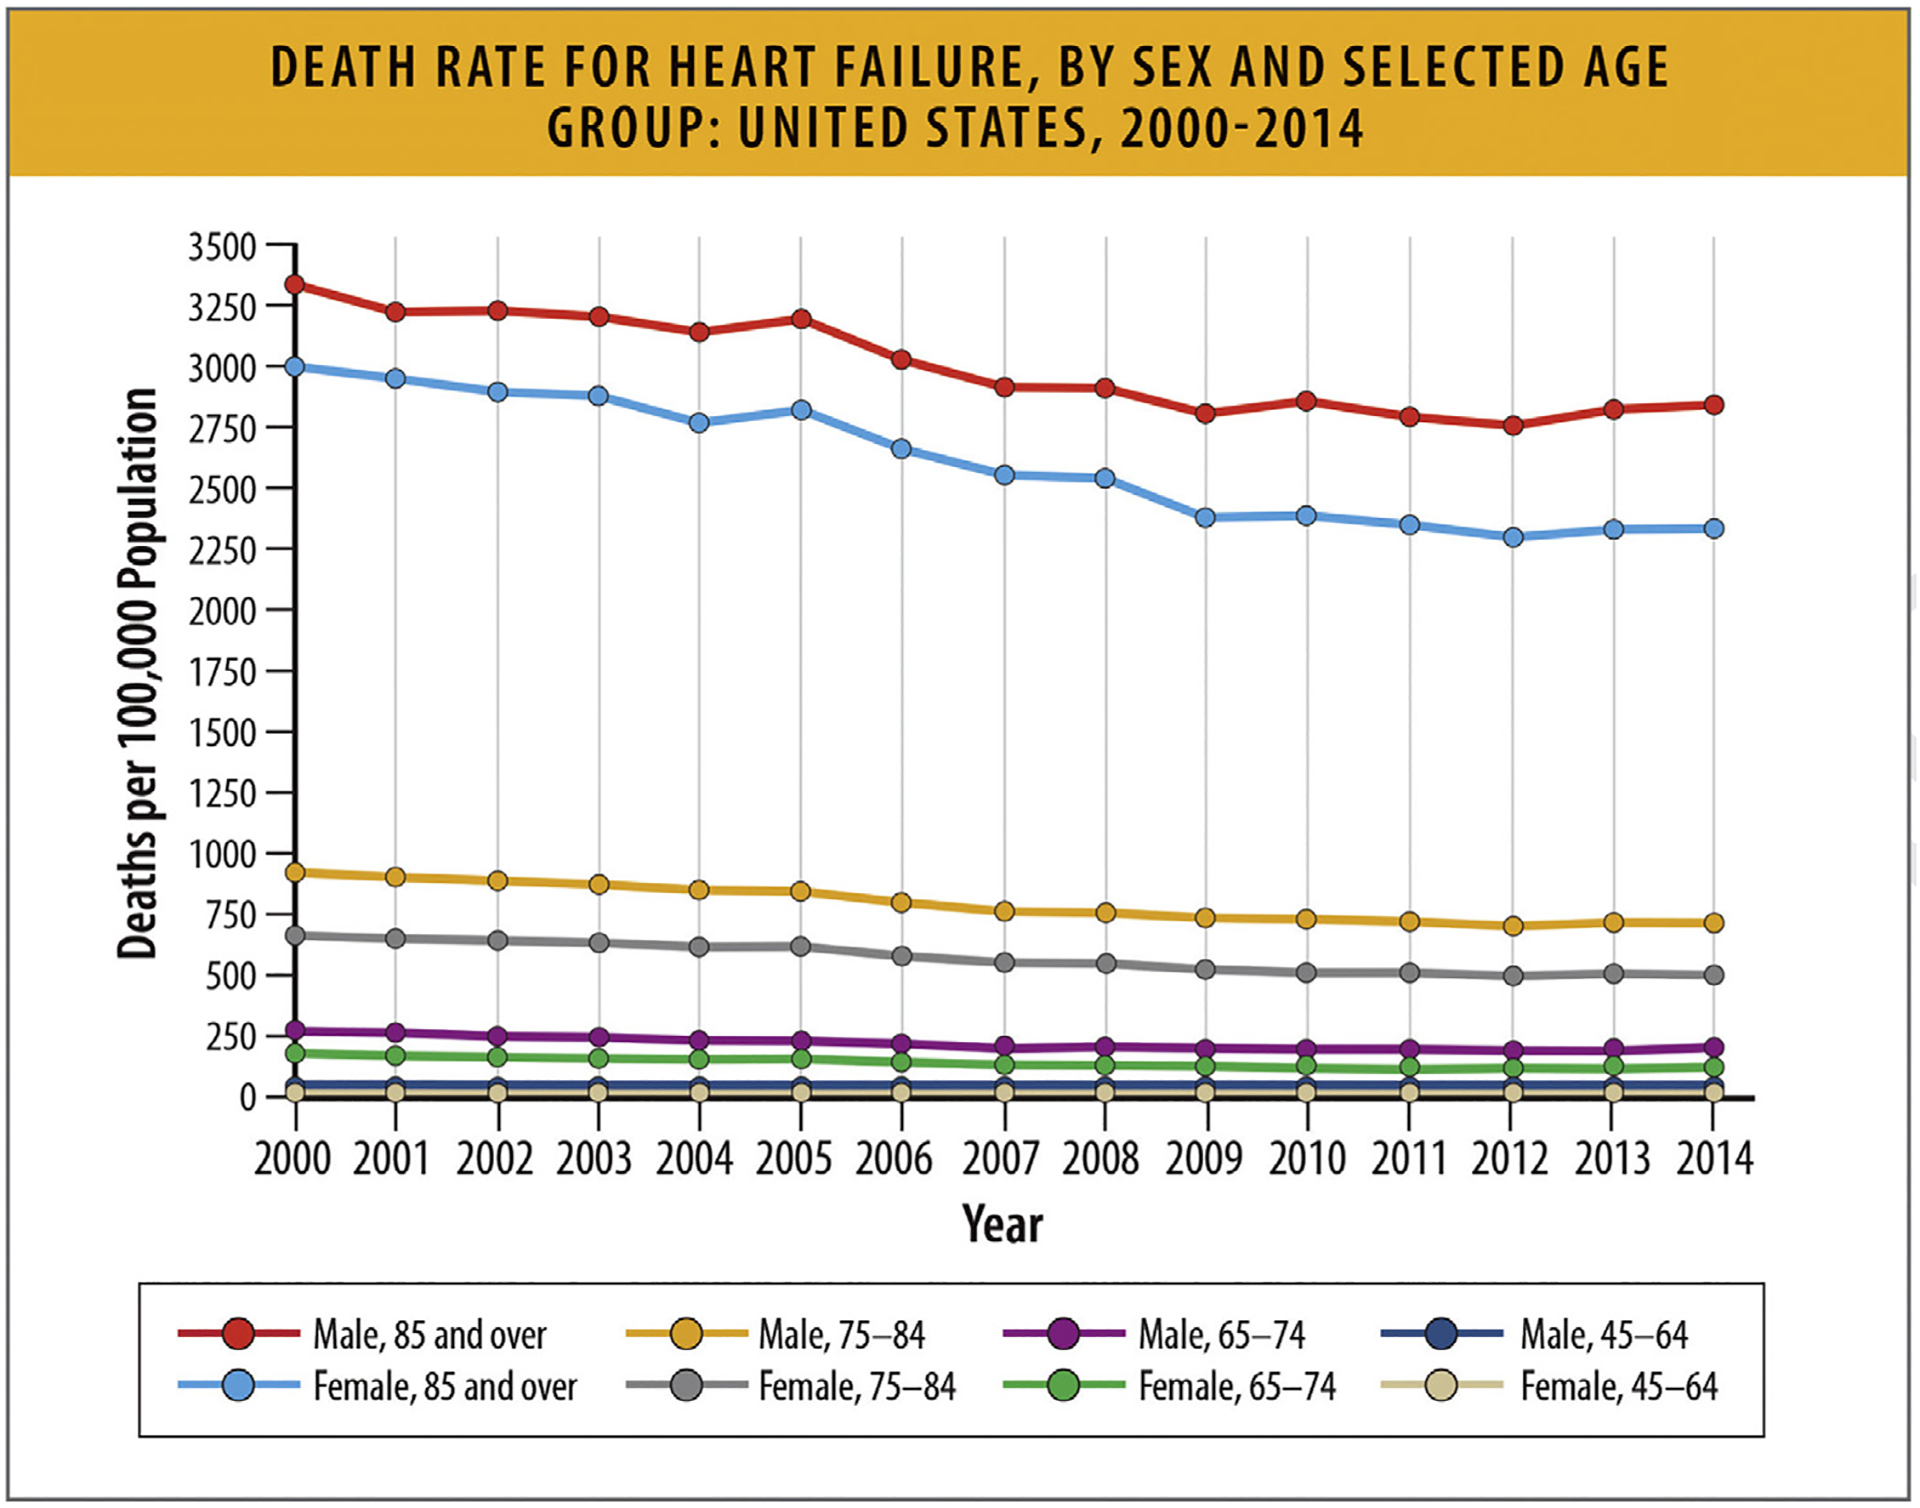
Death rate for HF, by sex and selected age group: United States, 2000–2014. HF = heart failure. From Ni H, Xu J. Recent trends in heart failure-related mortality: United States, 2000–2014. NCHS Data Brief 2015;231:1–8.
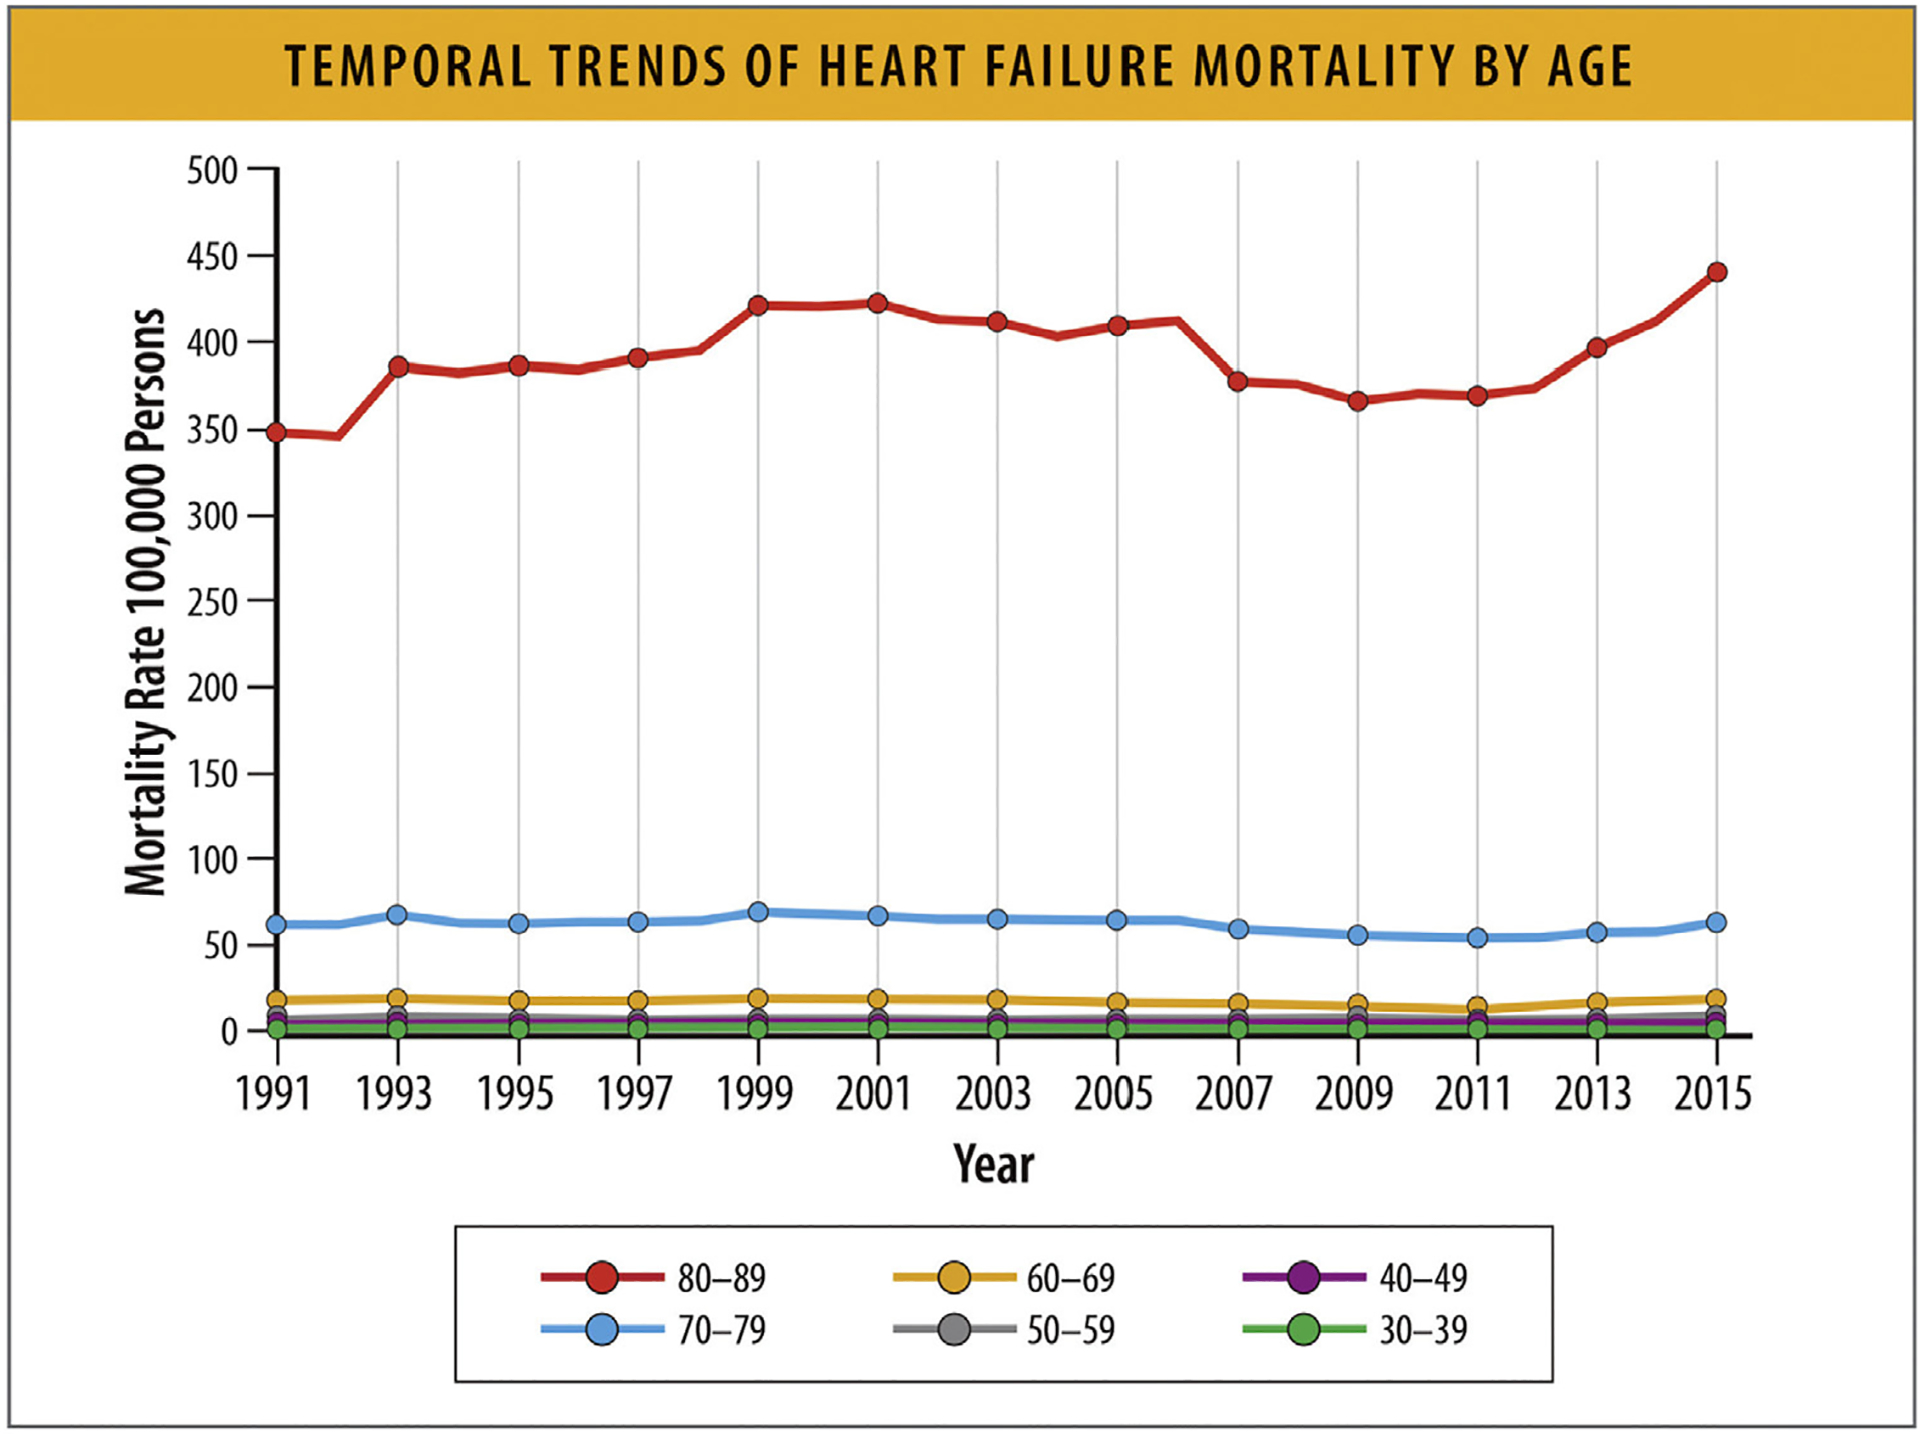
Temporal trends for HF mortality by age. HF = heart failure. Modified from Vasan RS, Zuo Y, Kalesan B. Divergent temporal trends in morbidity and mortality related to heart failure and atrial fibrillation: age, sex, race, and geographic differences in the United States, 1991–2015. J Am Heart Assoc 2019;8:e010756.
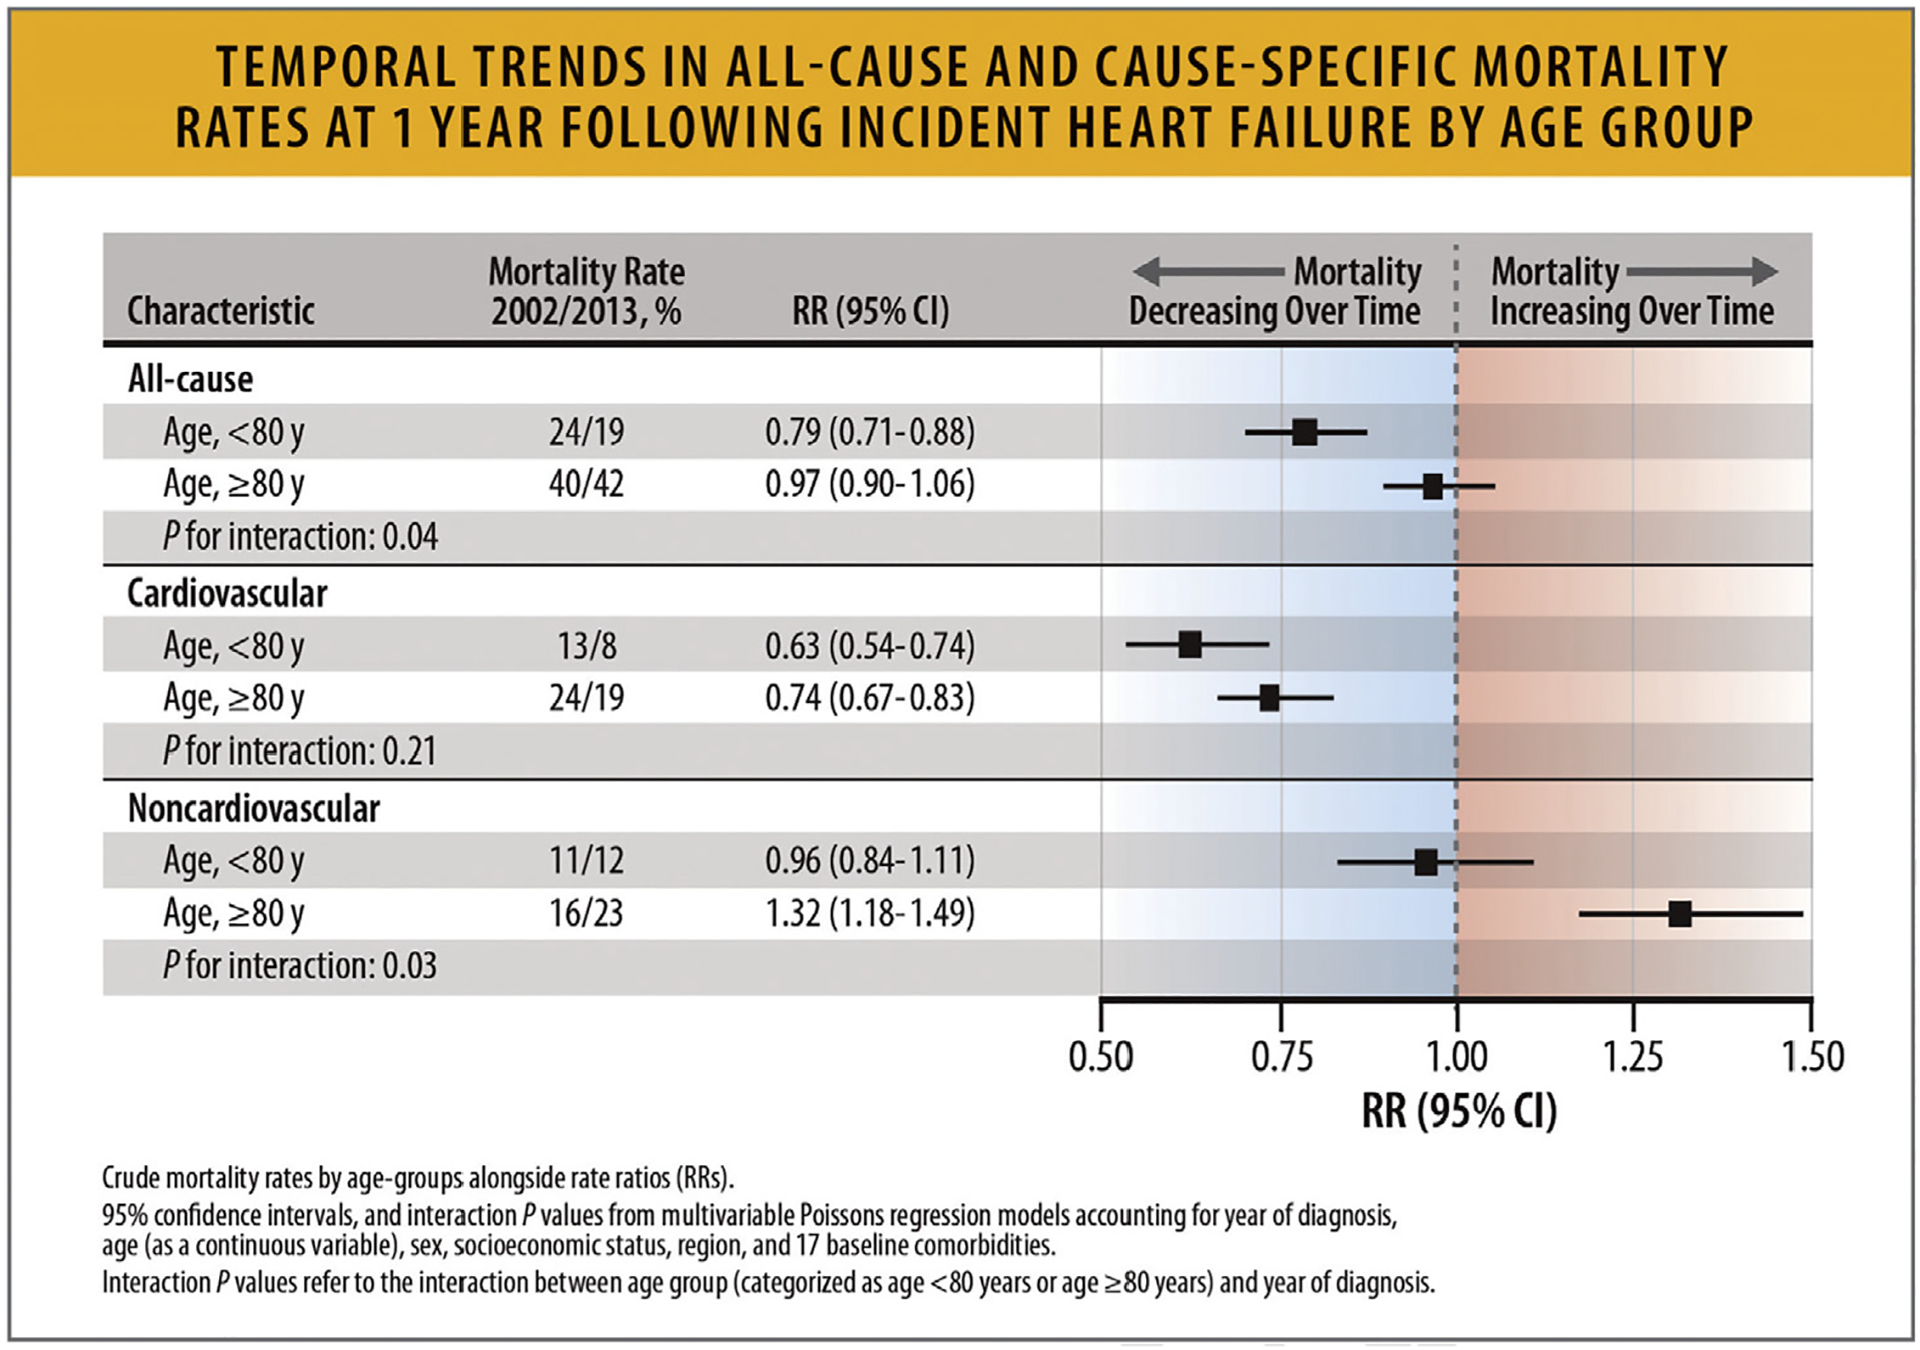
Temporal trends in all-cause and cause-specific mortality rates at 1 year following incident heart failure by age group. CI = confidence interval; HF = heart failure; RR = rate ratio./ Modified from Conrad N, Judge A, Tran J, Mohseni H, Hedgecott D, Crespillo AP, et al. Temporal trends and patterns in heart failure incidence: a population-based study of 4 million individuals. Lancet 2018;391(10120):572–80.

Kaplan–Meier curves for hospitalization for heart failure in 9134 heart failure patients. EF = ejection fraction; GWTG = Get With the Guidelines Registry; HF = heart failure. Modified from Chioncel O, Lainscak M, Seferovic PM, et al. Epidemiology and one-year outcomes in patients with chronic heart failure and preserved, mid-range and reduced ejection fraction: an analysis of the ESC Heart Failure Long-Term Registry. Eur J Heart Fail. 2017 Dec;19(12):1574–1585.
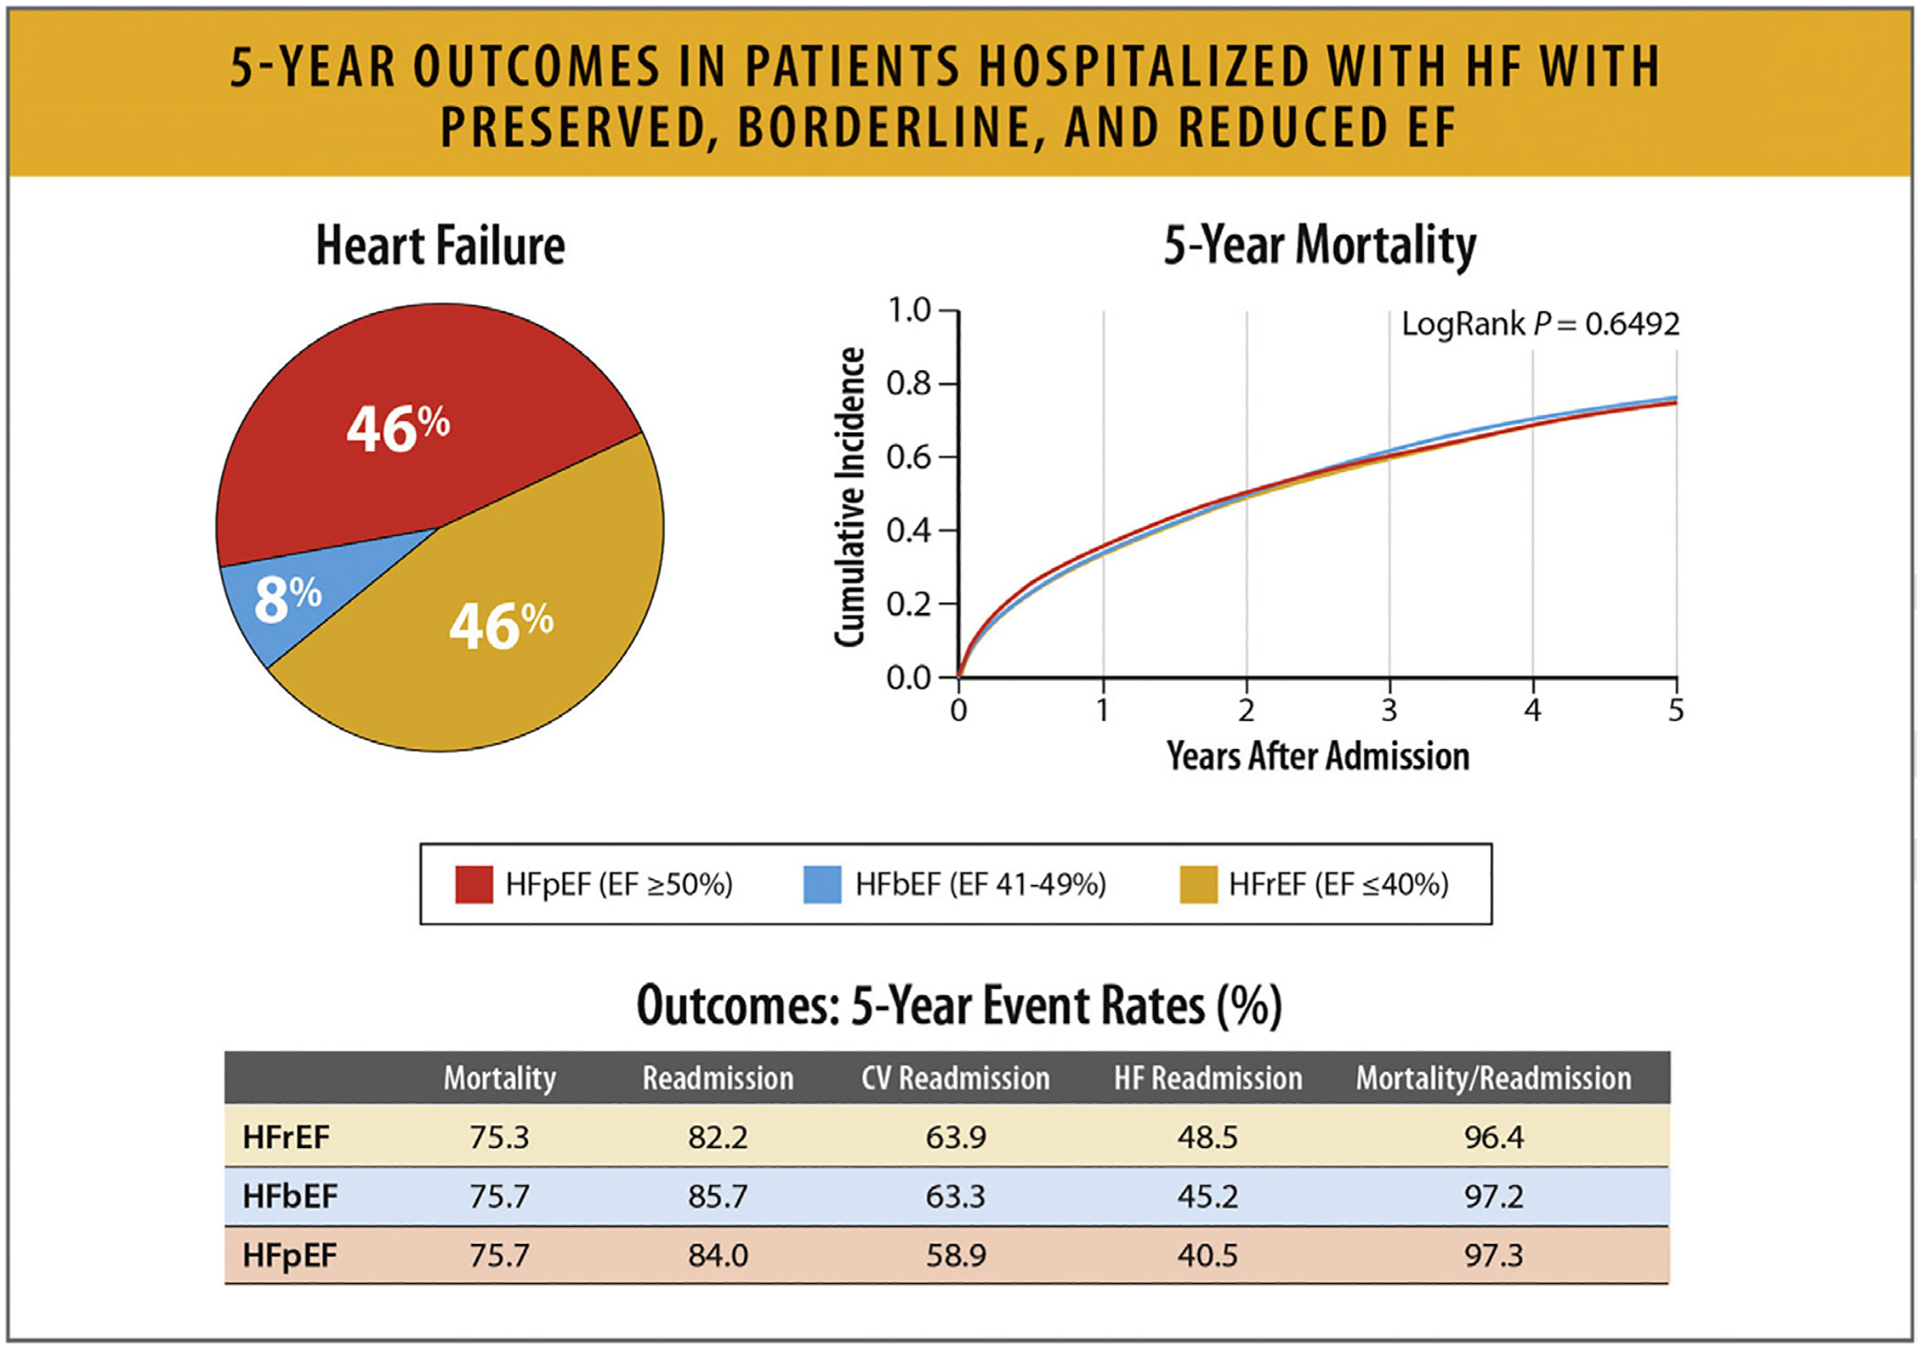
Five-year outcomes in patients hospitalized with HFpEF, HFbEF, and HFrEF. CV = cardiovascular; HfbEF = heart failure with borderline ejection fraction; HFpEF = heart failure with preserved ejection fraction; HFrEF = heart failure with reduced ejection fraction Modified from Shah KS, Xu H, Matsouaka RA, Bhatt DL, Heidenreich PA, Hernandez AF, et al. Heart failure with preserved, borderline, and reduced ejection fraction: 5-year outcomes. J Am Coll Cardiol 2017;70:2476–86.
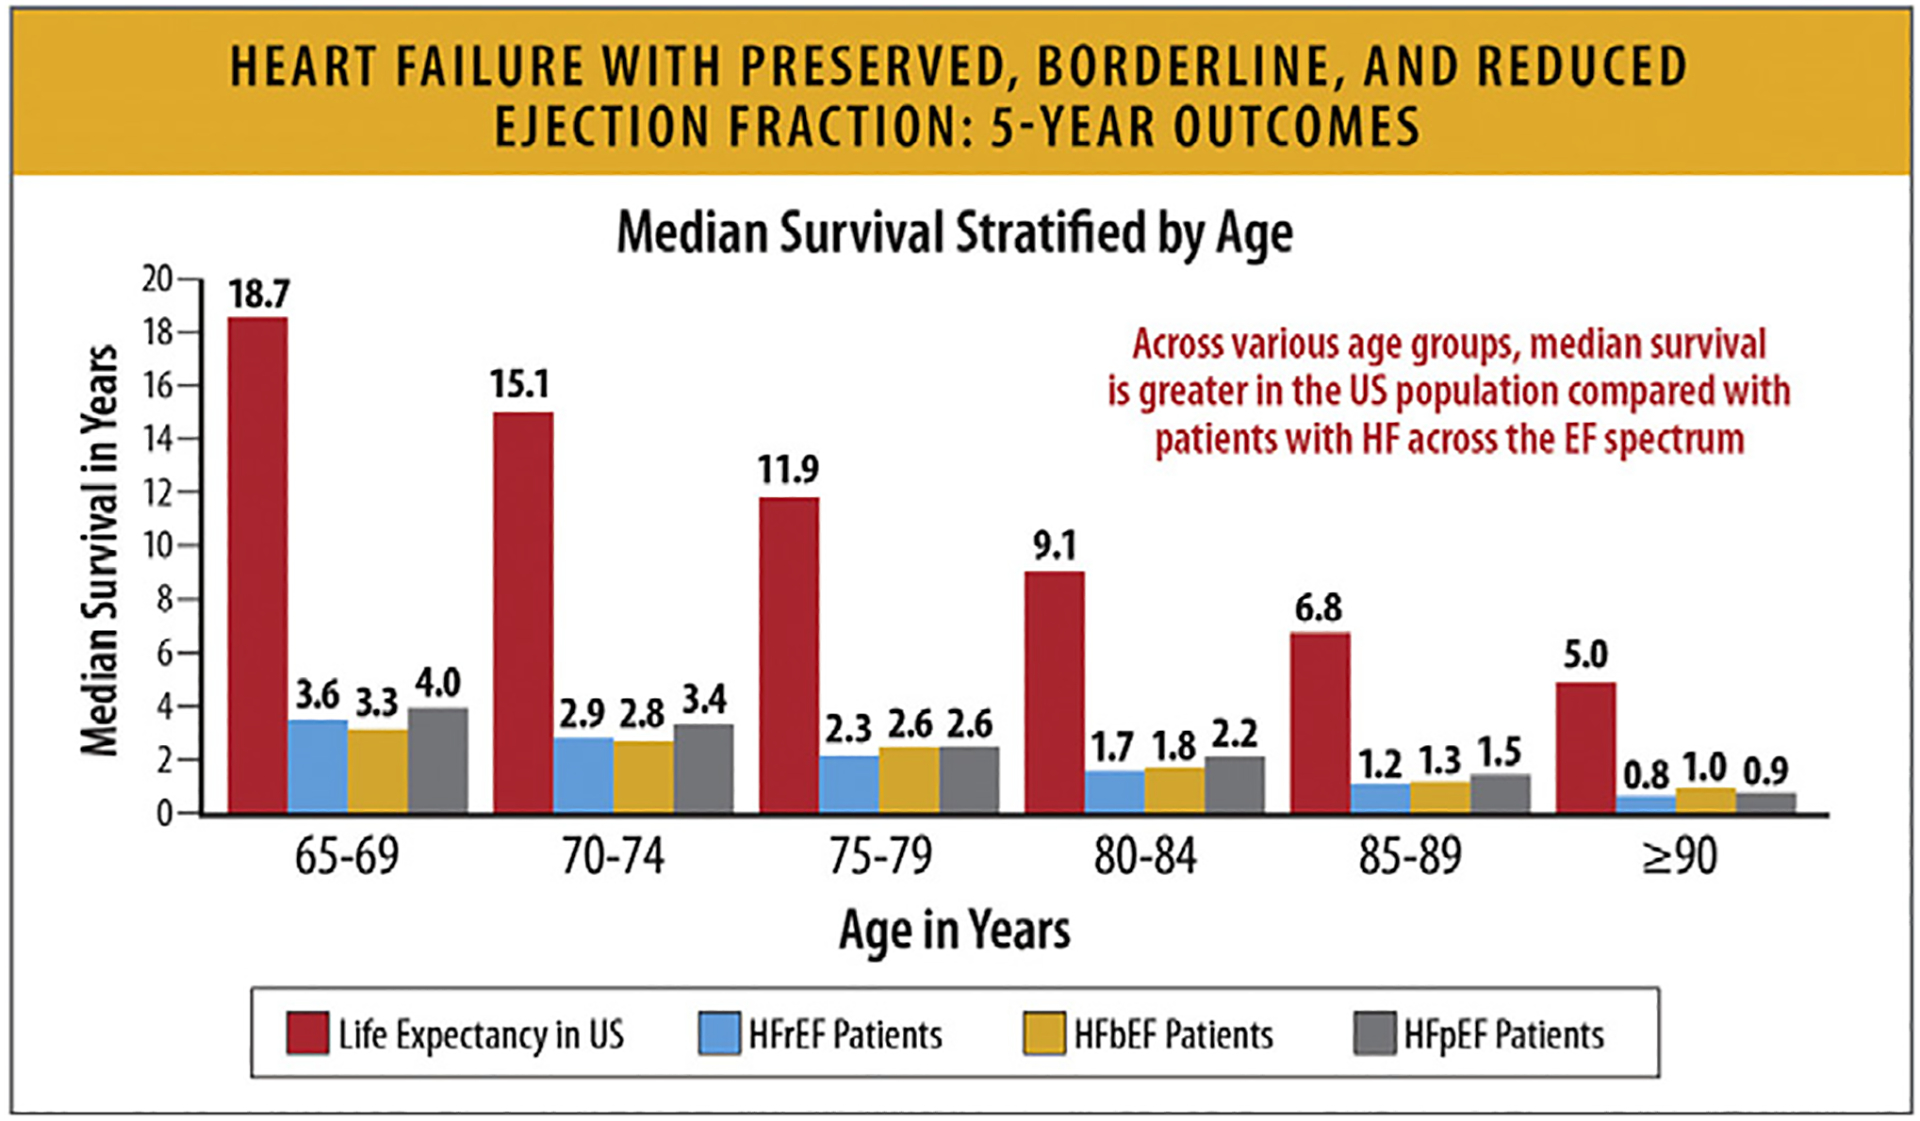
HFpEF, HFbEF, and HFrEF: 5-year outcomes. EF = ejection fraction; HF = heart failure; HfbEF = heart failure with borderline ejection fraction; HFpEF = heart failure with preserved ejection fraction; HFrEF = heart failure with reduced ejection fraction; US = United States. Modified from Shah KS, Xu H, Matsouaka RA, Bhatt DL, Heidenreich PA, Hernandez AF, et al. Heart failure with preserved, borderline, and reduced ejection fraction: 5-year outcomes. J Am Coll Cardiol 2017;70:2476–86.
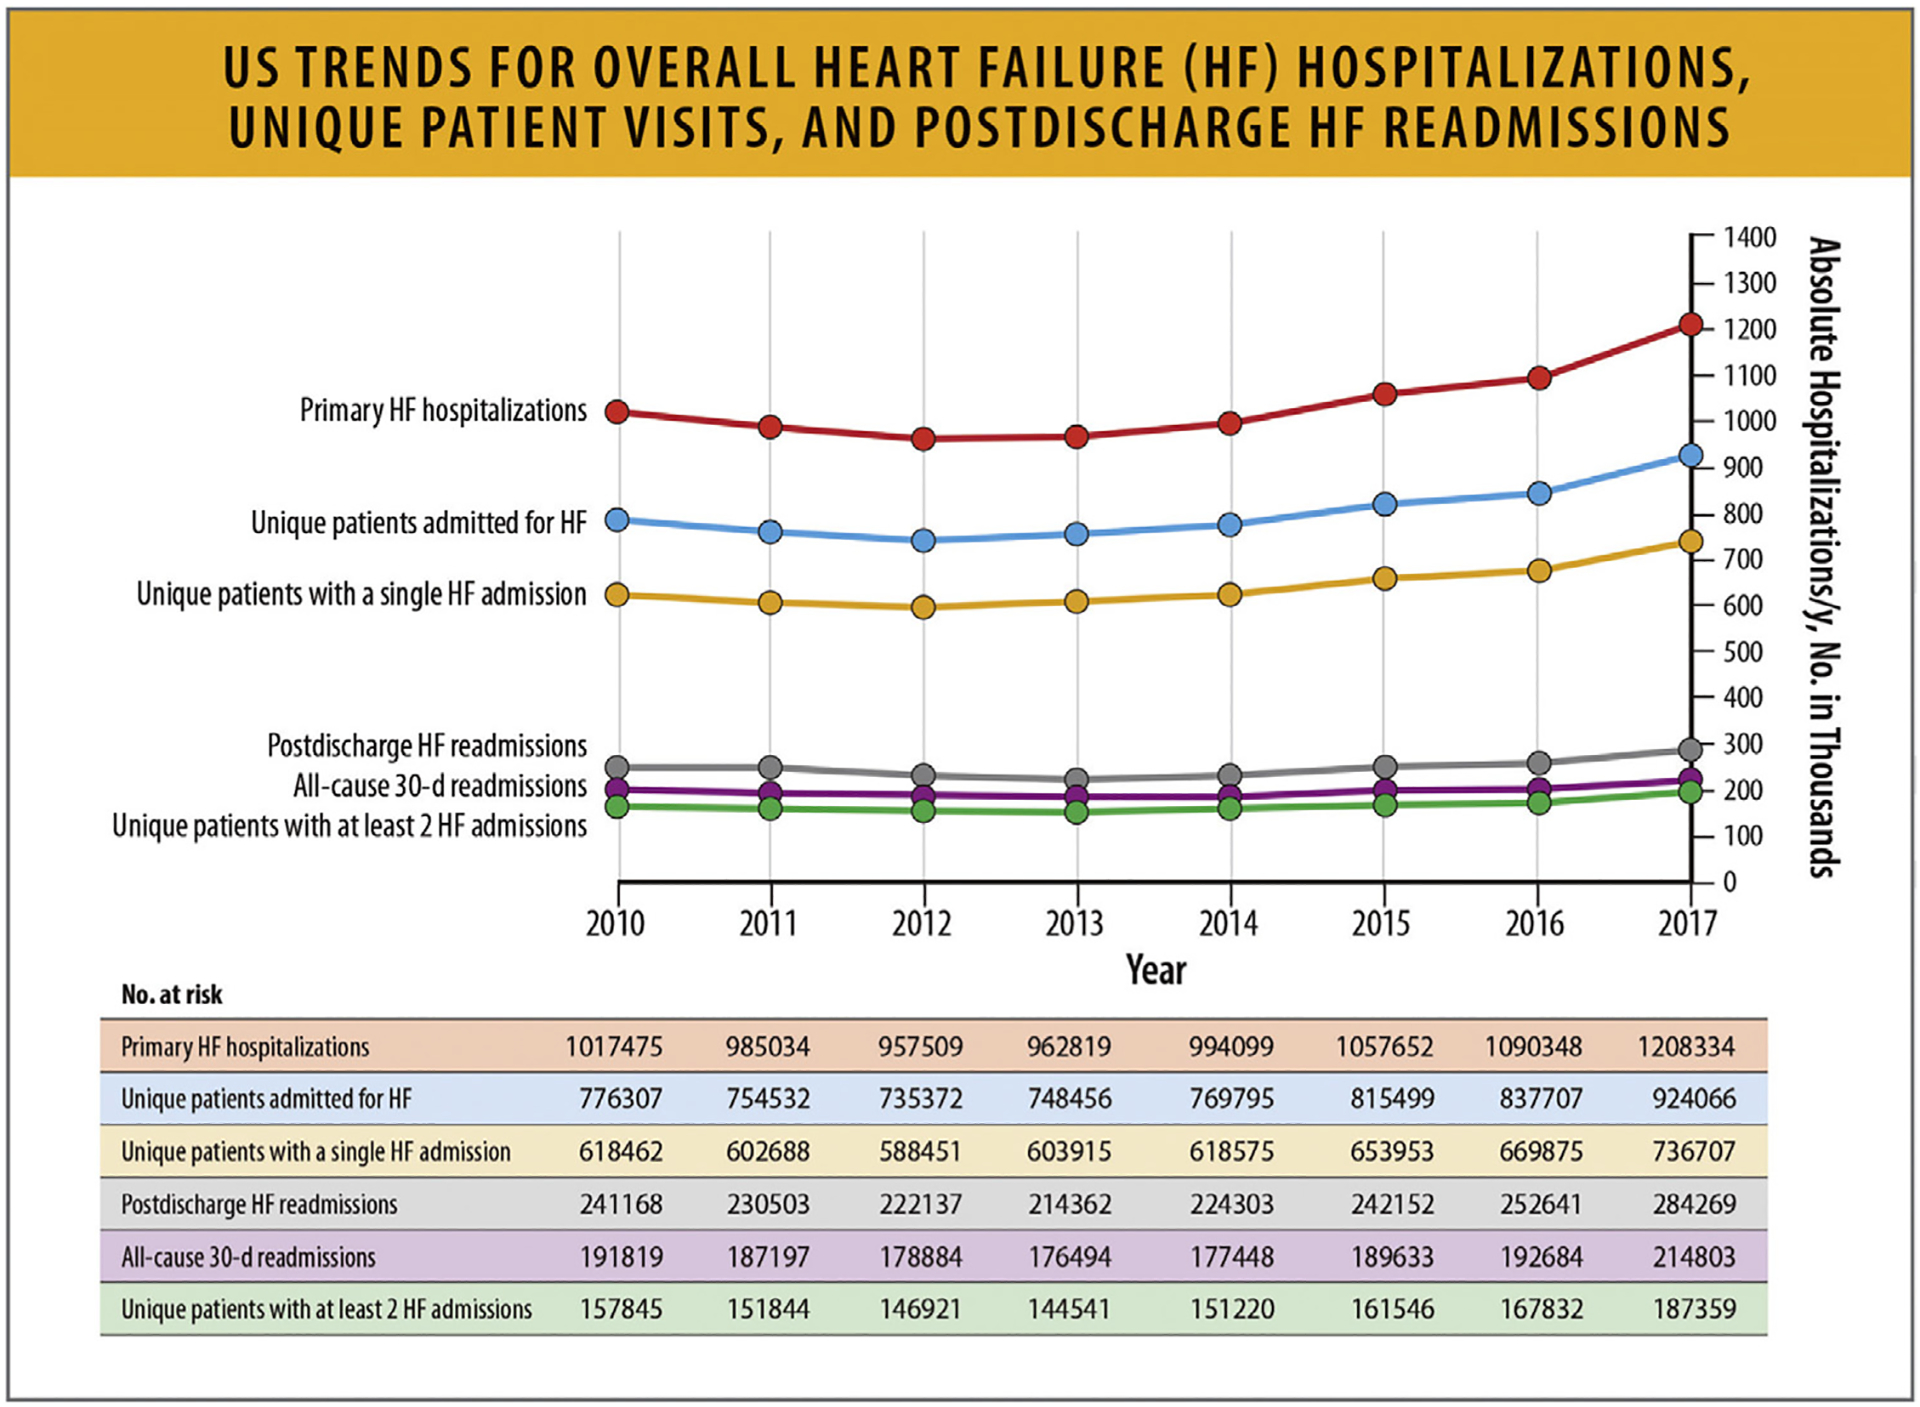
US trends for overall HF hospitalizations, unique patient visits, and postdischarge HF readmissions. HF = heart failure, US = United States. Modified from Agarwal MA, Fonarow GC, Ziaeian B. National trends in heart failure hospitalizations and readmissions from 2010 to 2017. JAMA Cardiol 2021;6:952–6.
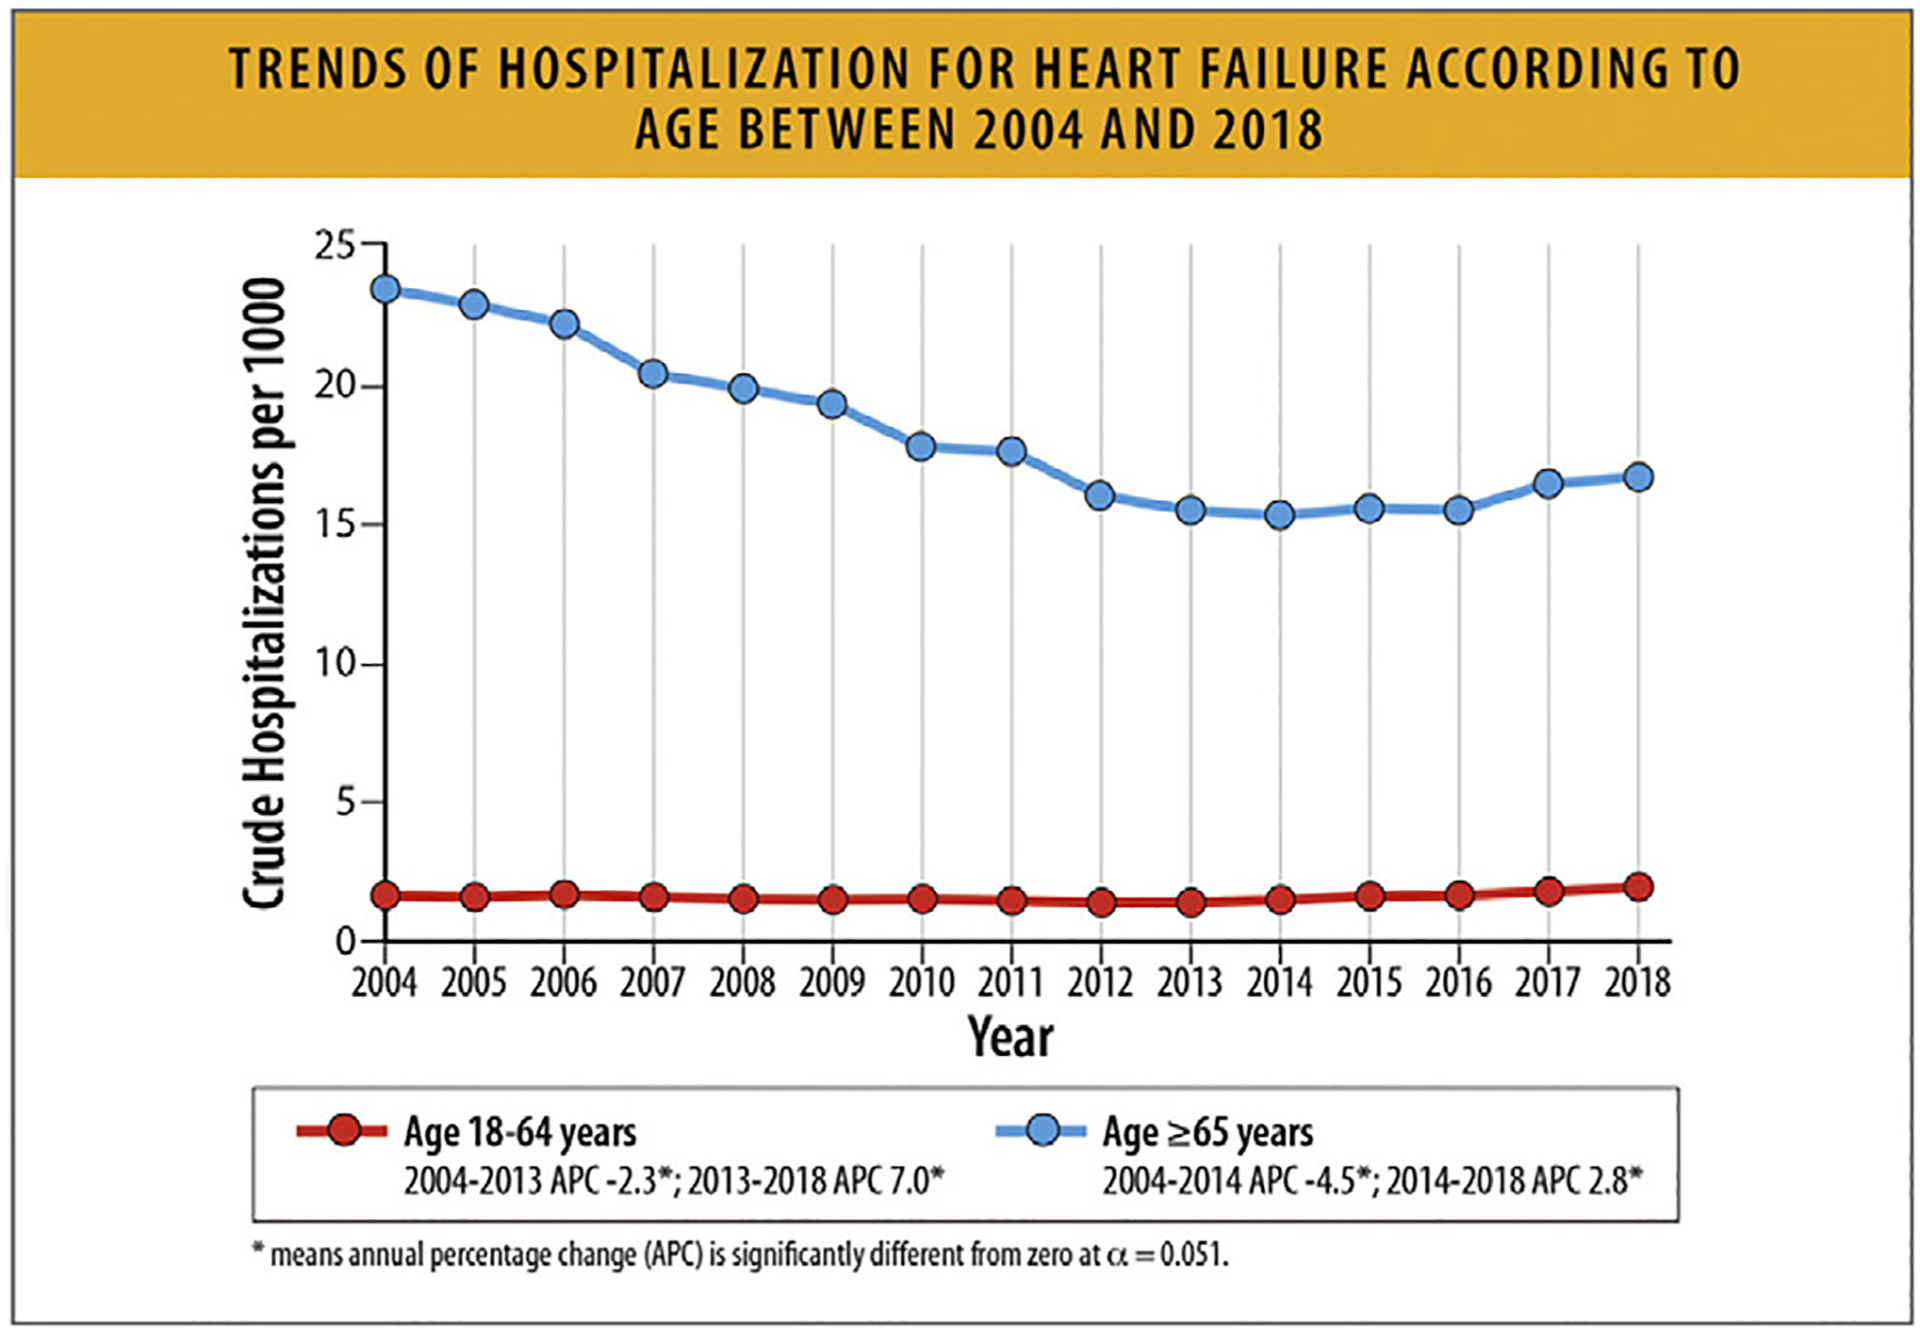
Trends of hospitalization for HF according to age between 2004 and 2018. APC = annual percentage change; HF = heart failure. Modified from Salah HM, Minhas AMK, Khan MS, Khan SU, Ambrosy AP, Blumer V, et al. Trends and Characteristics of Hospitalizations for Heart Failure in the United States from 2004 to 2018. ESC Heart Fail 2022;9:947–52.
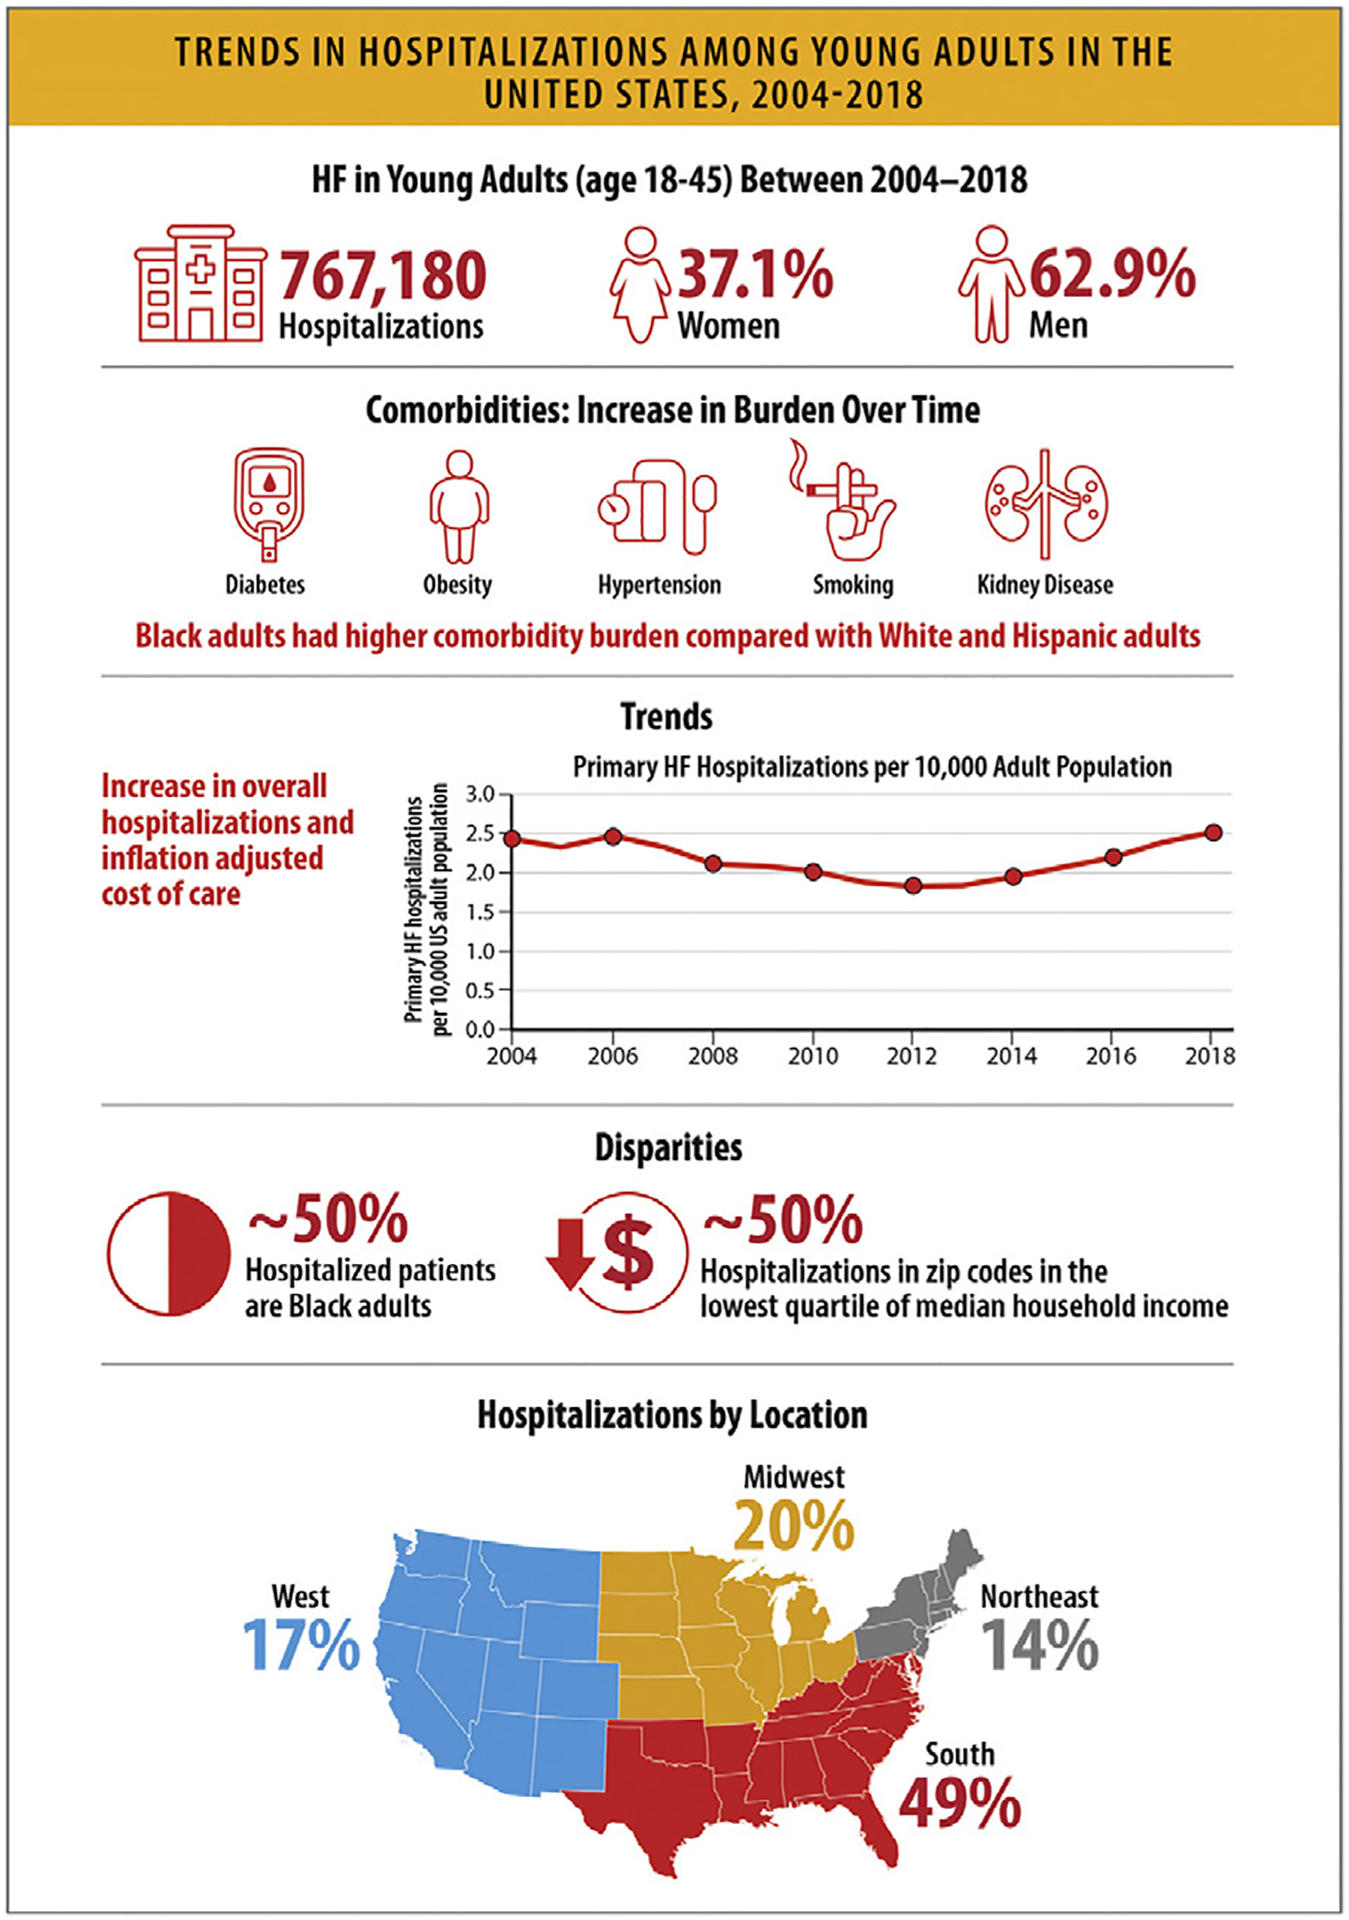
Trends in hospitalizations among young adults in the United States, 2004–2018. APC = annual percentage change; HF = heart failure; US = United States. Modified from Jain V, Minhas AMK, Khan SU, Greene SJ, Pandey A, Van Spall HGC, et al. Trends in HF hospitalizations among young adults in the United States From 2004 to 2018. JACC Heart Fail 2022;10:350–62.
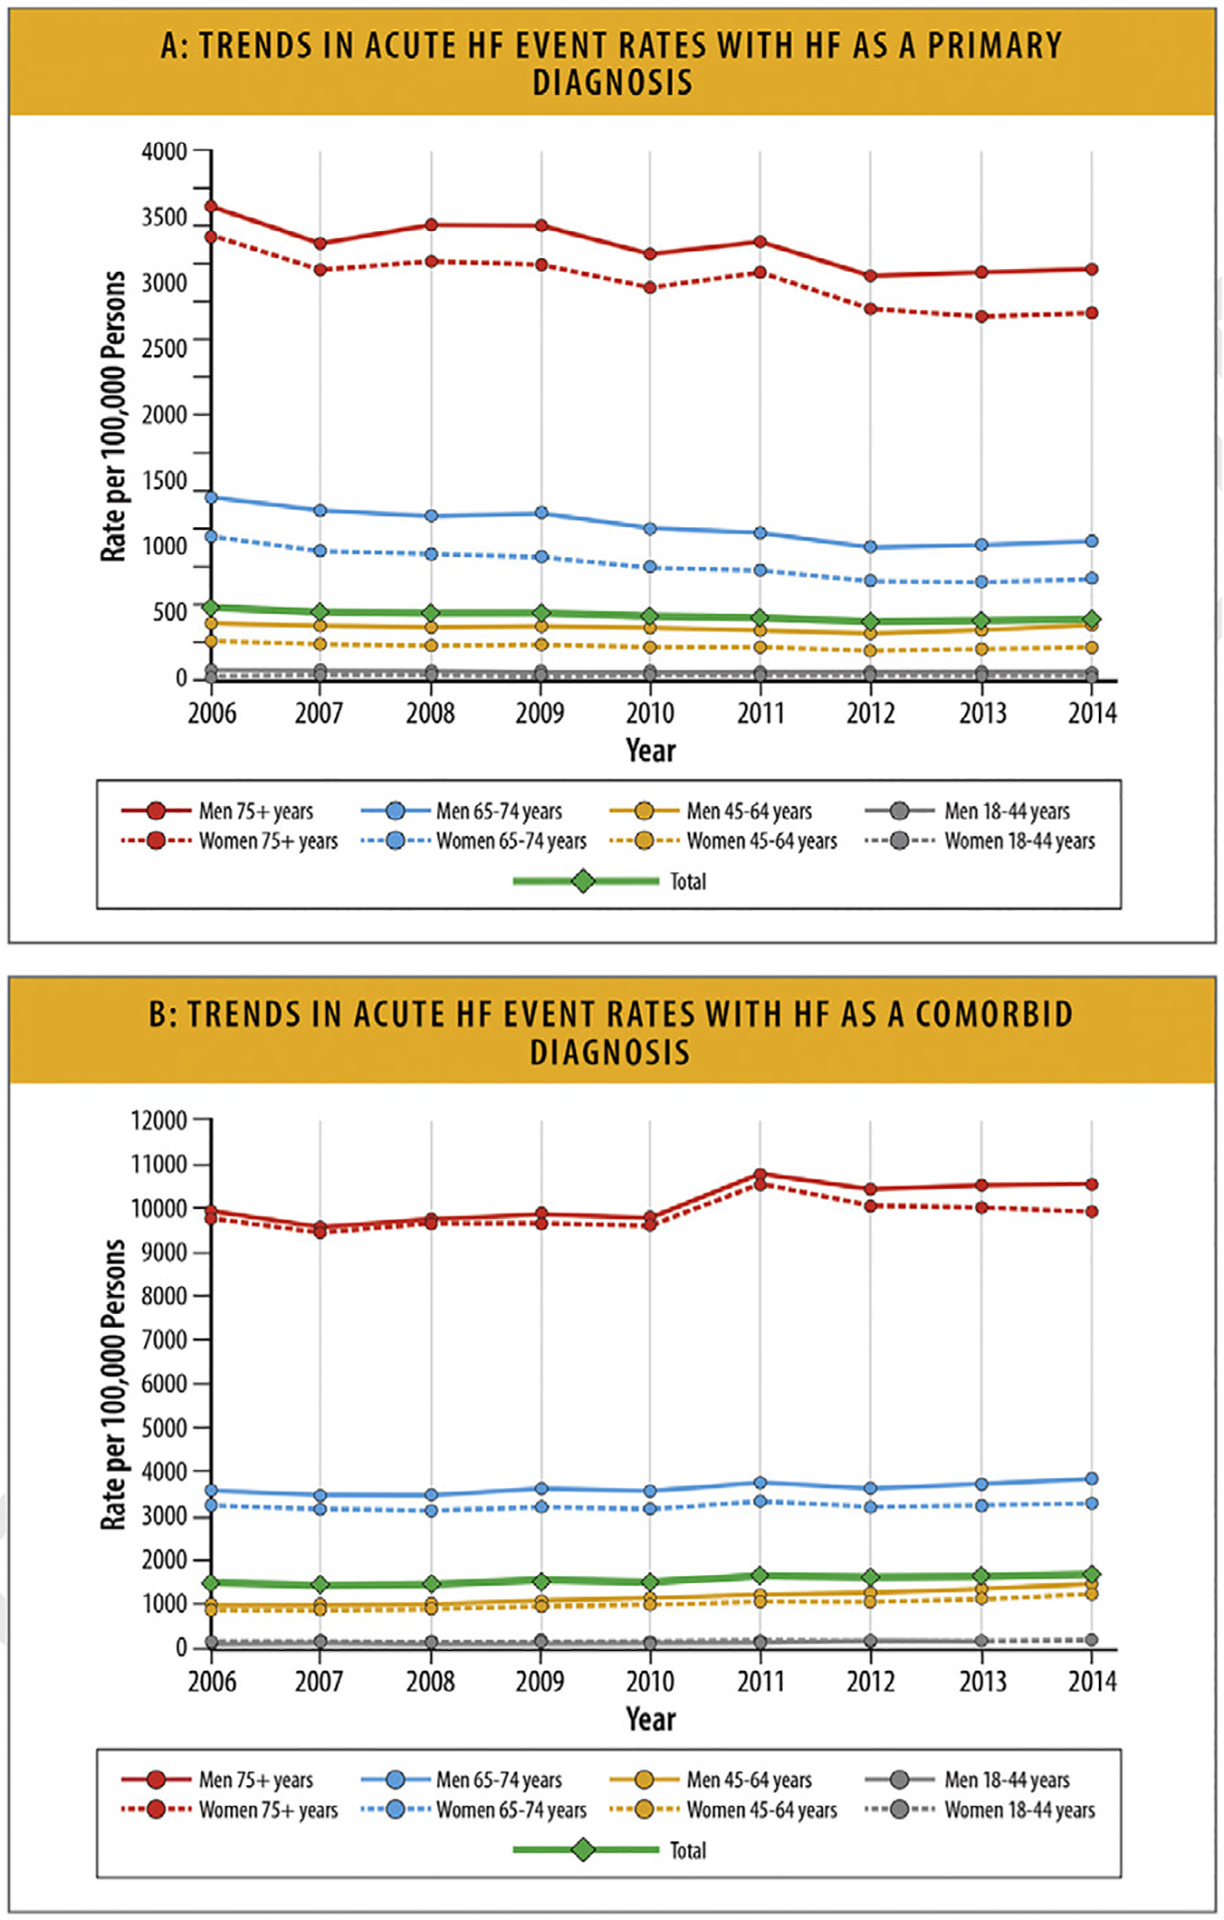
(A) Trends in acute HF event rates with HF as a primary diagnosis. (B) Trends in acute HF event rates with HF as a comorbid diagnosis. HF = heart failure. Modified from Jackson SL, Tong X, King RJ, Loustalot F, Hong Y, Ritchey MD. National burden of heart failure events in the United States, 2006 to 2014. Circ Heart Fail 2018;11:e004873.
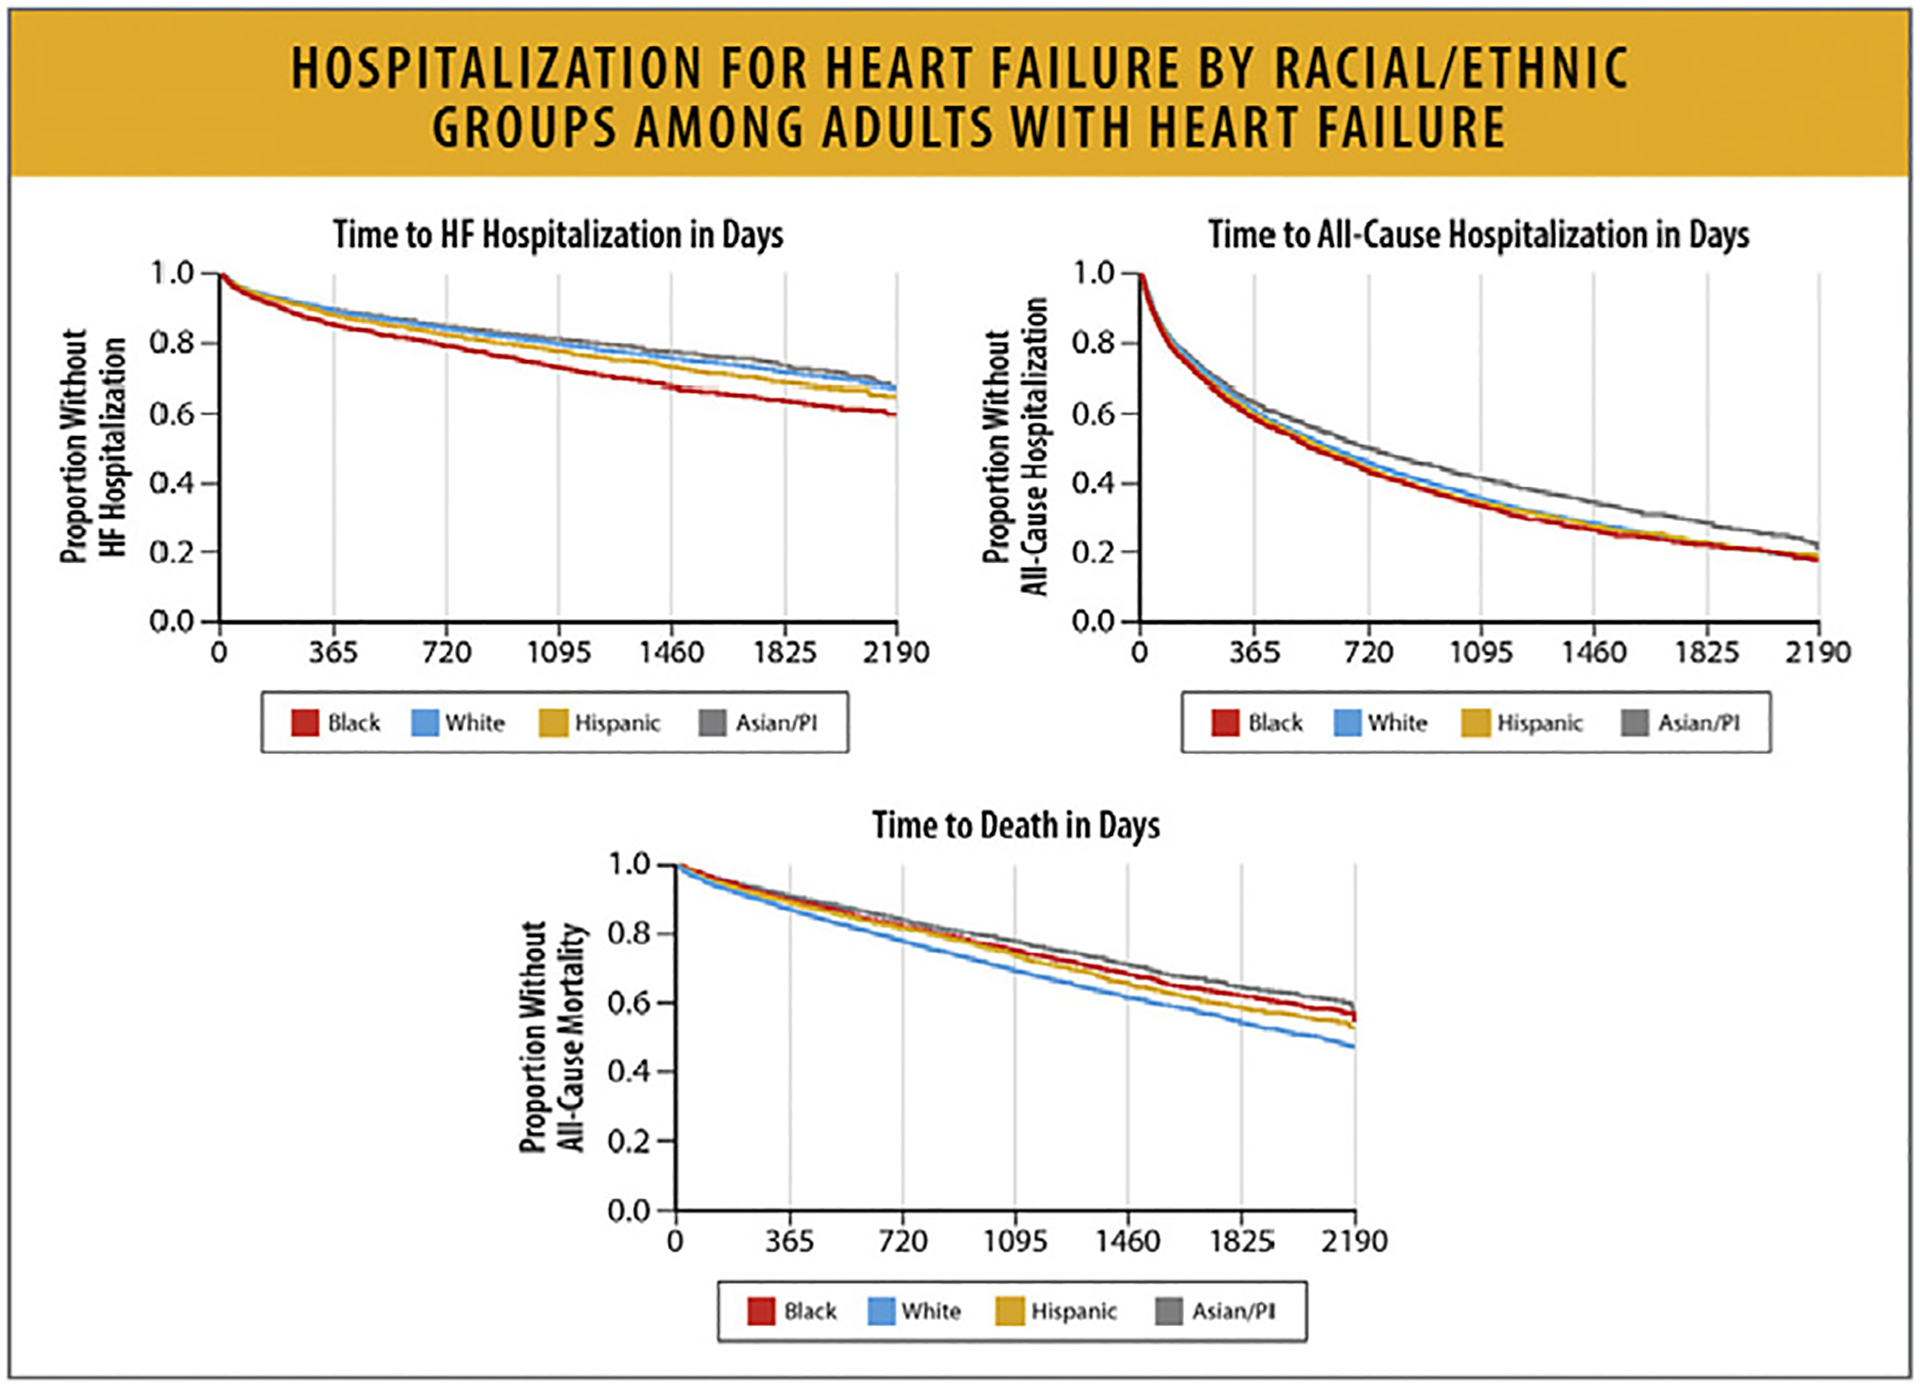
Hospitalization for HF by racial/ethnic groups among adults with HG. HF = heart failure; PI = Pacific Islander. Modified from Savitz ST, Leong T, Sung SH, Lee K, Rana JS, Tabada G, et al. Contemporary reevaluation of race and ethnicity with outcomes in heart failure. J Am Heart Assoc 2021;10:e016601.
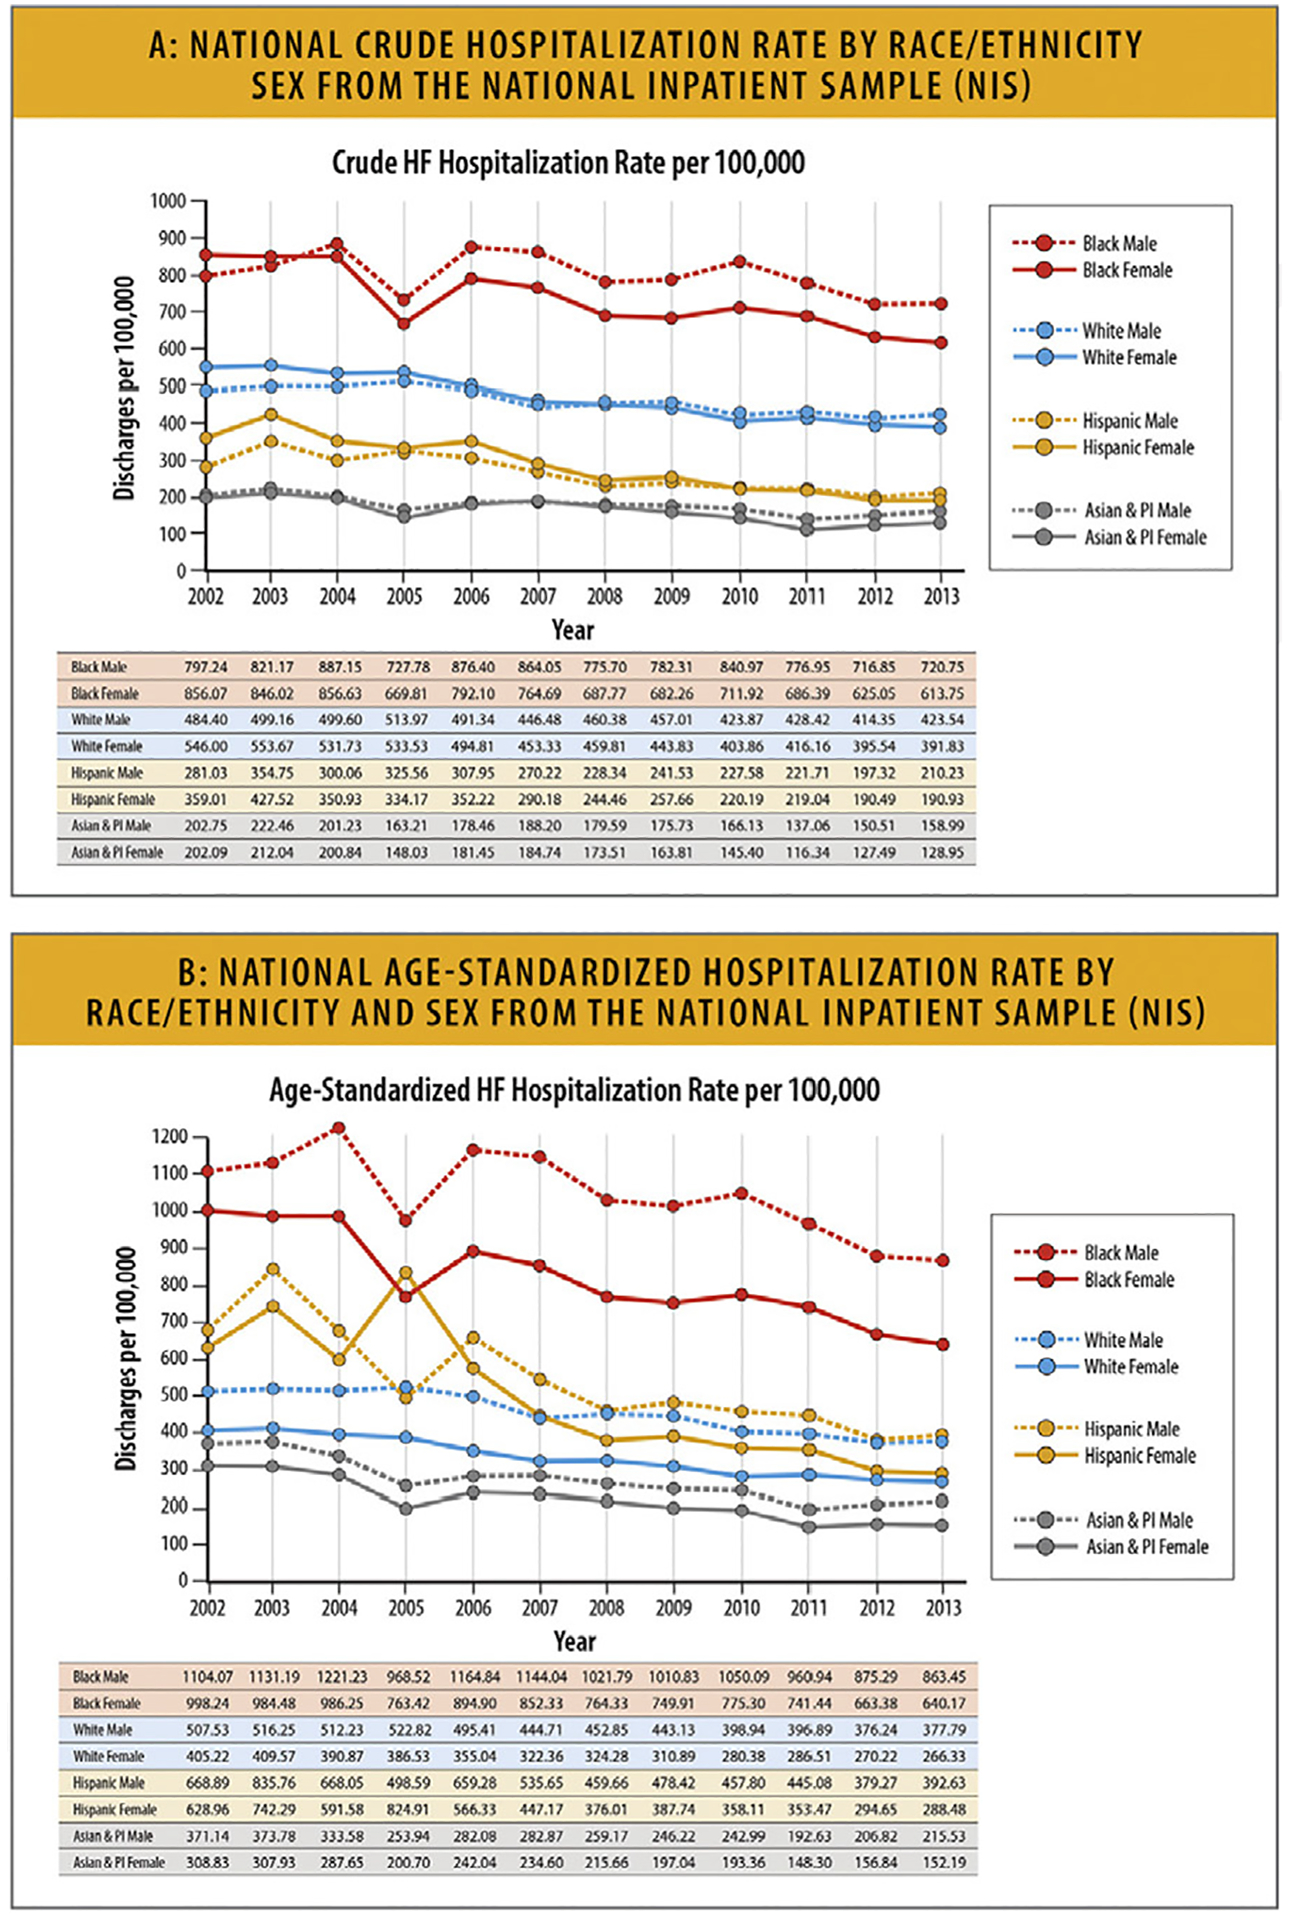
(A) National crude hospitalization rate by race/ethnicity and sex from the NIS.
(B) National age-standardized hospitalization rate by race/ethnicity and sex from the NIS. HF = heart failure; NIS = National Inpatient Sample; PI = Pacific Islander. Modified from Ziaeian B, Kominski GF, Ong MK, Mays VM, Brook RH, Fonarow GC. National differences in trends for heart failure hospitalizations by sex and race/ethnicity. Circ Cardiovasc Qual Outcomes 2017;10:e003552.
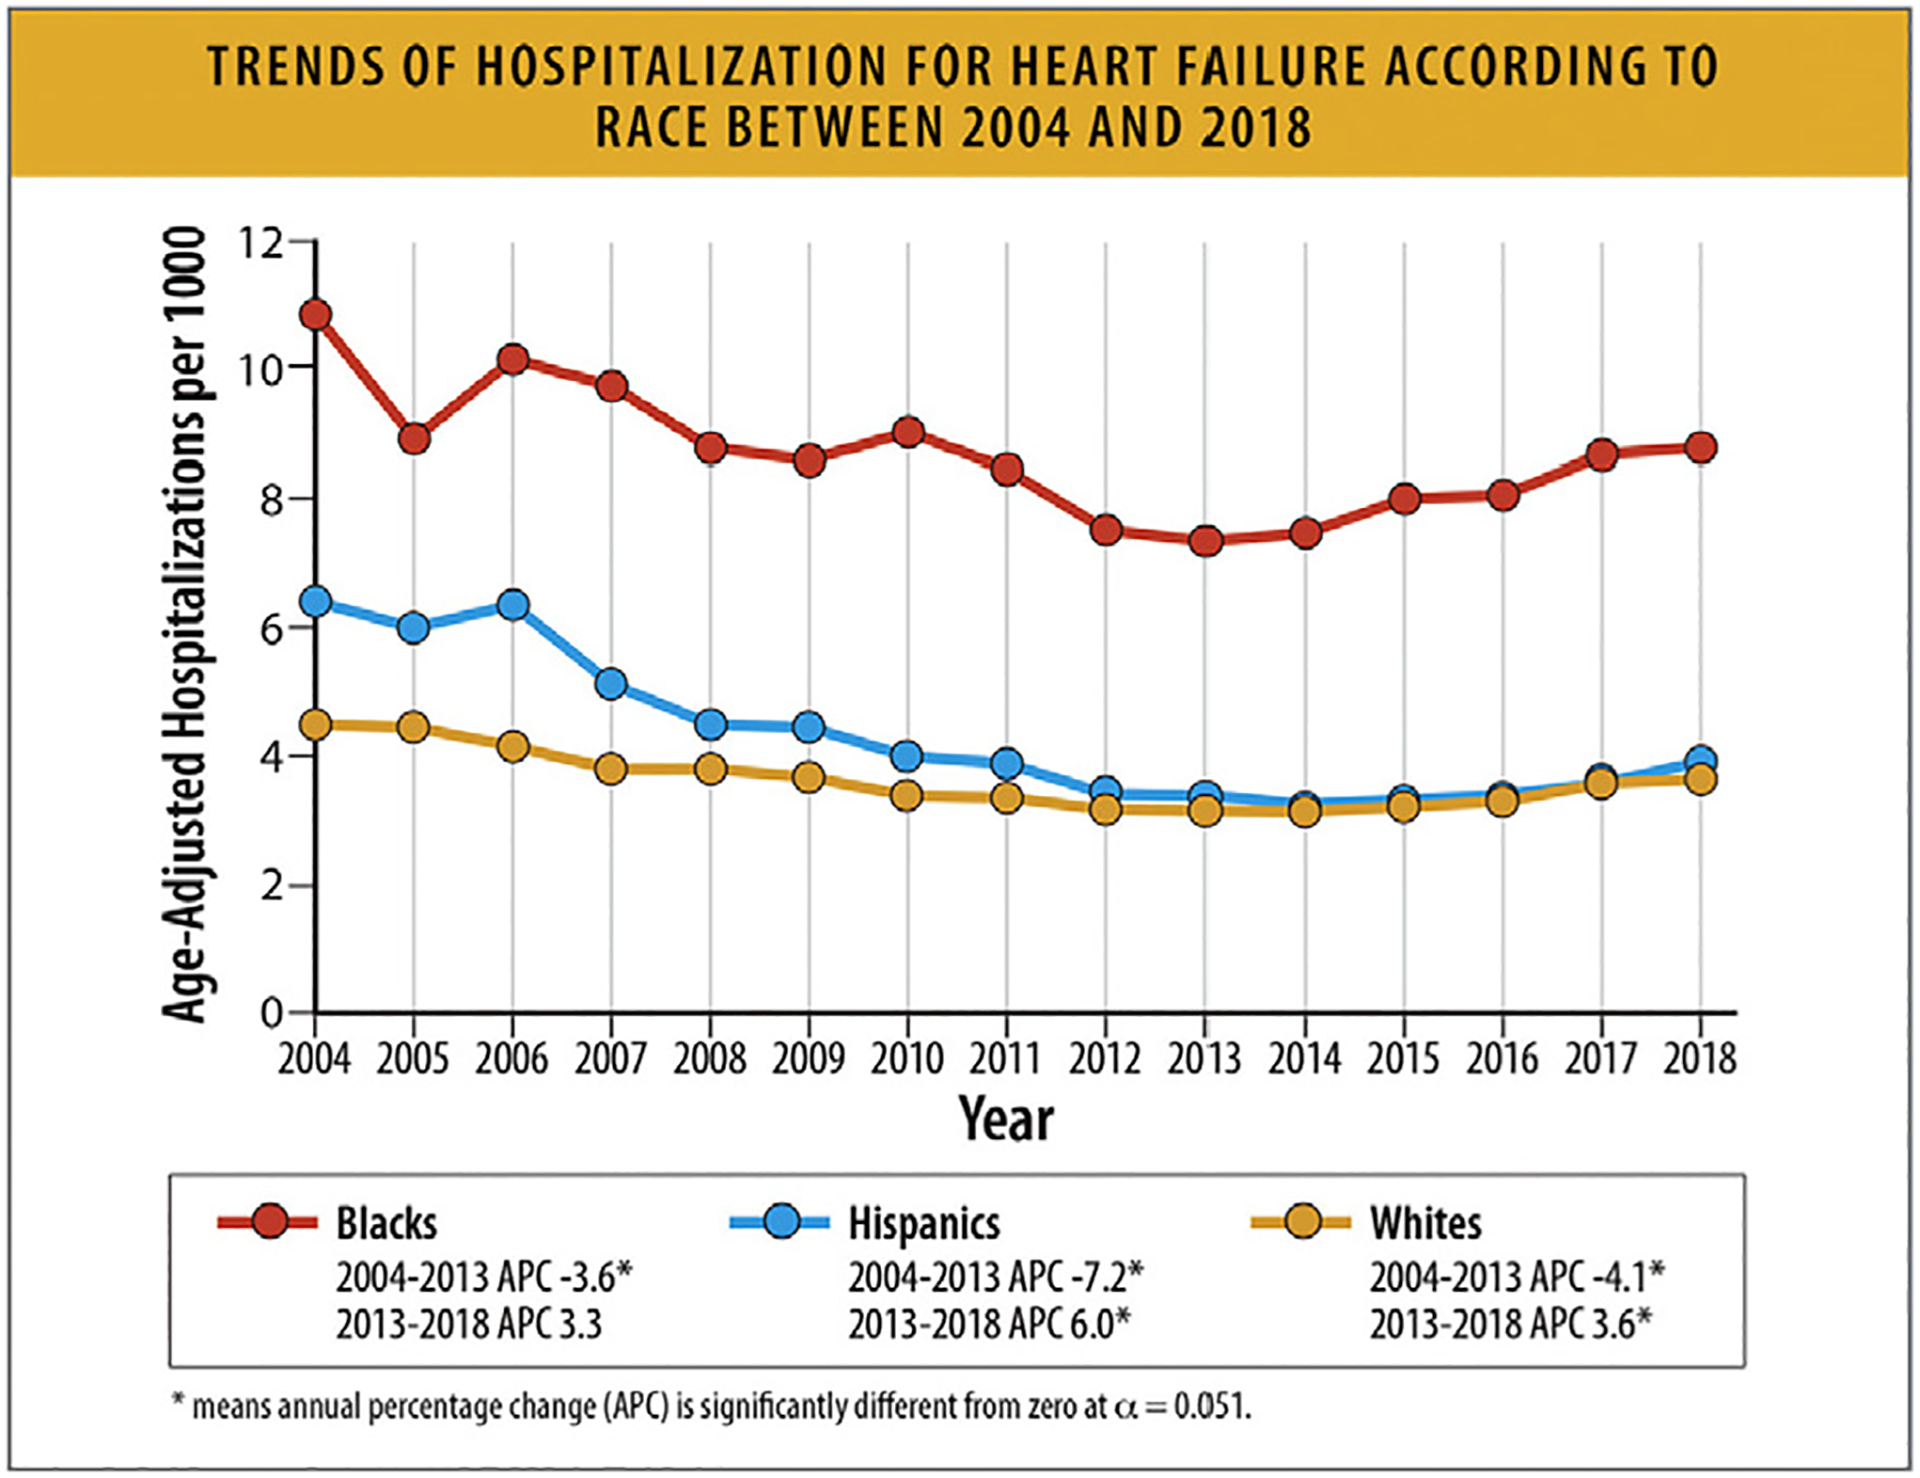
Trends of hospitalization for HF according to race between 2004 and 2018. APC = annual percentage change; HF = heart failure. Modified from Salah HM, Minhas AMK, Khan MS, Khan SU, Ambrosy AP, Blumer V, et al. Trends and characteristics of hospitalizations for heart failure in the United States from 2004 to 2018. ESC Heart Fail 2022;9:947–52.
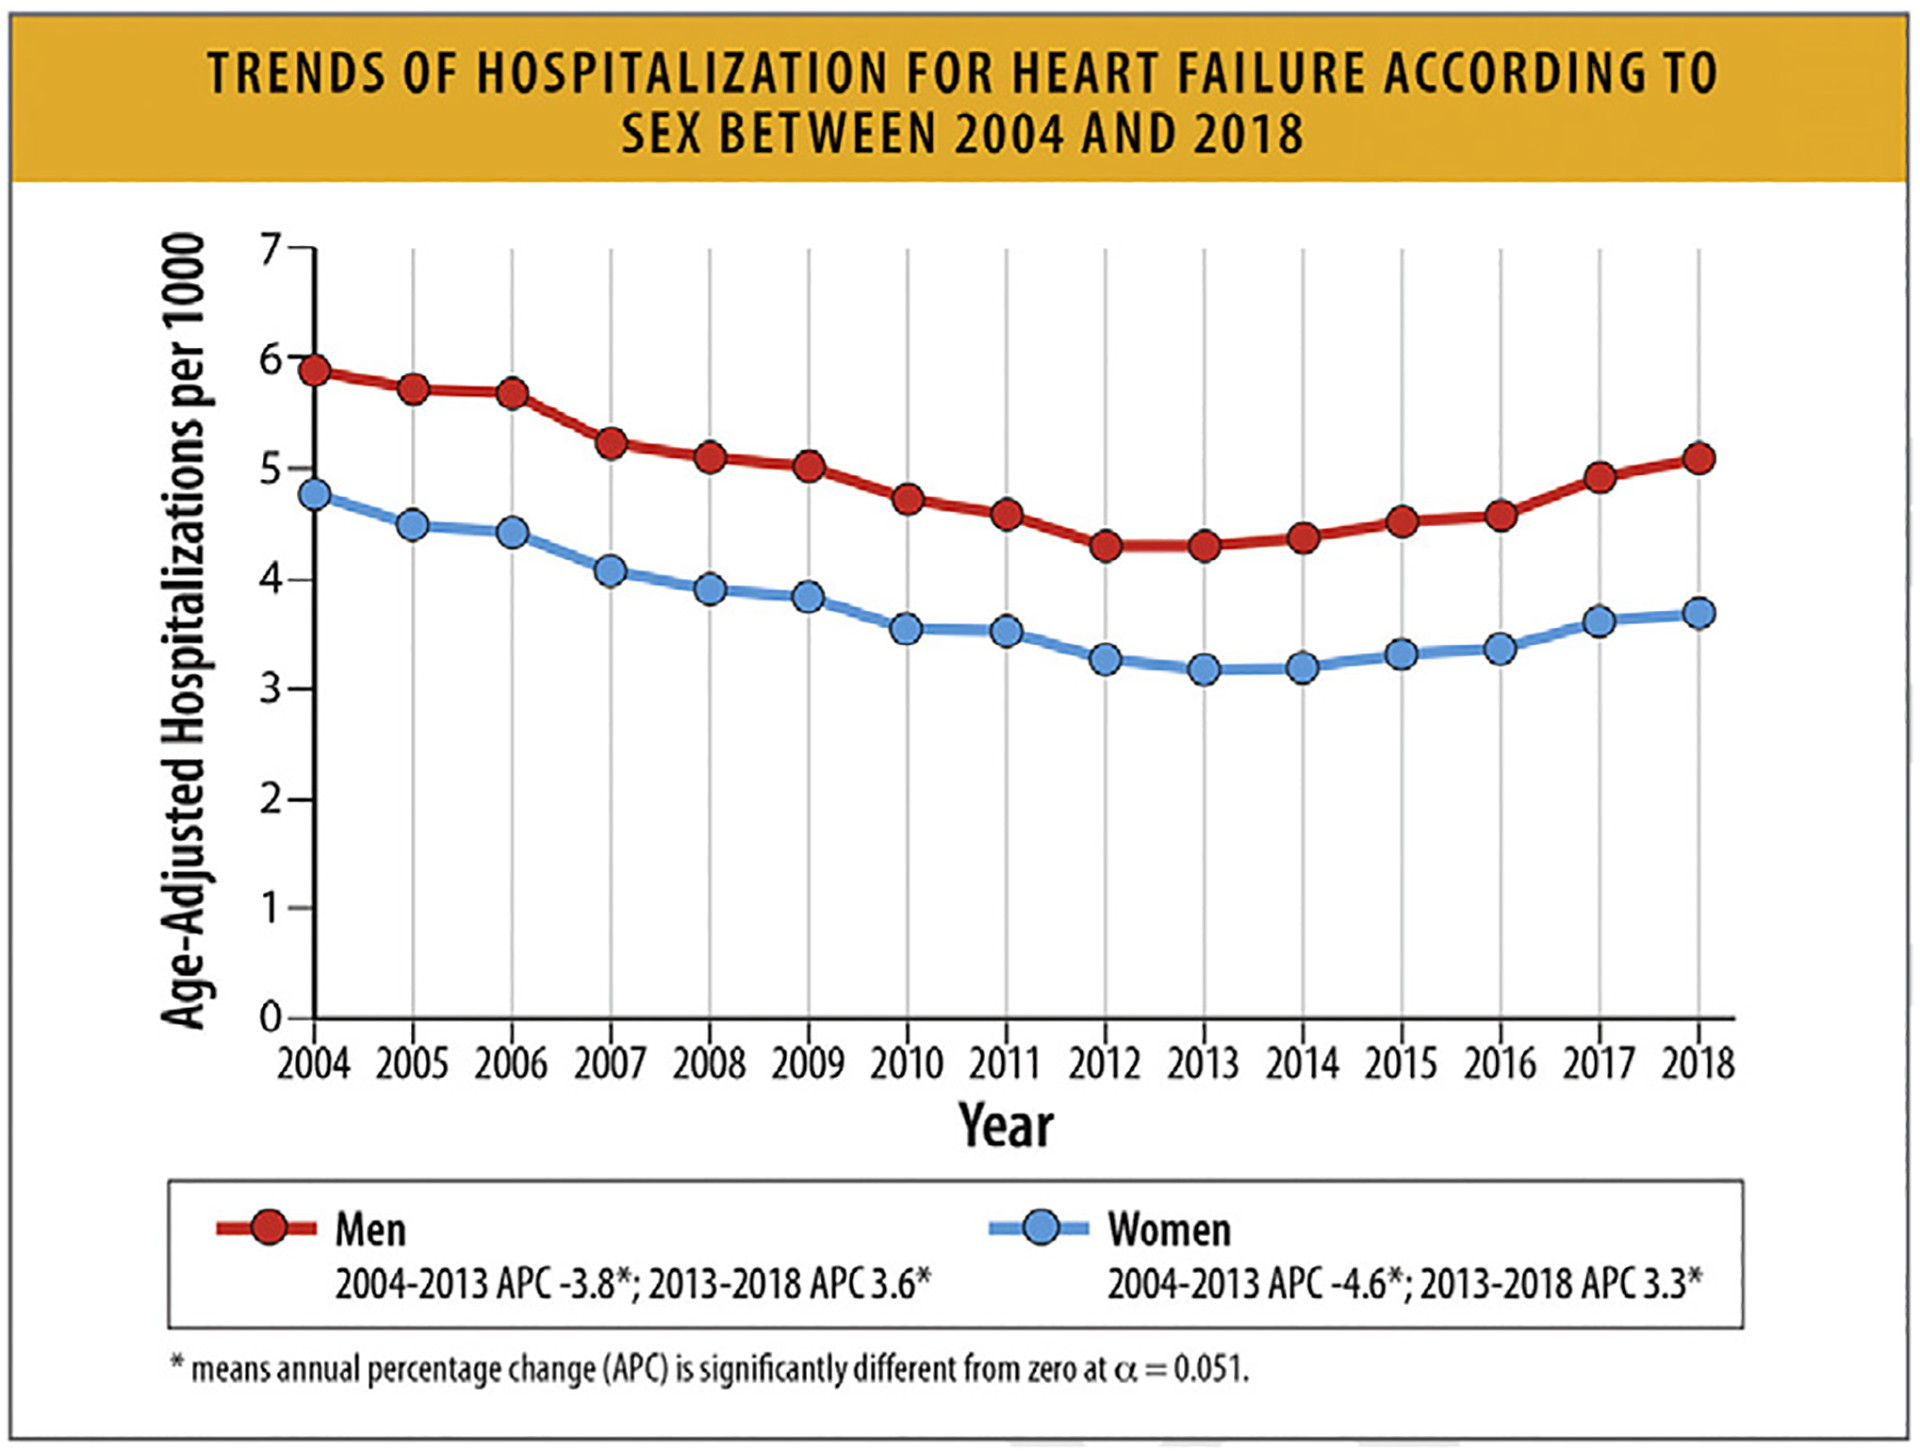
Trends of hospitalization for HF according to sex between 2004 and 2018. APC = annual percentage change, HF = heart failure. Modified from Salah HM, Minhas AMK, Khan MS, Khan SU, Ambrosy AP, Blumer V, et al. Trends and characteristics of hospitalizations for heart failure in the United States from 2004 to 2018. ESC Heart Fail 2022;9:947–52.
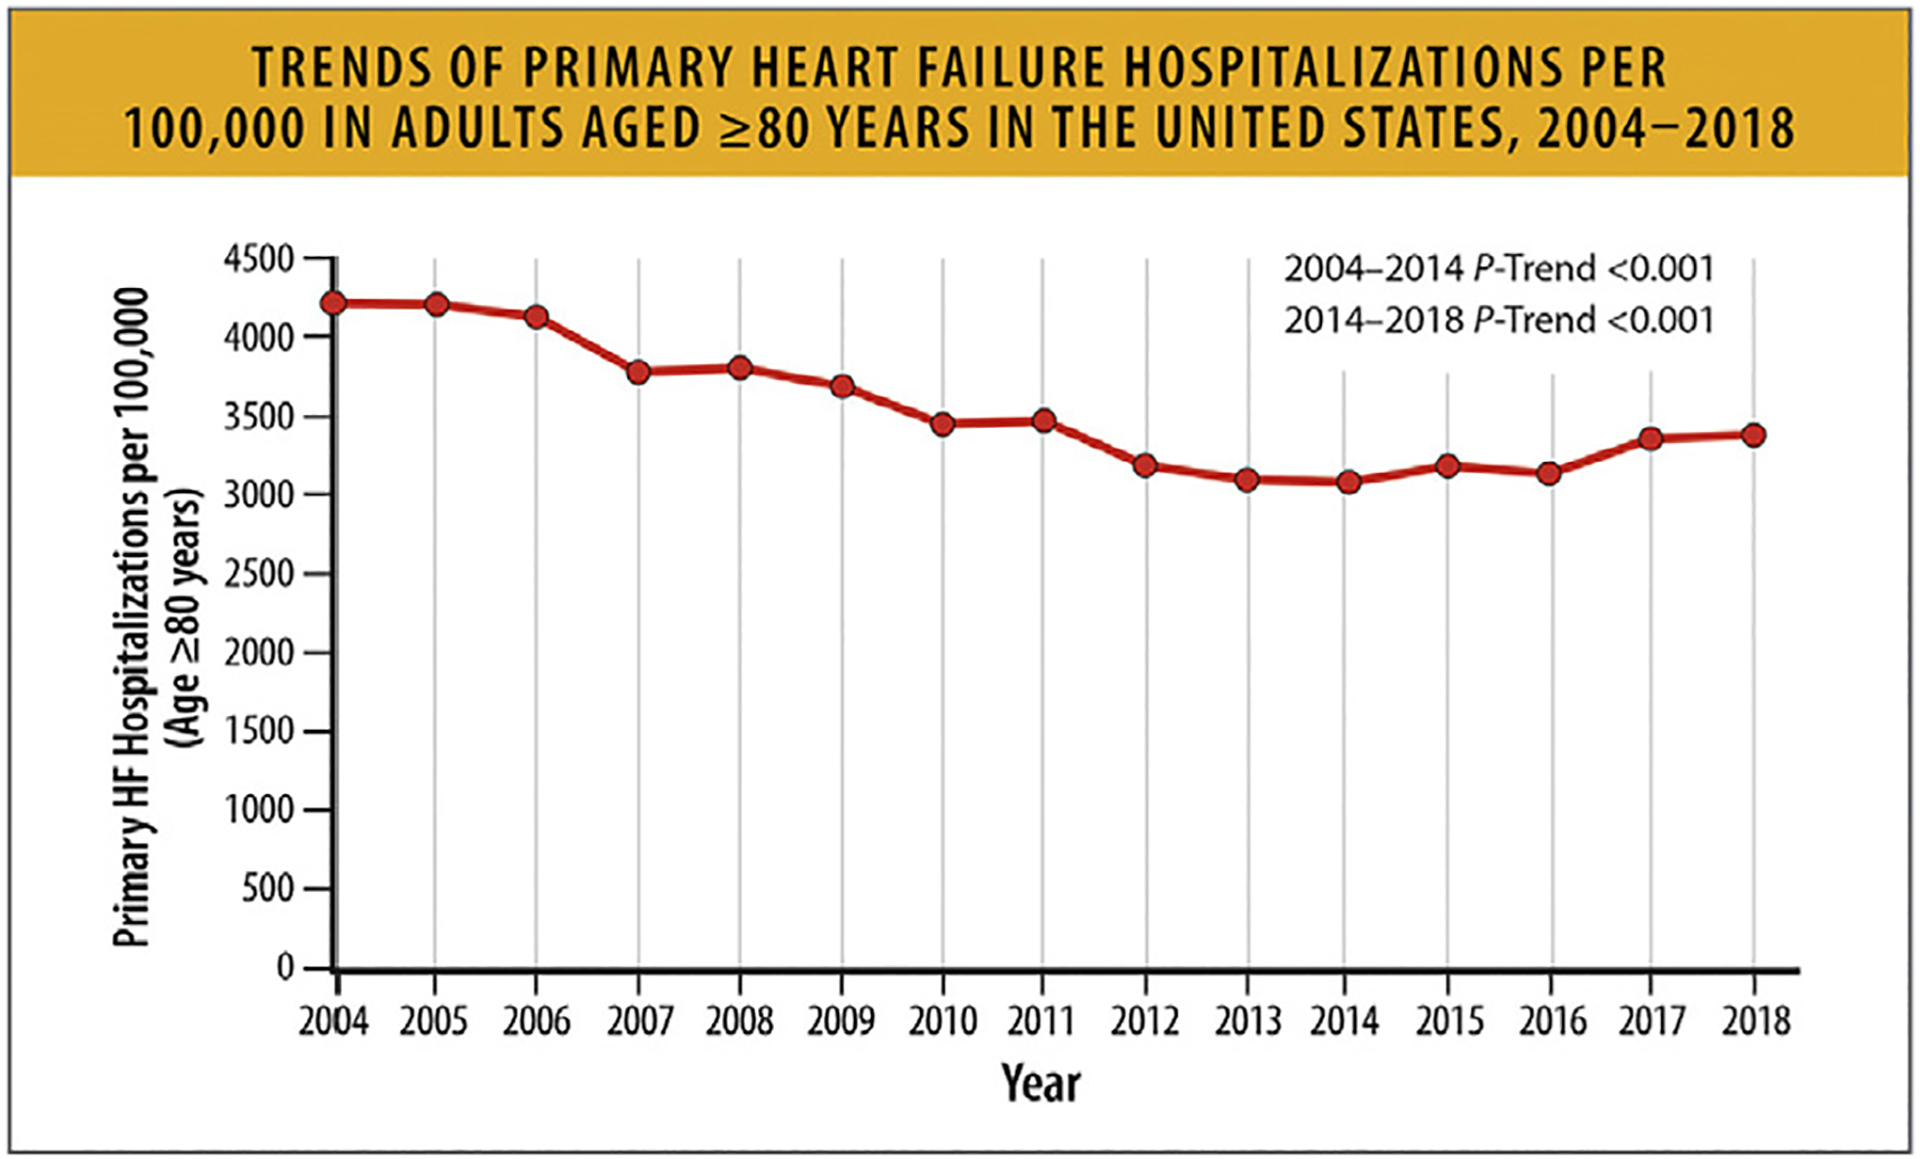
Trends of primary HF hospitalizations per 100,000 in adults aged ≥80 years in the United States, 2004–2018. HF = heart failure; US = United States. Modified from Minhas AMK, Ijaz SH, Jamal S, Dani SS, Khan MS, Greene SJ, et al. Trends in characteristics and outcomes in primary heart failure hospitalizations among older population in the United States, 2004 to 2018. Circ Heart Fail 2022;15: e008943.

Annual HF hospitalization volumes. HF = heart failure; HFrEF = heart failure with reduced ejection fraction; HFpEF = heart failure with preserved ejection fraction. Modified from Clark KAA, Reinhardt SW, Chouairi F, Miller PE, Kay B, Fuery M, et al. Trends in heart failure hospitalizations in the United States from 2008 to 2018. J Card Fail 2022;28:171–80.
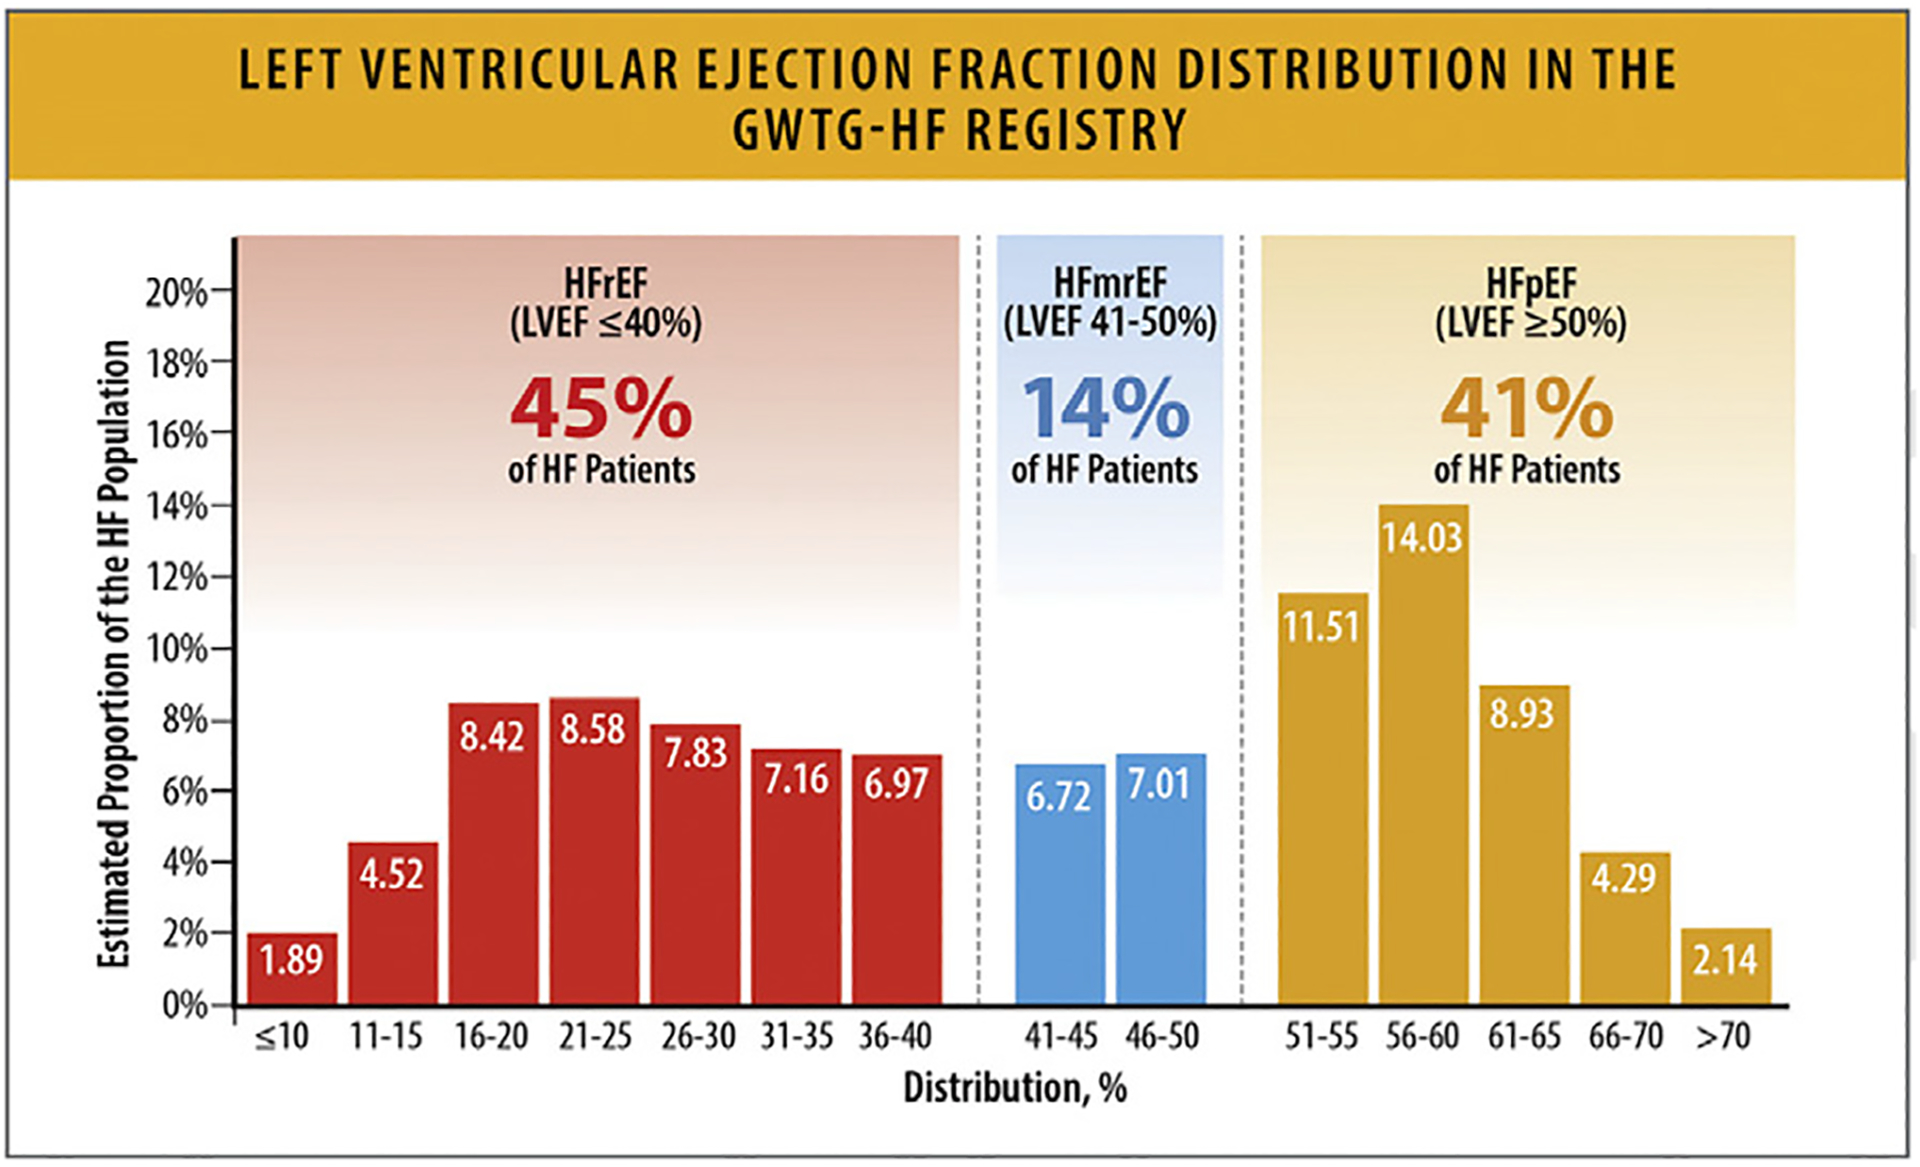
Left ventricular ejection fraction distribution in the GWTG-HF registry. GWTG-HF = Get With the Guidelines; HF = heart failure; HFmrEF = heart failure with mildly reduced ejection fraction; HFpEF = heart failure with preserved ejection fraction; HFrEF = heart failure with reduced ejection fraction; LVEF = left ventricular ejection fraction. Modified from Vaduganathan M, Claggett BL, Greene SJ, Aggarwal R, Bhatt AS, McMurray JJV, et al. Potential implications of expanded US Food and Drug Administration labeling for sacubitril/valsartan in the United States. JAMA Cardiol 2021;6:1415–23.
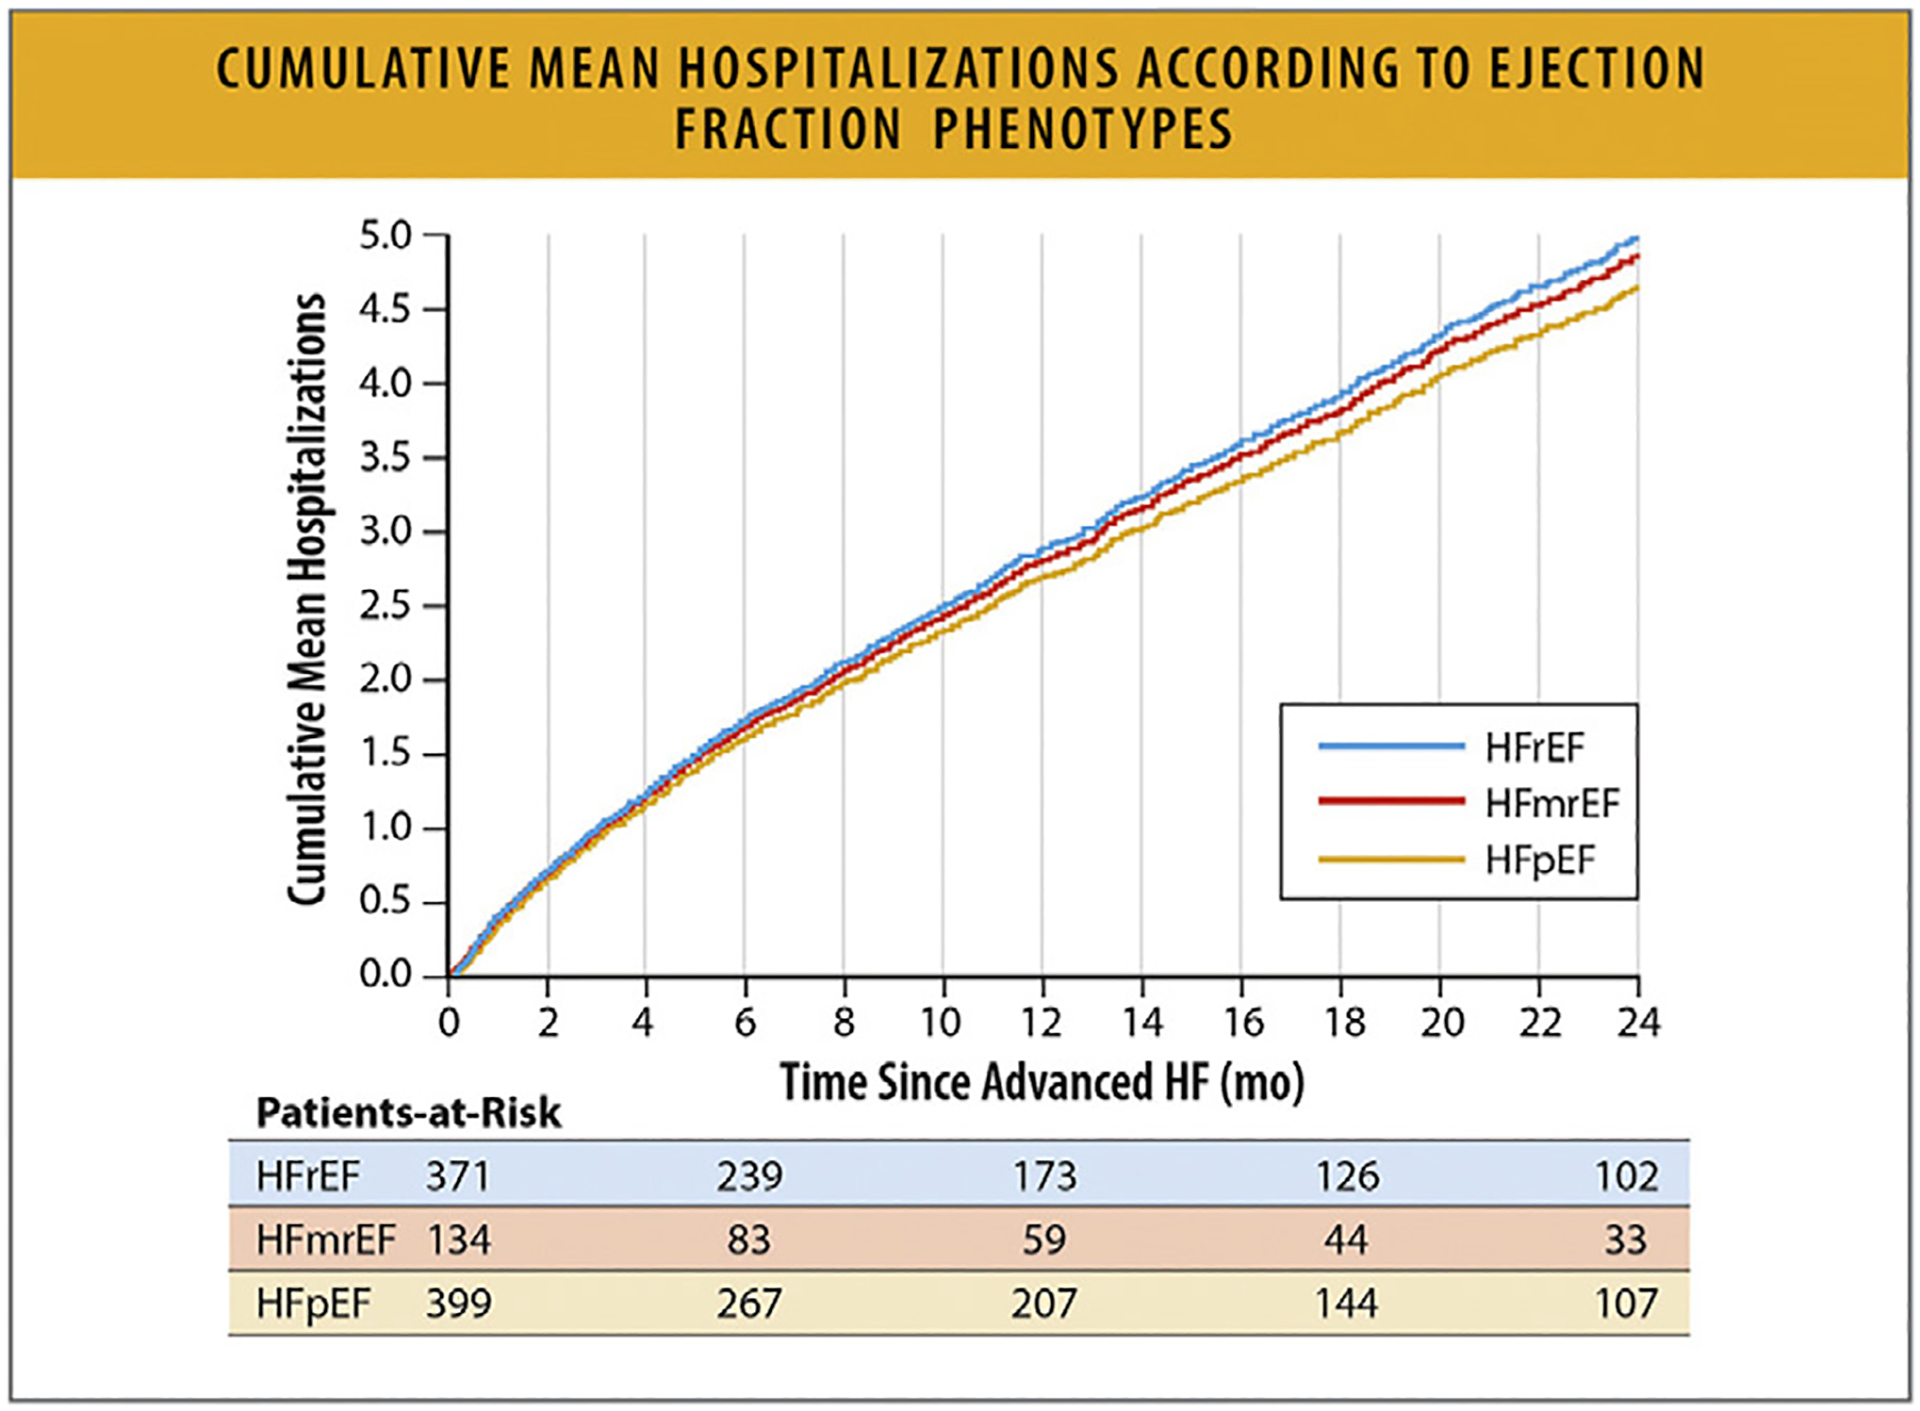
Cumulative mean hospitalizations according to EF phenotypes. EF = ejection fraction; HF = heart failure; HFmrEF = heart failure with mildly reduced ejection fraction; HFpEF = heart failure with preserved ejection fraction; HFrEF = heart failure with reduced ejection fraction. Modified from Dunlay SM, Roger VL, Killian JM, Weston SA, Schulte PJ, Subramaniam AV, et al. Advanced heart failure epidemiology and outcomes: a population-based study. JACC Heart Fail 2021;9:722–32.
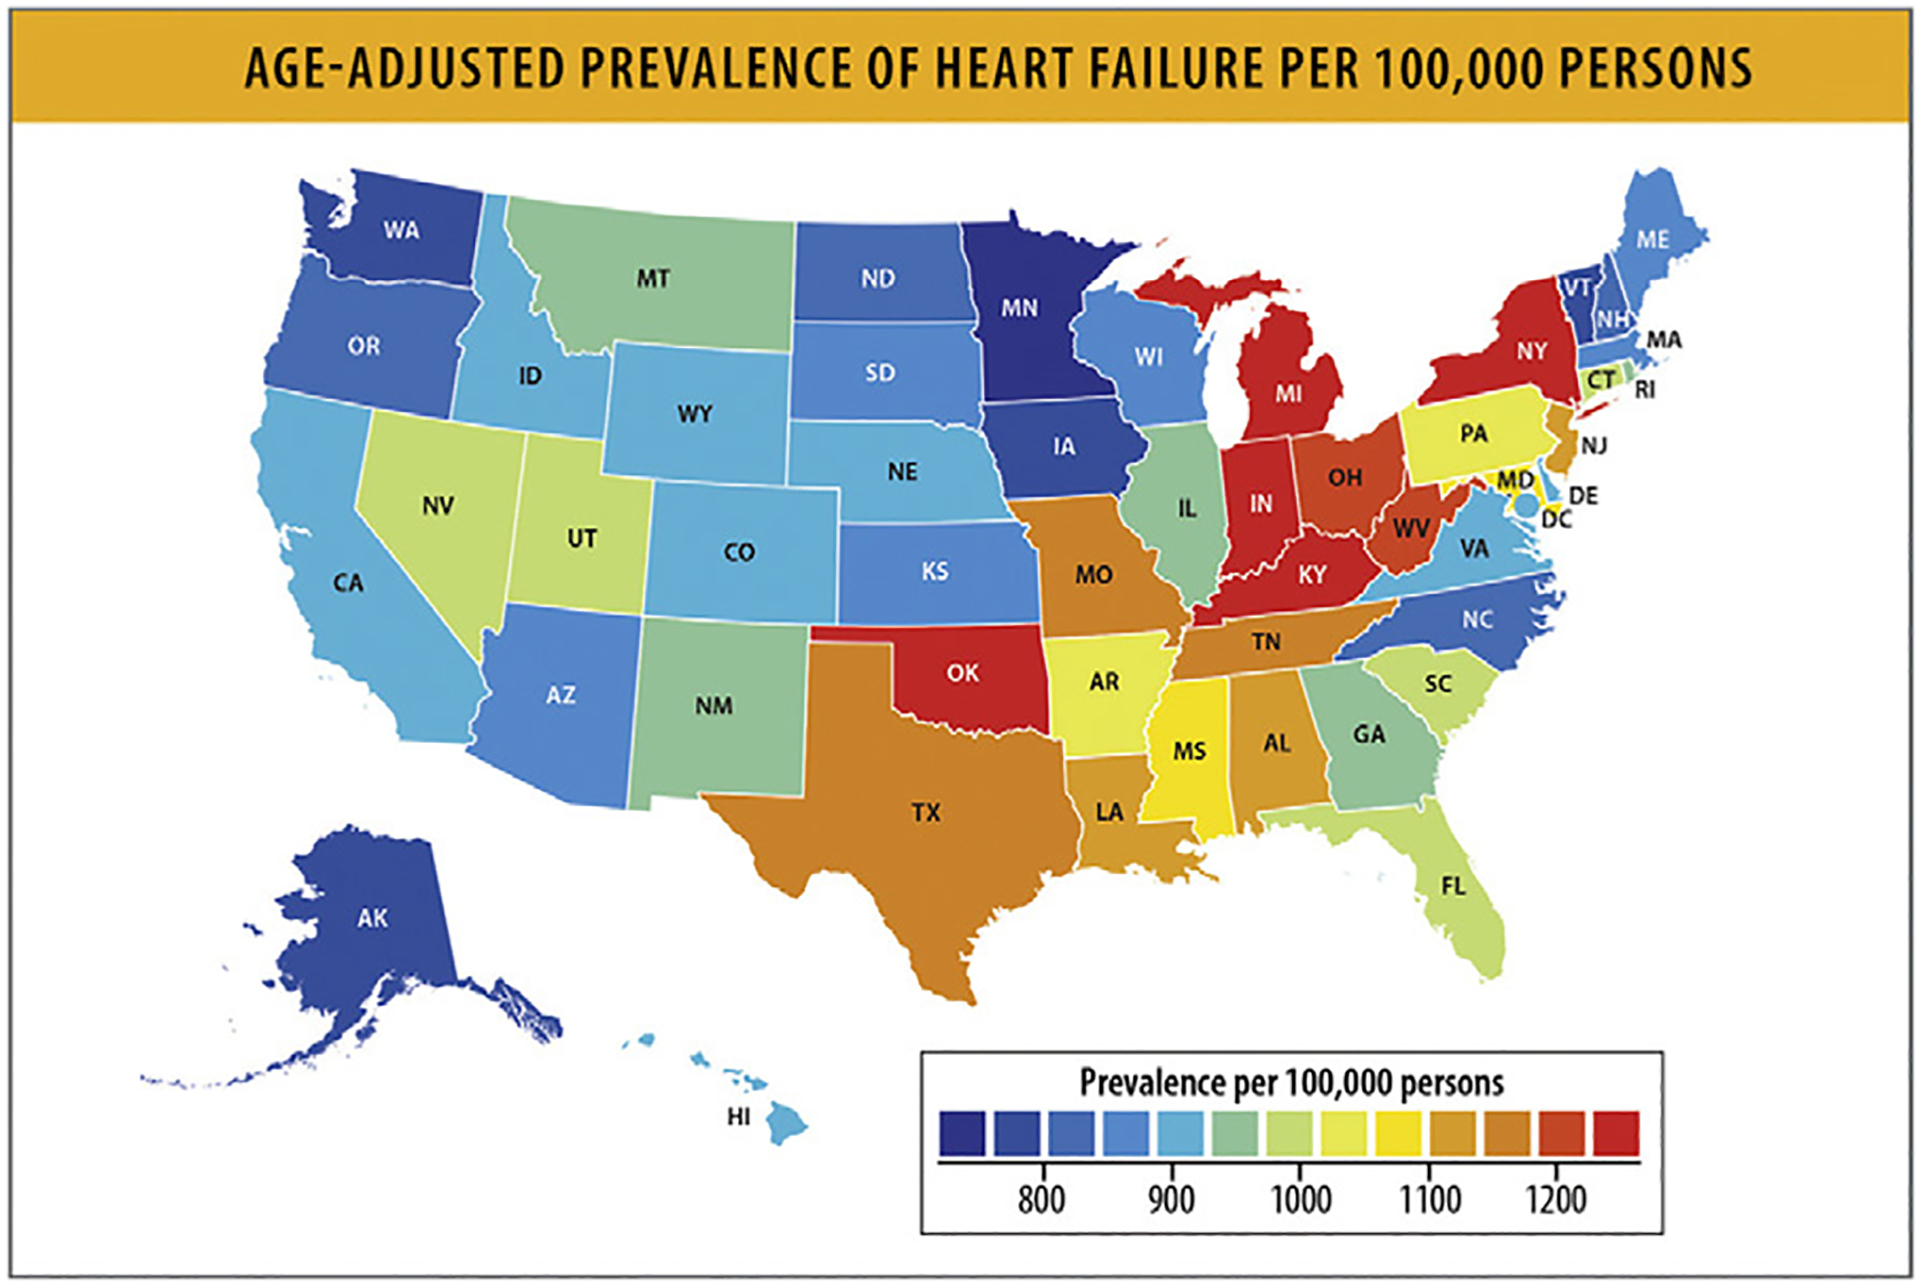
Age-adjusted prevalence of HF per 100,000 persons. HF = heart failure. Modified from Global Burden of Cardiovascular Diseases Collaboration; Roth GA, Johnson CO, Abate KH, Abd-Allah F, Ahmed M, et al. The burden of cardiovascular diseases among US states, 1990–2016. JAMA Cardiol 2018;3:375–389.
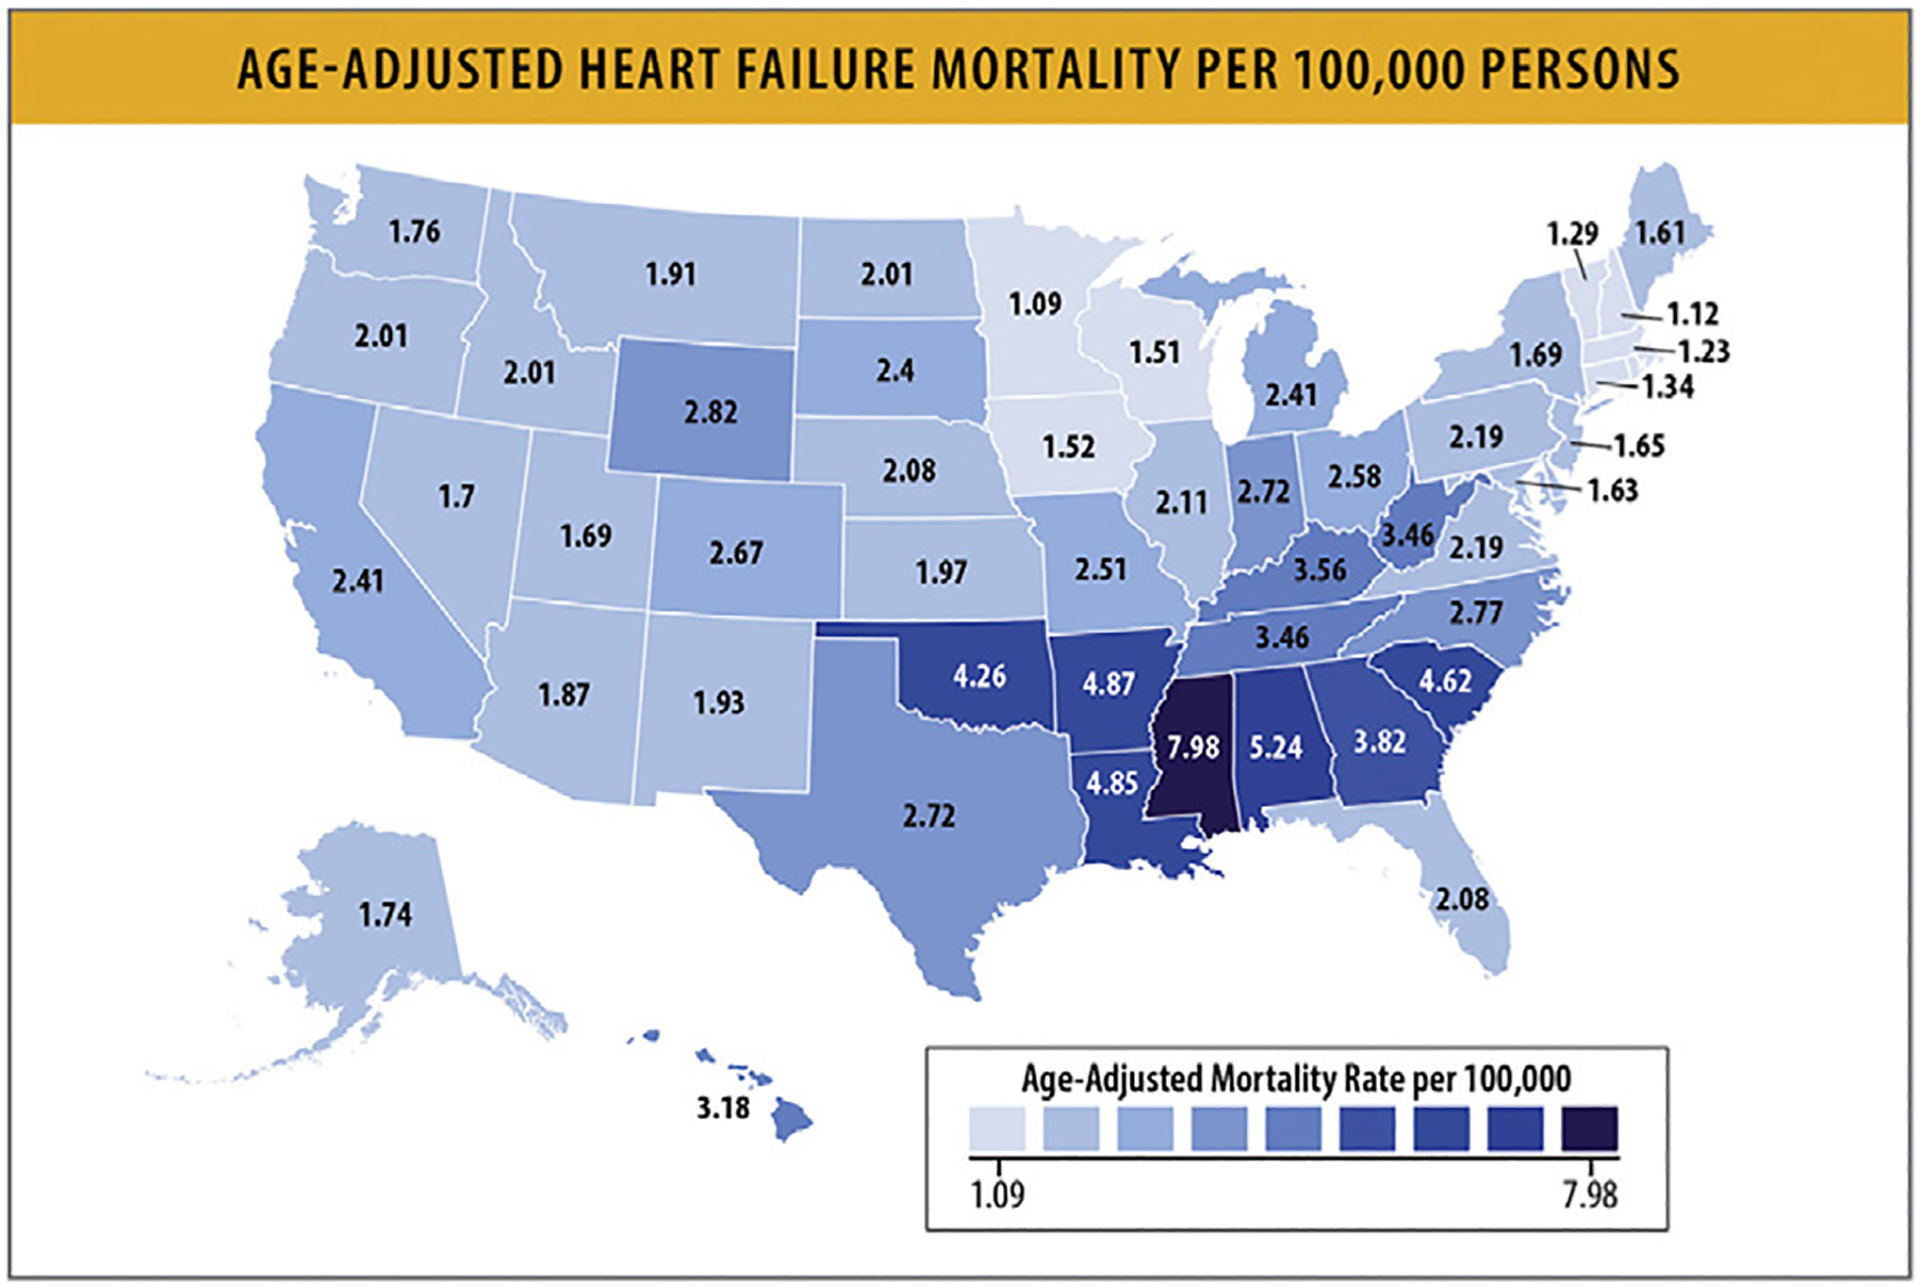
Age-adjusted HF mortality per 100,000 persons. HF = heart failure. Modified from Jain V, Minhas AMK, Morris AA, Greene SJ, Pandey A, Khan SS, et al. Demographic and regional trends of heart failure-related mortality in young adults in the US, 1999–2019. JAMA Cardiol 2022;7:900–4.
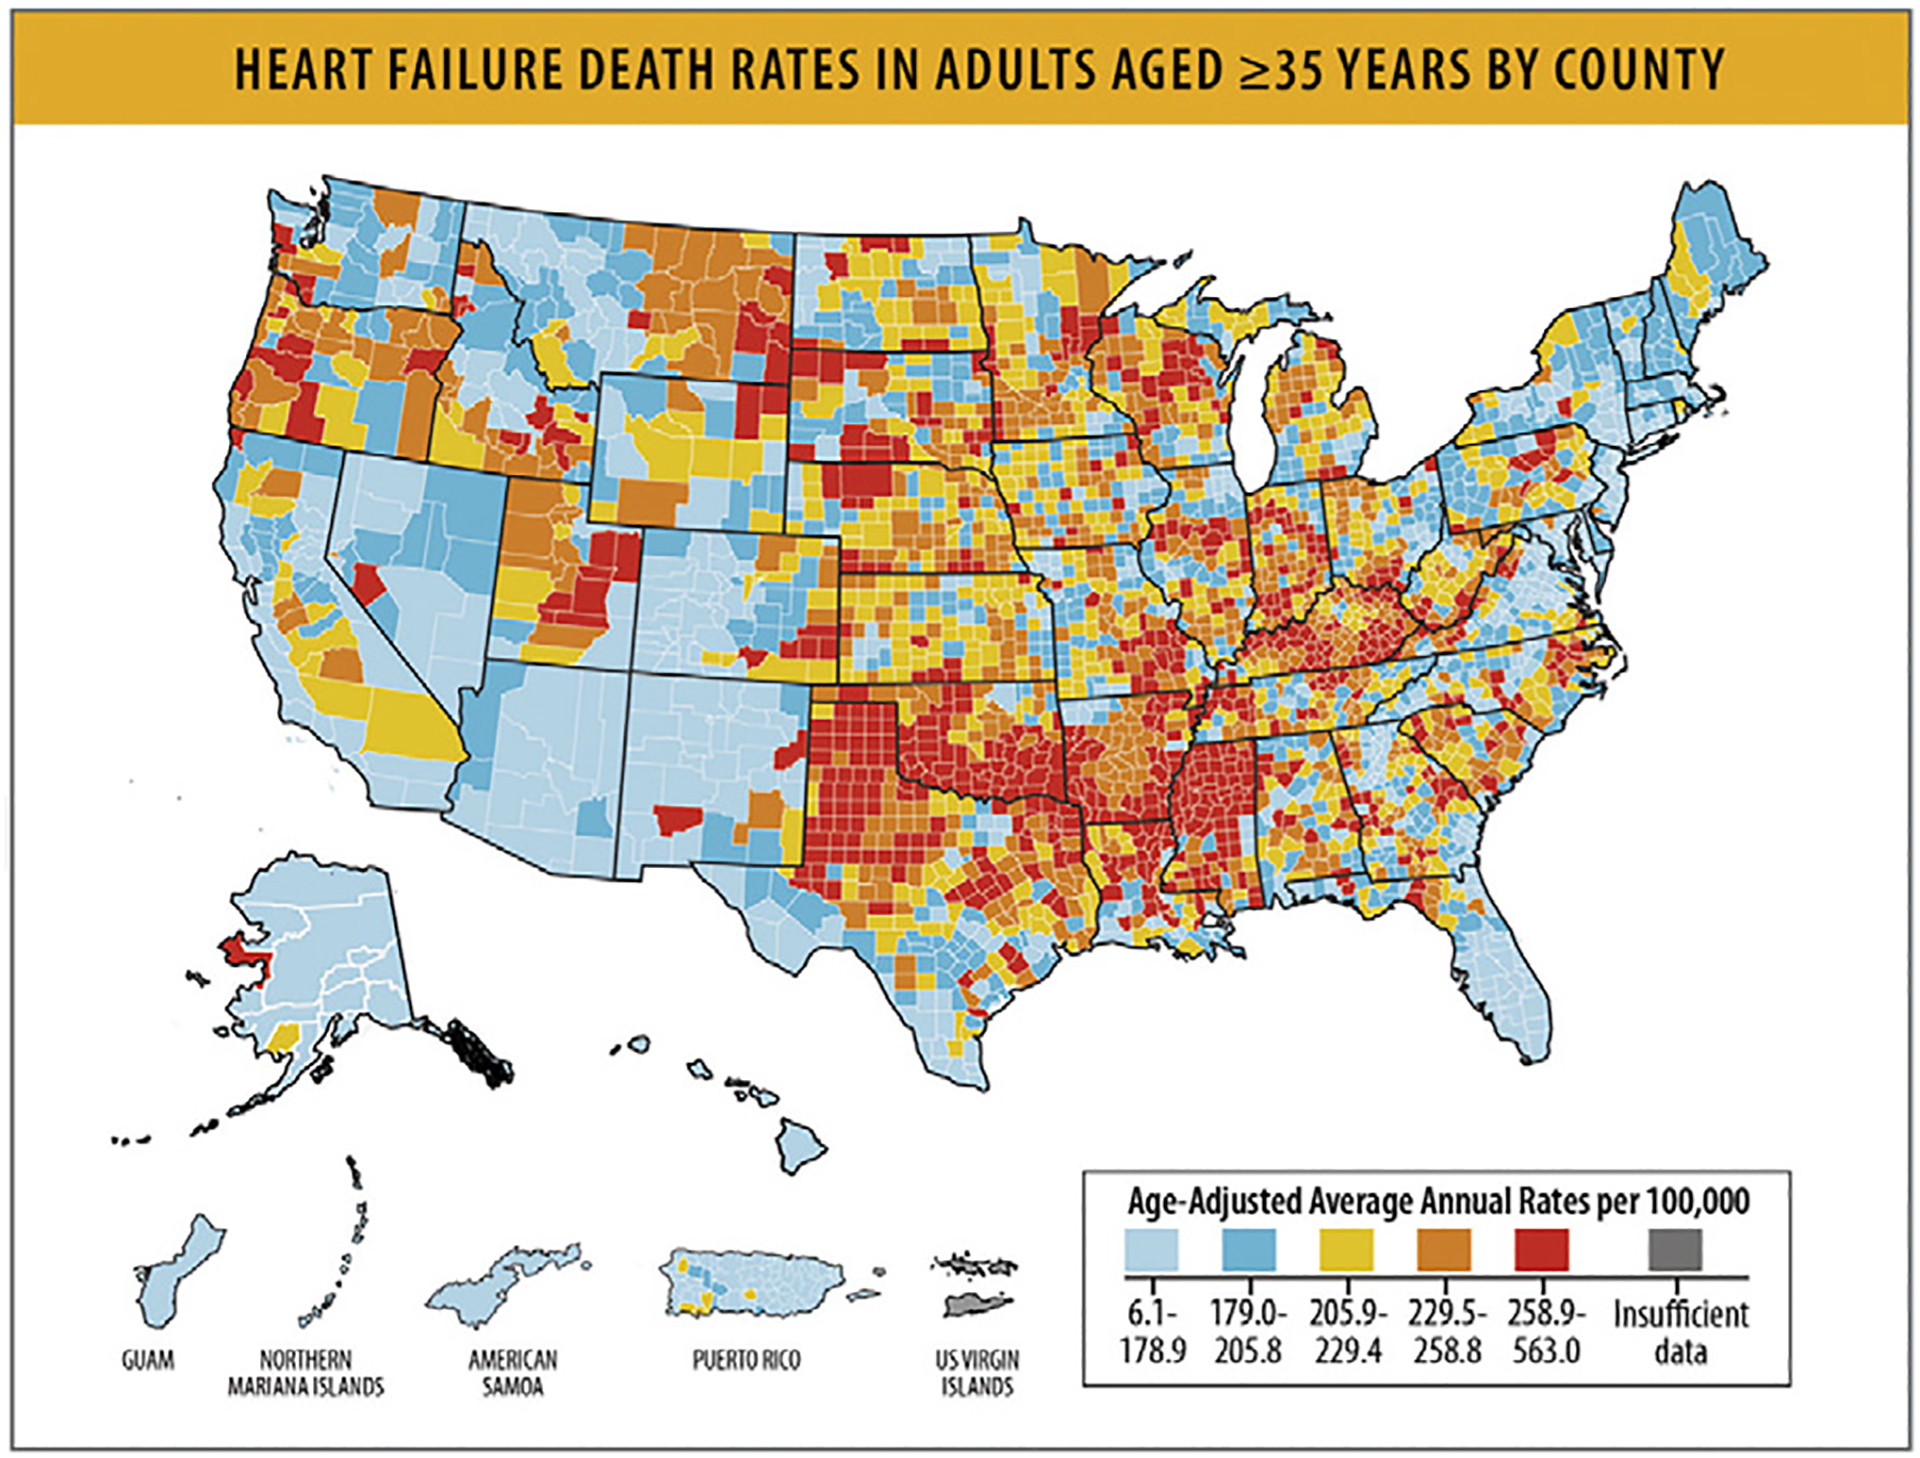
HF death rates in adults aged ≥35 years by county. HF = heart failure. Modified from Centers for Disease Control and Prevention. Heart Failure. 2023 [cited 2023 Jul 9]. Available from: https://www.cdc.gov/heartdisease/heart_failure.htm
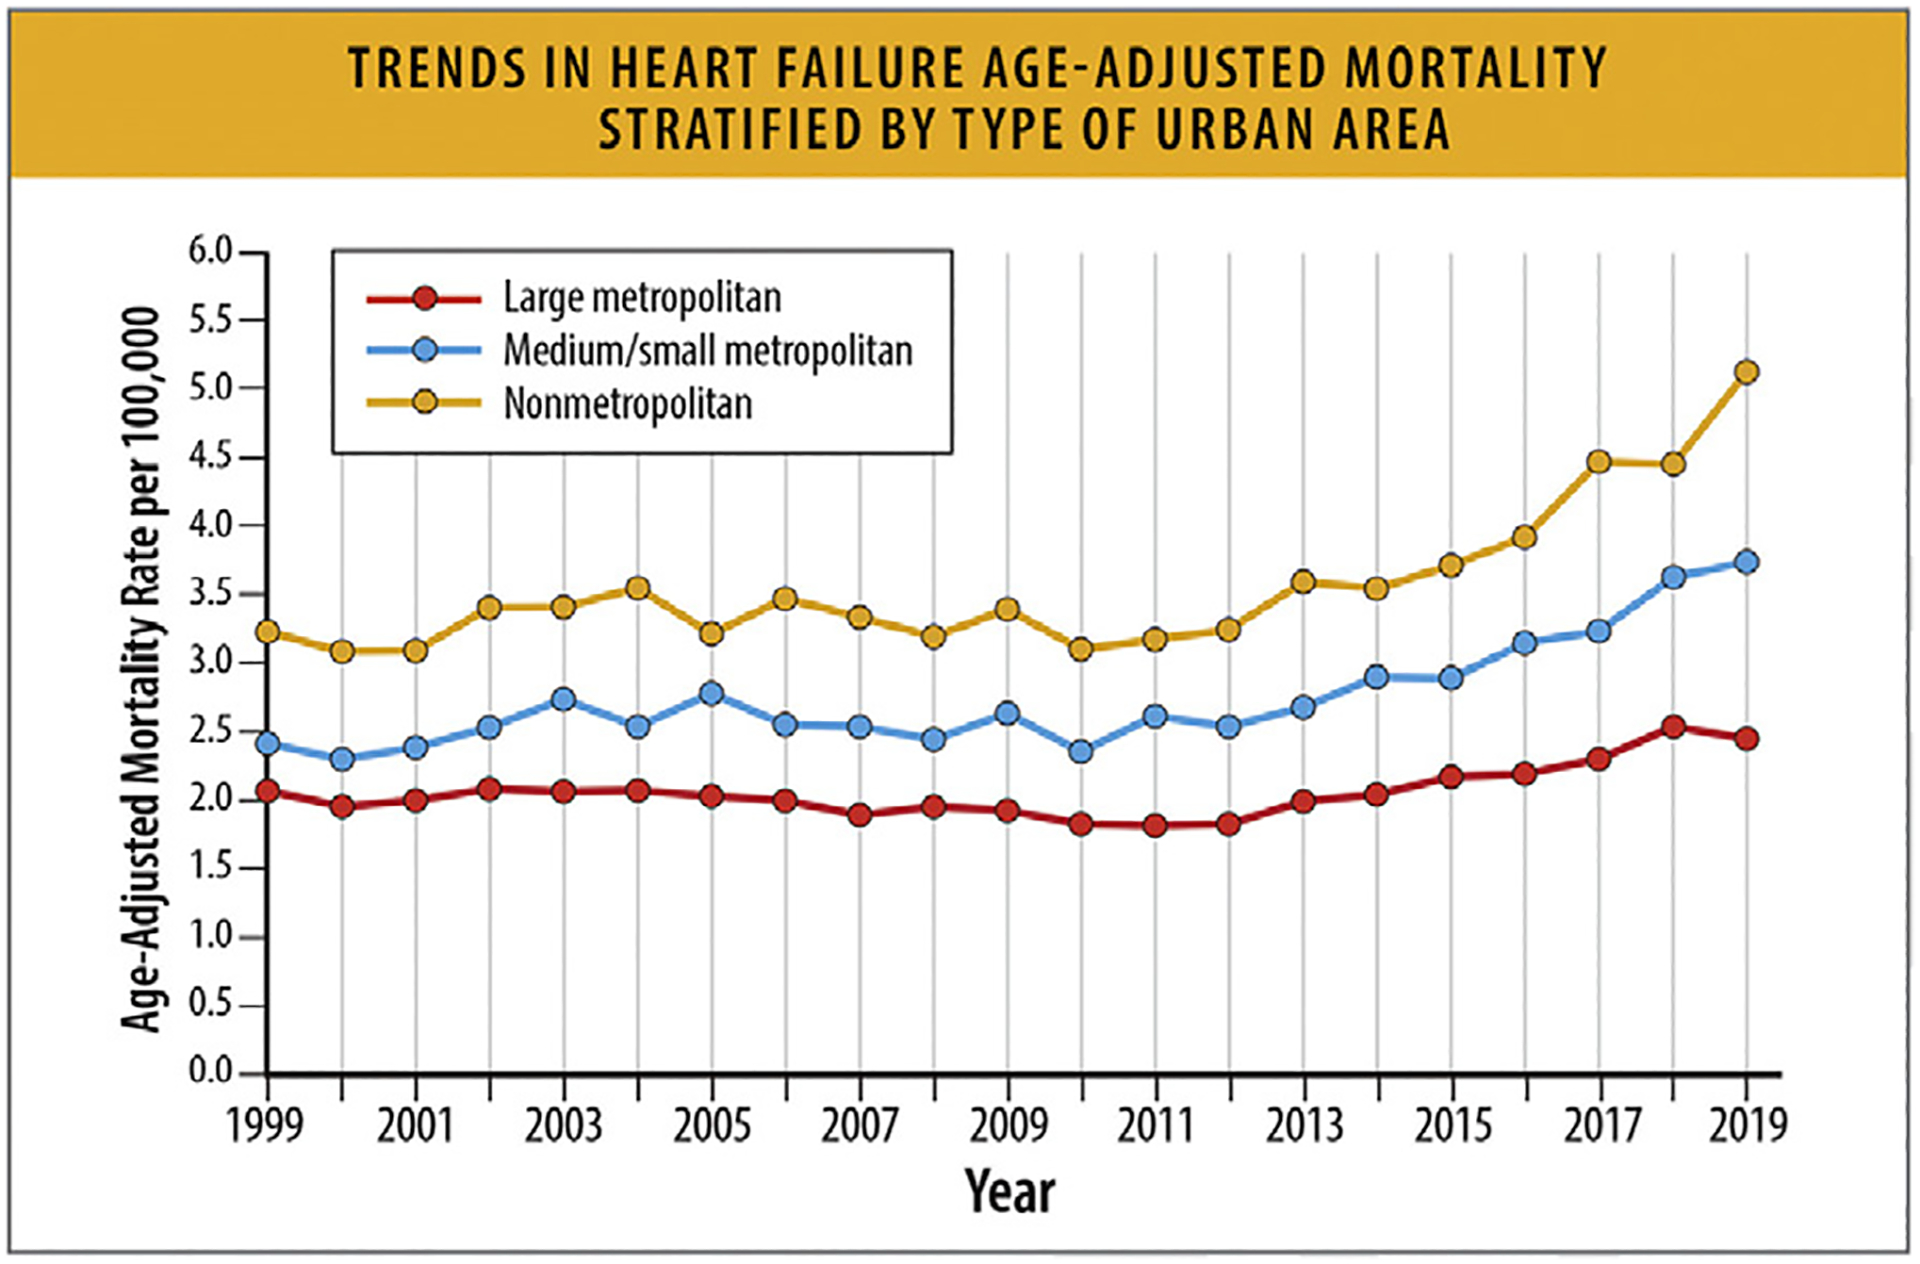
Trends in HF age-adjusted mortality stratified by type of urban area. HF = heart failure. Modified from Jain V, Minhas AMK, Morris AA, Greene SJ, Pandey A, Khan SS, et al. Demographic and regional trends of heart failure-related mortality in young adults in the US, 1999–2019. JAMA Cardiol 2022;7:900–4..
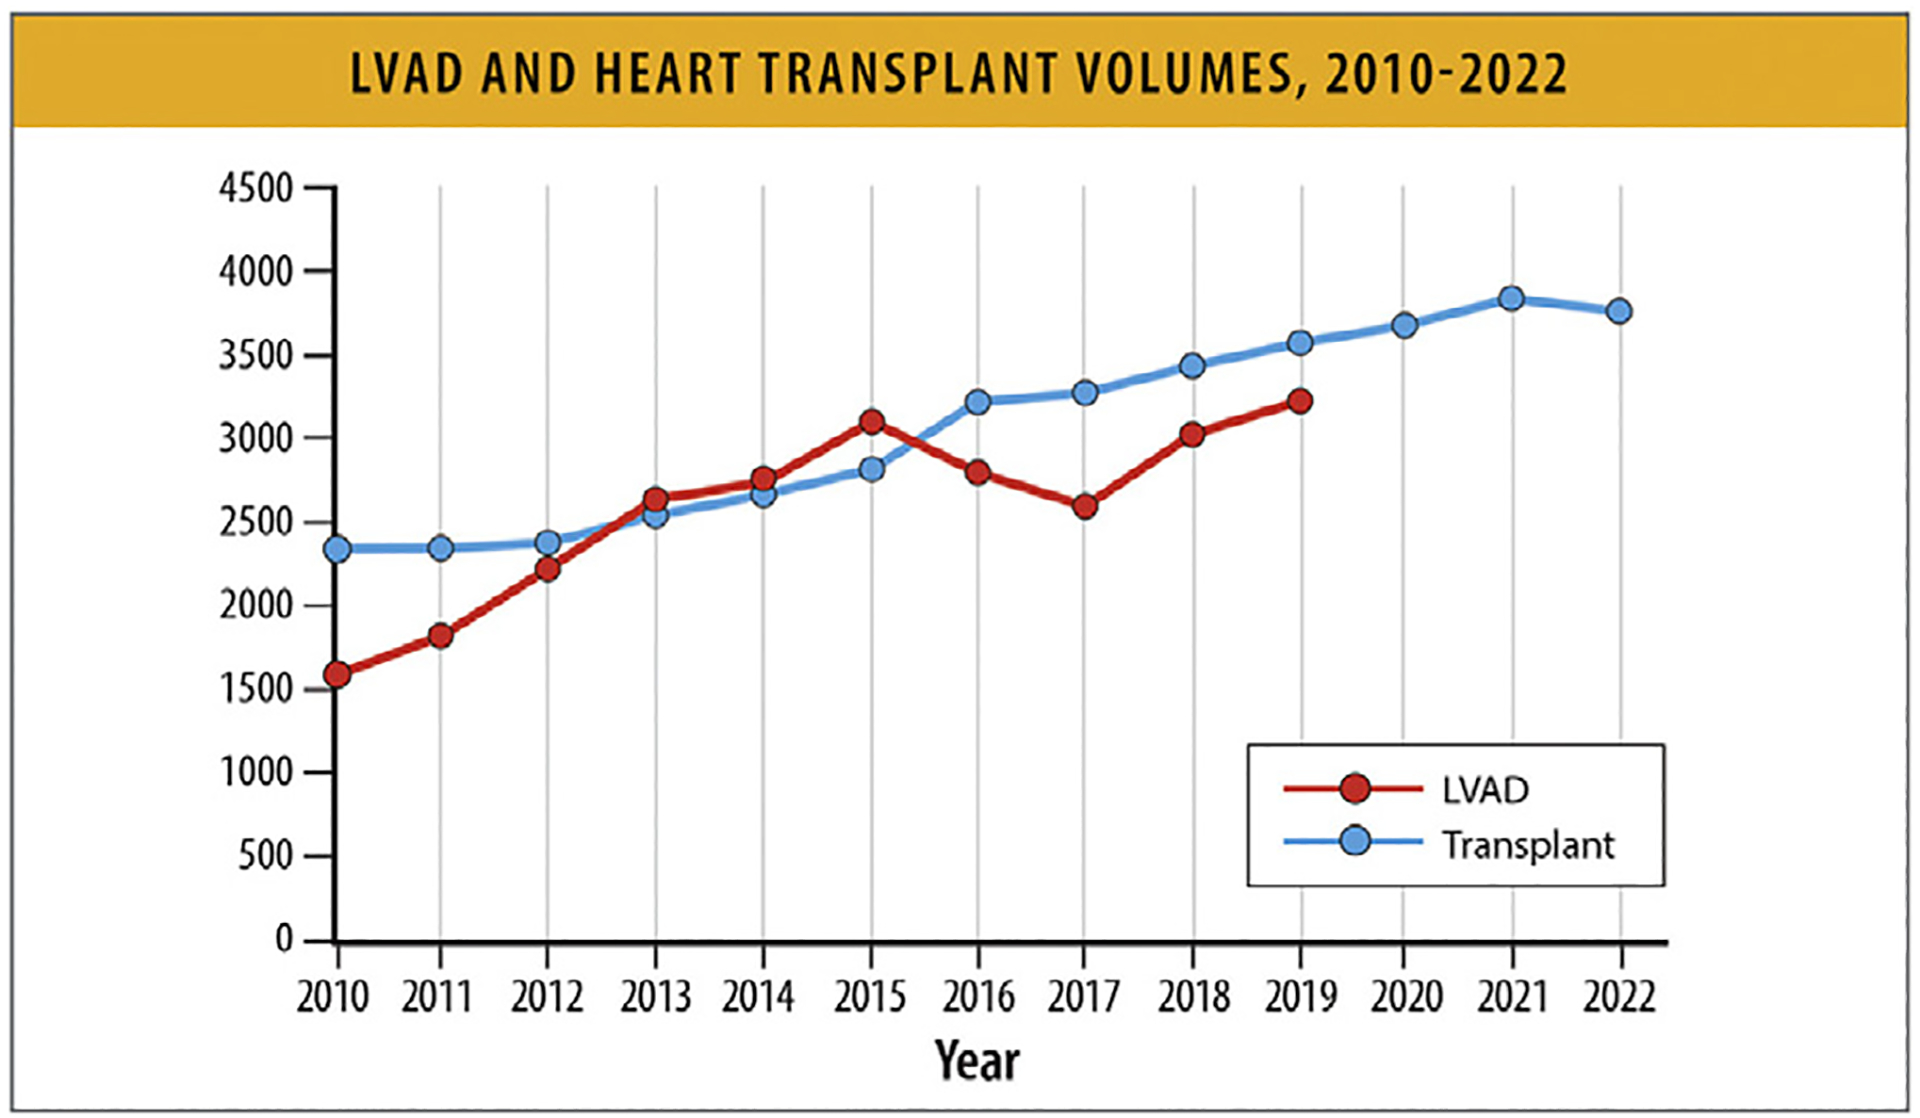
LVAD and heart transplant volumes, 2010–2022. LVAD = left ventricular assist device. Modified from Molina EJ, Shah P, Kiernan MS, Cornwell WK, Copeland H, Takeda K, et al. The Society of Thoracic Surgeons INTERMACS 2020 annual report. Ann Thorac Surg 2021;111:778–92; and Organ Procurement and Transplantation Network. National Data - Heart Transplant. [cited 2023 Jul 9]. Available from: https://optn.transplant.hrsa.gov/data/view-data-reports/national-data/#
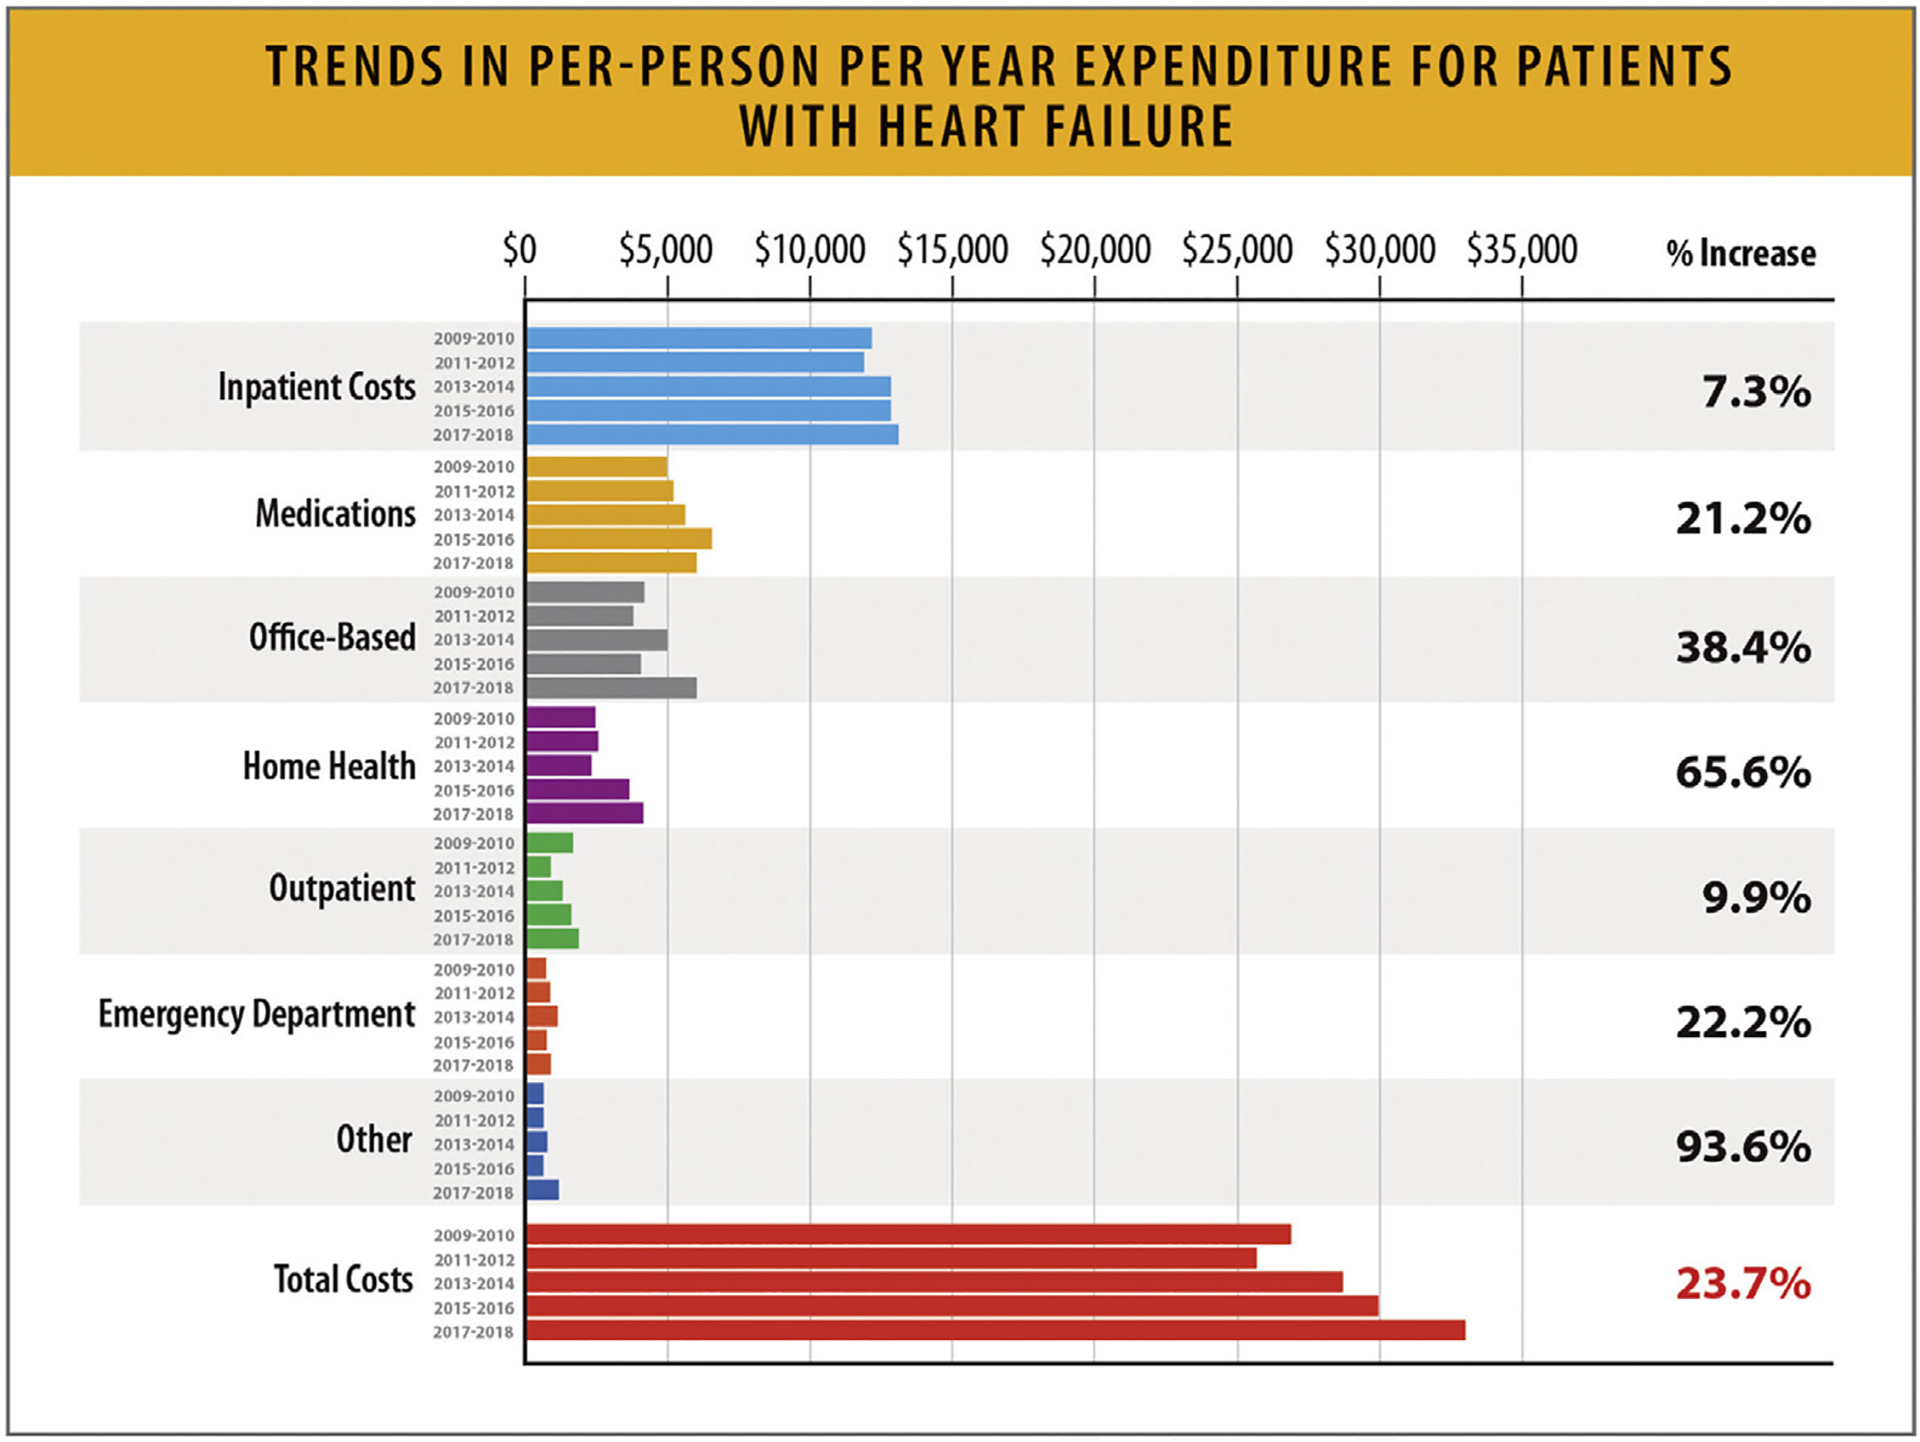
Trends in per-person per year expenditure for patients with HF. HF = heart failure. Modified from Bhatnagar R, Fonarow GC, Heidenreich PA, Ziaeian B. Expenditure on heart failure in the United States: the Medical Expenditure Panel Survey 2009–2018. JACC Heart Fail 2022;10:571–80.
