

Nanotopographical Cues Tune the Therapeutic Potential of Extracellular Vesicles for the Treatment of Aged Skeletal Muscle Injuries
- PMID: 37797946
- PMCID: PMC10603813
- DOI: 10.1021/acsnano.3c02269
Nanotopographical Cues Tune the Therapeutic Potential of Extracellular Vesicles for the Treatment of Aged Skeletal Muscle Injuries
Abstract
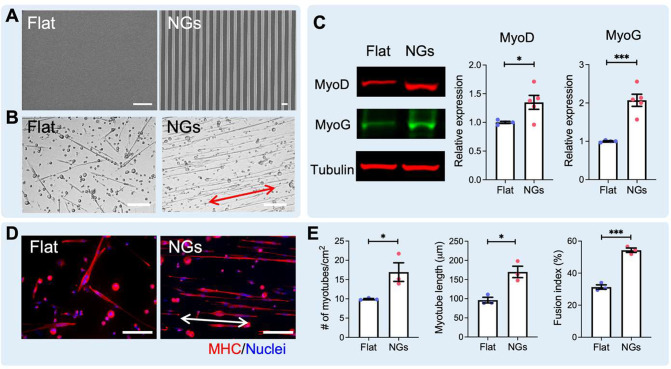
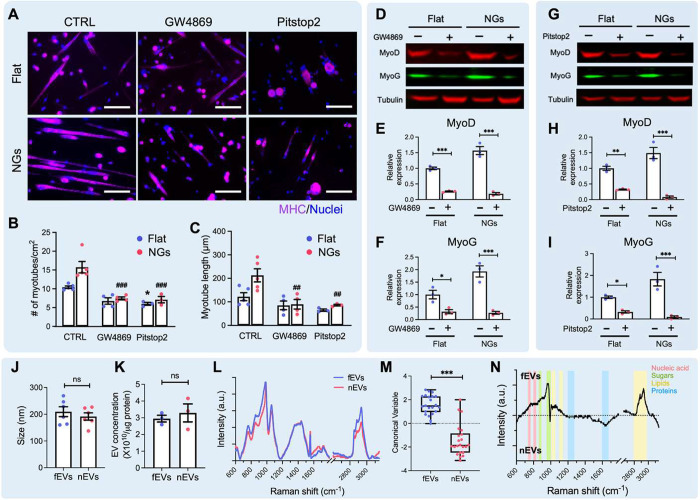
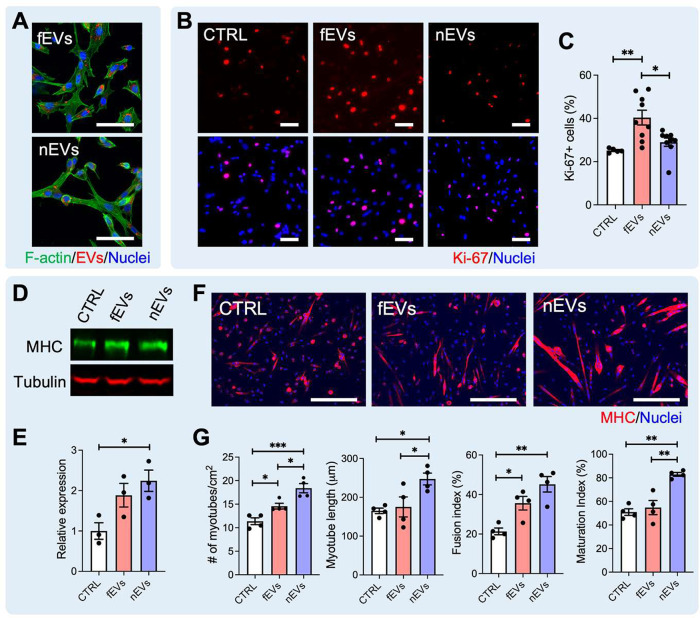
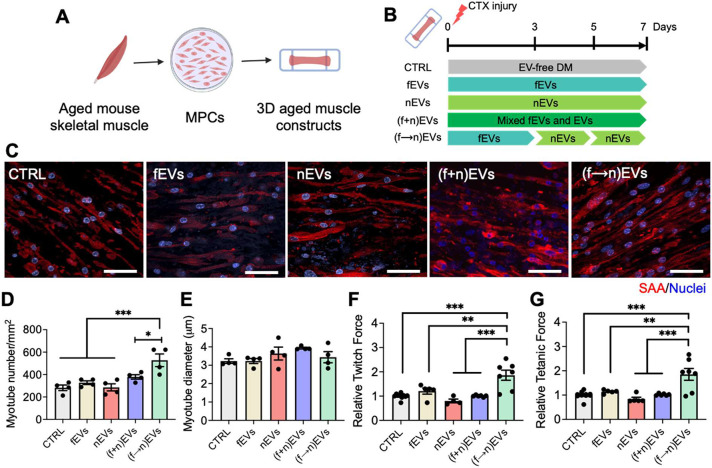
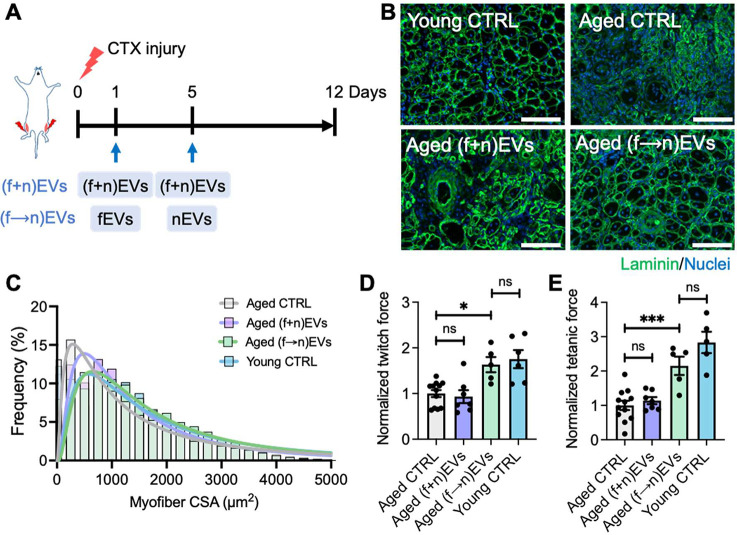
Skeletal muscle regeneration relies on the tightly temporally regulated lineage progression of muscle stem/progenitor cells (MPCs) from activation to proliferation and, finally, differentiation. However, with aging, MPC lineage progression is disrupted and delayed, ultimately causing impaired muscle regeneration. Extracellular vesicles (EVs) have attracted broad attention as next-generation therapeutics for promoting tissue regeneration. As a next step toward clinical translation, strategies to manipulate EV effects on downstream cellular targets are needed. Here, we developed an engineering strategy to tune the therapeutic potential of EVs using nanotopographical cues. We found that EVs released by young MPCs cultured on flat substrates (fEVs) promoted the proliferation of aged MPCs while EVs released by MPCs cultured on nanogratings (nEVs) promoted myogenic differentiation. We then employed a bioengineered 3D muscle aging model to optimize the administration protocol and test the therapeutic potential of fEVs and nEVs in a high-throughput manner. We found that the sequential administration first of fEVs during the phase of MPC proliferative expansion (i.e., 1 day after injury) followed by nEV administration at the stage of MPC differentiation (i.e., 3 days after injury) enhanced aged muscle regeneration to a significantly greater extent than fEVs and nEVs delivered either in isolation or mixed. The beneficial effects of the sequential EV treatment strategy were further validated in vivo, as evidenced by increased myofiber size and improved functional recovery. Collectively, our study demonstrates the ability of topographical cues to tune EV therapeutic potential and highlights the importance of optimizing the EV administration strategy to accelerate aged skeletal muscle regeneration.
Keywords: aging; cell-free therapy; exosomes; nanotopography; skeletal muscle repair.
Conflict of interest statement
The authors declare no competing financial interest.
Figures
Similar articles
-
Increased Stiffness in Aged Skeletal Muscle Impairs Muscle Progenitor Cell Proliferative Activity.PLoS One. 2015 Aug 21;10(8):e0136217. doi: 10.1371/journal.pone.0136217. eCollection 2015. PLoS One. 2015. PMID: 26295702 Free PMC article.
-
p21 is essential for normal myogenic progenitor cell function in regenerating skeletal muscle.Am J Physiol Cell Physiol. 2003 Nov;285(5):C1019-27. doi: 10.1152/ajpcell.00055.2003. Epub 2003 Jun 25. Am J Physiol Cell Physiol. 2003. PMID: 12826599
-
Muscle Precursor Cells Enhance Functional Muscle Recovery and Show Synergistic Effects With Postinjury Treadmill Exercise in a Muscle Injury Model in Rats.Am J Sports Med. 2021 Mar;49(4):1073-1085. doi: 10.1177/0363546521989235. Am J Sports Med. 2021. PMID: 33719605
-
Targeting Muscle Regeneration with Small Extracellular Vesicles from Adipose Tissue-Derived Stem Cells-A Review.Cells. 2025 May 9;14(10):683. doi: 10.3390/cells14100683. Cells. 2025. PMID: 40422186 Free PMC article. Review.
-
Therapeutic application of extracellular vesicles for musculoskeletal repair & regeneration.Connect Tissue Res. 2021 Jan;62(1):99-114. doi: 10.1080/03008207.2020.1781102. Epub 2020 Jun 30. Connect Tissue Res. 2021. PMID: 32602385 Review.
Cited by
-
A sandwich-like nanofibrous scaffold with macrophage phenotype transformation and myogenic differentiation for skeletal muscle regeneration.Bioact Mater. 2025 May 13;51:211-230. doi: 10.1016/j.bioactmat.2025.05.008. eCollection 2025 Sep. Bioact Mater. 2025. PMID: 40487245 Free PMC article.
-
Isolation of small extracellular vesicles from regenerating muscle tissue using tangential flow filtration and size exclusion chromatography.Skelet Muscle. 2024 Oct 11;14(1):22. doi: 10.1186/s13395-024-00355-1. Skelet Muscle. 2024. PMID: 39394606 Free PMC article.
-
Engineering multifunctional surface topography to regulate multiple biological responses.Biomaterials. 2025 Aug;319:123136. doi: 10.1016/j.biomaterials.2025.123136. Epub 2025 Jan 28. Biomaterials. 2025. PMID: 39978049 Review.
-
Integrating Physical and Biochemical Cues for Muscle Engineering: Scaffolds and Graft Durability.Bioengineering (Basel). 2024 Dec 9;11(12):1245. doi: 10.3390/bioengineering11121245. Bioengineering (Basel). 2024. PMID: 39768063 Free PMC article. Review.
-
Musculoskeletal Organs-on-Chips: An Emerging Platform for Studying the Nanotechnology-Biology Interface.Adv Mater. 2025 Jan;37(2):e2401334. doi: 10.1002/adma.202401334. Epub 2024 Mar 28. Adv Mater. 2025. PMID: 38491868 Free PMC article. Review.
References
Publication types
MeSH terms
Grants and funding
LinkOut - more resources
Full Text Sources
Research Materials
