. 2023 Sep;33(9):1439-1454.
doi: 10.1101/gr.277871.123. Epub 2023 Oct 5.

Deciphering D4Z4 CpG methylation gradients in fascioscapulohumeral muscular dystrophy using nanopore sequencing

Affiliations

Deciphering D4Z4 CpG methylation gradients in fascioscapulohumeral muscular dystrophy using nanopore sequencing

Russell J Butterfield et al. Genome Res. 2023 Sep.

Abstract

Fascioscapulohumeral muscular dystrophy (FSHD) is caused by a unique genetic mechanism that relies on contraction and hypomethylation of the D4Z4 macrosatellite array on the Chromosome 4q telomere allowing ectopic expression of the DUX4 gene in skeletal muscle. Genetic analysis is difficult because of the large size and repetitive nature of the array, a nearly identical array on the 10q telomere, and the presence of divergent D4Z4 arrays scattered throughout the genome. Here, we combine nanopore long-read sequencing with Cas9-targeted enrichment of 4q and 10q D4Z4 arrays for comprehensive genetic analysis including determination of the length of the 4q and 10q D4Z4 arrays with base-pair resolution. In the same assay, we differentiate 4q from 10q telomeric sequences, determine A/B haplotype, identify paralogous D4Z4 sequences elsewhere in the genome, and estimate methylation for all CpGs in the array. Asymmetric, length-dependent methylation gradients were observed in the 4q and 10q D4Z4 arrays that reach a hypermethylation point at approximately 10 D4Z4 repeat units, consistent with the known threshold of pathogenic D4Z4 contractions. High resolution analysis of individual D4Z4 repeat methylation revealed areas of low methylation near the CTCF/insulator region and areas of high methylation immediately preceding the DUX4 transcriptional start site. Within the DUX4 exons, we observed a waxing/waning methylation pattern with a 180-nucleotide periodicity, consistent with phased nucleosomes. Targeted nanopore sequencing complements recently developed molecular combing and optical mapping approaches to genetic analysis for FSHD by adding precision of the length measurement, base-pair resolution sequencing, and quantitative methylation analysis.


Figures

Figure 1.
Figure 1.
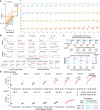
Cas9-targeted nanopore sequencing of D4Z4 repeats. (A) Schematic of 4q and 10q D4Z4 repeat arrays with a hypomethylated 5U array shown on the permissive 4qA haplotype. (B) Locations of Cas9-guide RNA cleavage sites at the centromeric (p13E-11) end, within the D4Z4 repeat, and at the telomeric (pLAM) end. Steps used in the sequencing pipeline for identifying targeted reads are shown. (C) Read depth Manhattan plots from two FSHD1 participants (P1, P5) mapped to the T2T CHM13 v2.0 reference genome (log2 scale, minimum depth = 2 reads, summarized in 2 kb, nonoverlapping windows). Colors indicate reads mapped to the 4q and 10q D4Z4 arrays, as well as divergent DUX4 clusters. (D) Integrative Genomics Viewer (IGV) (Robinson et al. 2011) alignments from minimap2 assembly of targeted reads from FSHD1 participant P1 with a 4qA 5U contraction mapped to the 4qA D4Z4 region (upper panel) and a Chr 22, divergent DUX4 cluster (lower panel). LSAU-BSAT composite annotations are from the T2T-CHM13 RepeatMasker (http://www.repeatmasker.org) track and arrows indicate the location of the p13E-11/pLAM Cas9 cleavage sites.
Figure 2.
Figure 2.
CpG methylation gradients traverse Chr 4q and 10q D4Z4 arrays. (A) Methylation levels of p13E-11 to pLAM targeted reads summarized as % 5mC sites per 3.3 kb KpnI-to-KpnI D4Z4 repeat. Repeat numbering starts at the centromeric end and is reversed for the pLAM (telomeric) reads. (B) Single-read modbamtools plots of reads from (A). The schematic D4Z4 repeats show the CTCF insulator (green) and DUX4 exons (blue), and a green stripe at the 10th centromeric D4Z4 repeat. (C) Alignments and methylation plots of untargeted reads (R10.4.1_e8.2 nanopores) from a control subject (C4) mapped to a 4qB 16U haplotype, 4qA 42U haplotype, 10q 20U haplotype, and 10q 21U haplotype. The gray stripe delineates the start of the syntenic telomeric region shared between 4q and 10q, and the green stripe marks the 10th D4Z4 repeat.
Figure 3.
Figure 3.
Methylation gradient modeling. (A) Intercept and slope estimates from 68 p13E-11 to pLAM 5U reads from participant P1. The red line is the model estimate and the thin lines are the individual read estimates with a color scale for read-level % 5mC. The right panel shows the D4Z4 repeat-level methylation frequency (points) and the estimate (line) for each read, ordered by read-level % 5mC. (B) Intercept and slope estimates as in (A) from FSHD1, FSHD2 participants, and control subject C4 (see Table 2). (C) Model for gradient formation via basal D4Z4 methylation followed by unbalanced bidirectional spreading (colored arrows). (D) Predicted D4Z4 methylation levels from simulated basal methylation and spreading (red points) compared to observed values [blue points, mean methylation per repeat, data from (B)]. In the lower panel, the basal methylation and spreading parameters were reduced by a factor of 2.
Figure 4.
Figure 4.
Fine-scale D4Z4 repeat methylation patterns. (A) Methylation frequency and modbamtools plots of the 4qA 5U reads from participant P1 using the “smooth_ksmooth” function (smoothness parameter = 10) and single-read plots using modbamtools. (B) An annotated methylartist plot of the 3.3 kb R1 and R5 repeats from a subset of reads in (A) with 322 CpG residues represented as blue (unmethylated) or red (methylated) dots. The middle panel shows the average methylation frequency for the CpGs aligned from R1 through R5 from the 5U reads in (A). The lower panel shows the smoothed methylation frequency plot for each repeat, with the expanded location of six CpG residues in the region containing the DUX4 proximal promoter and transcription start from Dixit et al. (AF117653.3). (C) Methylation levels of individual 3.3 kb D4Z4-cut reads with % 5mC per read on the y-axis, and annotated for 10q, 4qA, and 4qB read counts and their mean/median methylation levels. Upper plot = FSHD1 trio segregating a pathogenic 5U repeat; lower plot = unaffected versus FSHD2 participants. (D) Smoothed methylation frequency plots of D4Z4-cut reads from (C). (E) % 5mC and nucleosome occupancy and methylation sequencing (NOMe-seq) GpC Z-scores plotted for the second Chr 4 D4Z4 repeat (centromeric) using in vivo/in vitro methylation data from the HG002/NA24385 lymphoblastoid cell line.
Figure 5.
Figure 5.
Methylation profiles of divergent D4Z4 repeats. (A) Copy number and structure of D4Z4-pLAM repeats found in the T2T CHM13 v2.0 genome (see Supplemental Table S4 for genomic locations and Fig. 1 for LSAU-BSAT composite annotations). (B) Methylation profile of a Chr 22 full-length, divergent D4Z4 repeat. The LASTZ percent identity (PIP) plot shows the distribution of sequence identity along the length of this repeat compared to the distal Chr 4qA-S D4Z4 repeat. (C) Methylation plots of reads mapping to Chr 22:9,317,908–9,717,807 region from the C4 control (R10.4.1_e8.2 nanopores). (D) Distributions of CpG methylation levels of divergent versus 4qA D4Z4 repeats. Each point represents the % 5mC of a single read within the region that aligns completely with the divergent repeat (Full or Truncated_5′) or the 3.3 kb 4qA D4Z4 repeat. The C3 sample was sequenced using R10.4.1_e8.2 nanopores.
Figure 6.
Figure 6.
Methylation gradients in other CpG-dense repeat regions. (A) Manhattan plot of CpG density in 33 kb sliding windows (step size = 3.3 kb) across the T2T CHM13 v2.0 genome. Windows above 7% CpG density are marked as green dots. Alignment and methylation plots of untargeted reads from the C4 control (R10.4.1_e8.2 nanopores) mapped to (B) the LM-tRNA cluster on Chromosome 1 and (C) the 5S rRNA cluster on Chromosome 1. Mapped reads are anchored by unique flanking sequence and the two ends of the 5S rRNA cluster are shown separately.

Update of

References

    1. Bouwman LF, den Hamer B, van den Heuvel A, Franken M, Jackson M, Dwyer CA, Tapscott SJ, Rigo F, van der Maarel SM, de Greef JC. 2021. Systemic delivery of a DUX4-targeting antisense oligonucleotide to treat facioscapulohumeral muscular dystrophy. Mol Ther Nucleic Acids 26: 813–827. 10.1016/j.omtn.2021.09.010 - DOI - PMC - PubMed
    1. Calandra P, Cascino I, Lemmers RJLF, Galluzzi G, Teveroni E, Monforte M, Tasca G, Ricci E, Moretti F, van der Maarel SM, et al. 2016. Allele-specific DNA hypomethylation characterises FSHD1 and FSHD2. J Med Genet 53: 348–355. 10.1136/jmedgenet-2015-103436 - DOI - PubMed
    1. Campbell AE, Shadle SC, Jagannathan S, Lim JW, Resnick R, Tawil R, van der Maarel SM, Tapscott SJ. 2018. NuRD and CAF-1-mediated silencing of the D4Z4 array is modulated by DUX4-induced MBD3L proteins. eLife 7: e31023. 10.7554/eLife.31023 - DOI - PMC - PubMed
    1. Chen JC, King OD, Zhang Y, Clayton NP, Spencer C, Wentworth BM, Emerson CP Jr., Wagner KR. 2016. Morpholino-mediated knockdown of DUX4 toward facioscapulohumeral muscular dystrophy therapeutics. Mol Ther 24: 1405–1411. 10.1038/mt.2016.111 - DOI - PMC - PubMed
    1. Cohen J, DeSimone A, Lek M, Lek A. 2021. Therapeutic approaches in facioscapulohumeral muscular dystrophy. Trends Mol Med 27: 123–137. 10.1016/j.molmed.2020.09.008 - DOI - PMC - PubMed

Publication types

MeSH terms

Substances

LinkOut - more resources