. 2023 Oct 5;14(1):6206.
doi: 10.1038/s41467-023-41941-z.

Viral kinetics of sequential SARS-CoV-2 infections

Affiliations

Viral kinetics of sequential SARS-CoV-2 infections

Stephen M Kissler et al. Nat Commun. .

Abstract

The impact of a prior SARS-CoV-2 infection on the progression of subsequent infections has been unclear. Using a convenience sample of 94,812 longitudinal RT-qPCR measurements from anterior nares and oropharyngeal swabs, we identified 71 individuals with two well-sampled SARS-CoV-2 infections between March 11th, 2020, and July 28th, 2022. We compared the SARS-CoV-2 viral kinetics of first vs. second infections in this group, adjusting for viral variant, vaccination status, and age. Relative to first infections, second infections usually featured a faster clearance time. Furthermore, a person's relative (rank-order) viral clearance time, compared to others infected with the same variant, was roughly conserved across first and second infections, so that individuals who had a relatively fast clearance time in their first infection also tended to have a relatively fast clearance time in their second infection (Spearman correlation coefficient: 0.30, 95% credible interval (0.12, 0.46)). These findings provide evidence that, like vaccination, immunity from a prior SARS-CoV-2 infection shortens the duration of subsequent acute SARS-CoV-2 infections principally by reducing viral clearance time. Additionally, there appears to be an inherent element of the immune response, or some other host factor, that shapes a person's relative ability to clear SARS-CoV-2 infection that persists across sequential infections.


Conflict of interest statement

S.M.K. has a consulting agreement with the NBA and Moderna Therapeutics. J.A.H. declares no competing interests. J.R.F. has a consulting agreement for Tempus and receives financial support from Tempus to develop SARS-CoV-2 diagnostic tests. C.M. is an employee of IQVIA, Real World Solutions. C.G.T. is an employee of IQVIA, Real World Solutions. D.J.A. is co-owner of Infection Control Education for Major Sports. D.D.H. declares no competing interests. N.D.G. has a consulting agreement for Tempus and receives financial support from Tempus to develop SARS-CoV-2 diagnostic tests. Y.H.G. has a consulting agreement with the NBA.

Figures
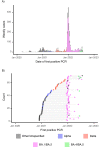
Fig. 1
Fig. 1. Onset times of repeat and overall infections in the dataset.
A Histogram of first positive test dates for all recorded infections in full dataset (n = 3346). Colors in both panels correspond to the SARS-CoV-2 variant category (Other/Unspecified: Black; Alpha: Blue; Delta: Red; BA.1/BA.2: Magenta; BA.4/BA.5: Green), where Other/Unspecified include all non-Alpha, Delta, and Omicron lineages and any samples that could not be sequenced. B Date of the first positive test (points) for well-documented infections in individuals with two well-documented infections (n = 71). Horizontal lines connect the points that correspond to infections that belong to the same person.
Fig. 2
Fig. 2. Viral kinetics of first vs. second infections.
A, B Mean posterior viral trajectory (solid lines) with 95% credible interval (shaded region) for well-documented first infections (A) and second infections (B) in the 71 individuals with two well-documented infections. C, D Mean posterior viral trajectory (solid lines) with 95% credible interval (shaded region) for all well-documented first infections (n = 1796, C) and second infections (n = 193, D) in the dataset. In all panels, gray points depict the measured viral concentration for a single test. For each person, the points were shifted horizontally so that the individual’s mean posterior peak viral concentration sits at day 0. Black points and whiskers (A, C) depict the mean and 95% credible interval for the proliferation time, peak viral concentration, and clearance time, from left to right, for first infections. These values are repeated in gray on the lower plots (B, D) to facilitate comparison with the viral kinetics of second infections.
Fig. 3
Fig. 3. Association between first- and second-infection viral kinetics.
Scatterplots of the adjusted, model-estimated A peak viral load, B proliferation time, and C clearance time for second infections (vertical axis) vs. first infections (horizontal axis) in the 71 individuals with two well-documented infections. Each point depicts a single posterior draw for the corresponding viral kinetic parameter belonging to a single person’s first and second recorded infection, across a total of 200 draws. Dashed lines depict the least squares linear regression to these posterior values (points), such that a positive slope indicates a positive correlation between the viral kinetic parameter between first and second infections. Posterior estimates and 95% credible intervals for the slope are listed at the top of each plot, where “n.s.” denotes “not significant,” corresponding to a 95% credible interval that crosses 0. Contours aid in visualizing the density of the posterior draws.

References

    1. Klaassen, F. et al. Changes in population immunity against infection and severe disease from severe acute respiratory syndrome coronavirus 2 (SARS-CoV-2) omicron variants in the United States between December 2021 and November 2022. Clin. Infect. Dis.75, 355–361 (2023). - PMC - PubMed
    1. Kojima N, Shrestha NK, Klausner JD, Systematic A. Review of the protective effect of prior SARS-CoV-2 infection on repeat infection. Eval. Health Prof. 2021;44:327–332. doi: 10.1177/01632787211047932. - DOI - PMC - PubMed
    1. Abu-Raddad LJ, Chemaitelly H, Bertollini R. Severity of SARS-CoV-2 reinfections as compared with primary infections. N. Engl. J. Med. 2021;385:2487–2489. doi: 10.1056/NEJMc2108120. - DOI - PMC - PubMed
    1. Bowe B, Xie Y, Al-Aly Z. Acute and postacute sequelae associated with SARS-CoV-2 reinfection. Nat. Med. 2022;28:2398–2405. doi: 10.1038/s41591-022-02051-3. - DOI - PMC - PubMed
    1. Hay JA, et al. Quantifying the impact of immune history and variant on SARS-CoV-2 viral kinetics and infection rebound: a retrospective cohort study. eLife. 2022;11:e81849. doi: 10.7554/eLife.81849. - DOI - PMC - PubMed

Publication types