. 2023 Oct 5;14(1):6194.
doi: 10.1038/s41467-023-41637-4.

The proton channel OTOP1 is a sensor for the taste of ammonium chloride

Affiliations

The proton channel OTOP1 is a sensor for the taste of ammonium chloride

Ziyu Liang et al. Nat Commun. .

Abstract

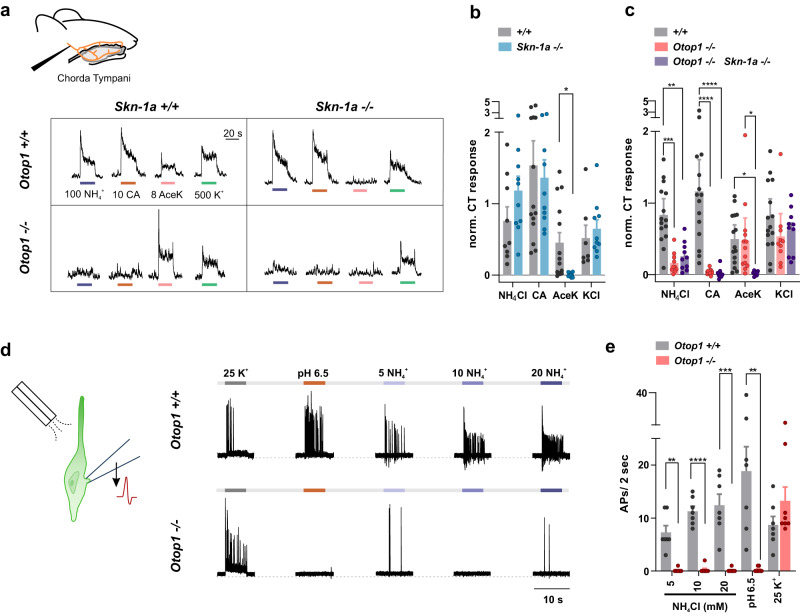
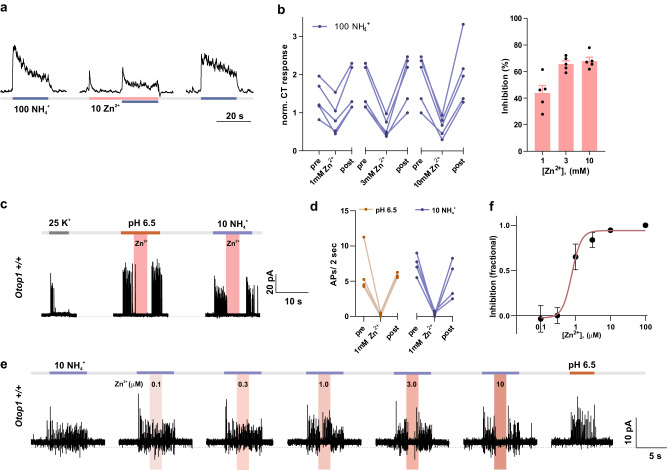
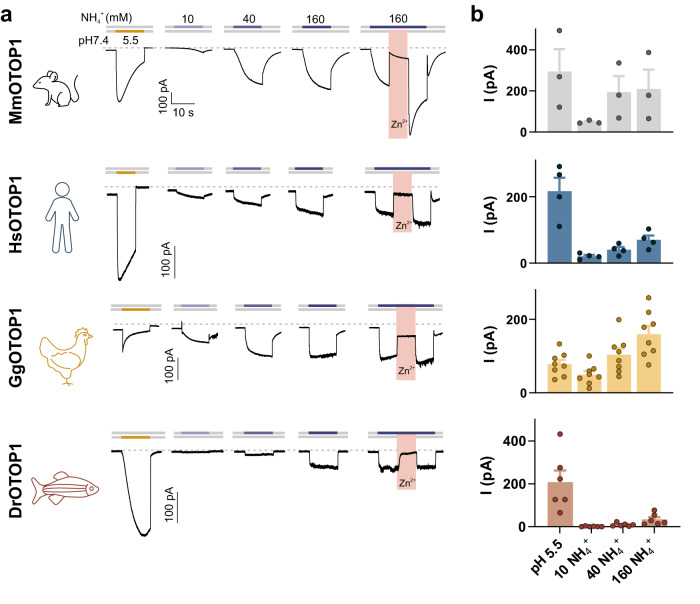
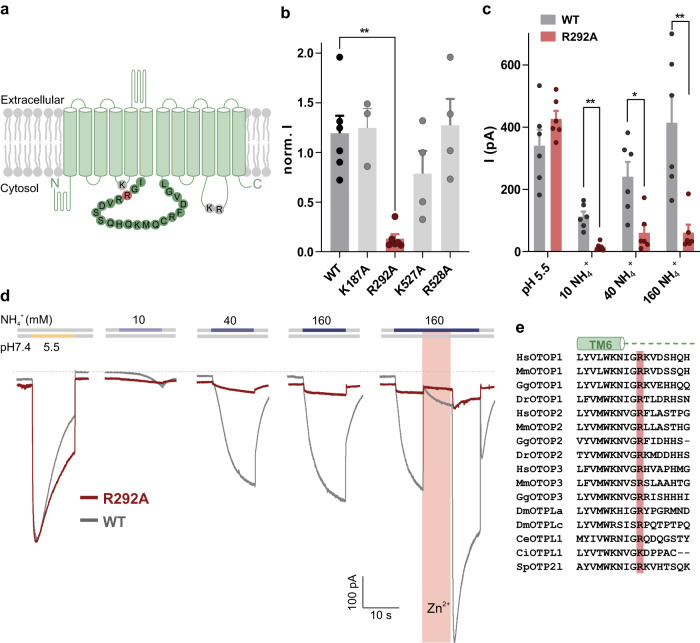
Ammonium (NH4+), a breakdown product of amino acids that can be toxic at high levels, is detected by taste systems of organisms ranging from C. elegans to humans and has been used for decades in vertebrate taste research. Here we report that OTOP1, a proton-selective ion channel expressed in sour (Type III) taste receptor cells (TRCs), functions as sensor for ammonium chloride (NH4Cl). Extracellular NH4Cl evoked large dose-dependent inward currents in HEK-293 cells expressing murine OTOP1 (mOTOP1), human OTOP1 and other species variants of OTOP1, that correlated with its ability to alkalinize the cell cytosol. Mutation of a conserved intracellular arginine residue (R292) in the mOTOP1 tm 6-tm 7 linker specifically decreased responses to NH4Cl relative to acid stimuli. Taste responses to NH4Cl measured from isolated Type III TRCs, or gustatory nerves were strongly attenuated or eliminated in an Otop1-/- mouse strain. Behavioral aversion of mice to NH4Cl, reduced in Skn-1a-/- mice lacking Type II TRCs, was entirely abolished in a double knockout with Otop1. These data together reveal an unexpected role for the proton channel OTOP1 in mediating a major component of the taste of NH4Cl and a previously undescribed channel activation mechanism.


Conflict of interest statement

The authors declare no competing interests.

Figures

Fig. 1
Fig. 1. Type III TRCs respond to ammonium chloride in an OTOP1-dependent manner.
a Representative traces of chorda tympani (CT) responses from wild-type (Otop1+/+ Skn-1a+/+), Otop1−/−, Skn-1a−/−, and Otop1−/− Skn-1a−/− double knockout mice to application to the anterior tongue of 100 mM NH4Cl, 10 mM citric acid (CA), 8 mM AceK and 500 mM KCl. b, c Average data (mean ± SEM) and scatterplot of normalized CT response from mouse strains as indicated in response to taste stimuli from experiments as in a. Statistics significance was determined by two-way ANOVA with Bonferonni correction for multiple comparisons. *p < 0.05, **p < 0.01, ***p < 0.001. ****p < 0.001. b n = 12 wild-type mice, n = 10 Skn-1a−/− mice. c n = 15 wild-type mice, n = 13 Otop1−/− mice, n = 10 double knockout mice. d Action potentials were measured in cell-attached recordings from isolated YFP+ Type III TRCs from wild-type and Otop1−/− mice in response to extracellular stimuli as indicated (concentrations in mM). e Number of action potentials measured in the first 2 s in response to various stimuli from experiments as in d. Data from individual cells and the mean ± SEM are shown. Significance comparisons of wild-type and Otop1−/− TRCs were determined by two-tailed Student’s t test. (all comparisons between the Otop1−/− and wild-type were significant at p < 0.0001 except high K+ for which p = 0.174101). n = 7 cells for wild-type, and n = 8 cells for Otop1−/−.
Fig. 2
Fig. 2. Zn2+ inhibits the NH4Cl-evoked responses in chorda tympani nerve recording and isolated TRCs.
a Chorda tympani response measured from wild-type mice in response to extracellular 100 mM NH4Cl with and without 10 mM Zn2+. b Left panel, normalized CT response measured from the experiment as in a. Right panel, average data (mean ± SEM, n = 5 mice), and scatterplot of the fractional inhibition of the CT response as a function of extracellular Zn2+ concentration. c Action potentials were measured from isolated TRCs of wild-type mice in response to extracellular 25 mM K+, pH 6.5, and 10 mM NH4+, together with 1 mM Zn2+ applied at the times indicated. d Number of action potentials measured in the first 2 s after the stimulus change from experiments as in c. Data from individual cells are shown with connected lines (n = 4). e Dose-dependent inhibition of the NH4+ induced action potentials by Zn2+ (pink bar, concentration indicated in μM) measured from isolated TRCs of wild-type mice. f Fractional inhibition measured from data (mean ± SEM) as in e fit with the Hill equation with an IC50 of 0.78 μM and Hill coefficient of 3.2 (n = 4 cells).
Fig. 3
Fig. 3. Inward currents and intracellular alkalization in mOTOP1-expressing HEK-293 cells in response to extracellular NH4Cl.
a NH4Cl induced currents measured with whole-cell patch-clamp recording from HEK-293 cells expressing mOTOP1 or un-transfected cells as labeled (Vm = −80 mV). b mOTOP1-expressing cells respond to extracellular NH4Cl in a dose-dependent manner while no current is induced in un-transfected cells. The normalized current magnitude (mean ± SEM) was fit with a Hill slope = 1.23 and EC50 = 18.66 mM. n = 7 mOTOP1-expressing cells, and n = 8 un-transfected cells. c Current magnitude in response to pH 5.5 and 160 mM NH4Cl for HEK-293 cells expressing mOTOP1. n = 9 (d) upper: representative fluorescent images of a cell expressing pHluorin and mOTOP1 captured before and during NH4+ application. Scale bar = 40 μm. lower: representative trace of the current magnitude recorded by whole-cell patch (black) and changes in fluorescent emission (green) upon exposure to varying concentrations of NH4+ from an OTOP1-expressing cell. Data is representative of 6 independent cells and measurement. e Left panel: average data (mean ± SEM, n = 6 cells) of responses to varying concentrations of NH4+ (black, current magnitude; green, change in fluorescent) from experiments as in d. Results of individual cells were normalized to the responses to 160 mM NH4+. Right panel shows the overlay of the fluorescence with the current from the experiment shown in d. f Left panel shows the voltage and solution exchange protocol used to measure the reversal potential in response to extracellular 160 mM NH4+. Vm was held at –80 mV and ramped to +80 mV (1 V/s at 1 Hz). The last ramp during the currents peaked was used for later measurements (red arrowhead). Middle panel shows the representative I–V relationship from HEK-293 cells expressing mOTOP1 in response to 40, 80, or 160 mM NH4+ from experiments described in f Right panel shows the average estimation (mean ± SEM, n = 7 cells) of intracellular pH as a function of extracellular NH4Cl concentration. The estimated pHi was calculated from Erev as measured in the middle panel, using the Nernst Equation (see methods).
Fig. 4
Fig. 4. Response to ammonium is evolutionarily conserved among OTOP1 family members from diverse species.
a Representative traces (Vm = –80 mV) showing currents evoked in HEK-293 cells expressing mOTOP1 from multiple species including mouse (Mus musculus, green), human (Homo sapiens, blue), chicken (Gallus gallus, yellow) and zebrafish (Danio rerio, red), in response to extracellular acidification (pH 5.5) and 10–160 mM NH4+ (neutral pH), with 1 mM Zn2+ applied as indicated. b Average data (mean ± SEM) and scatterplot of the current magnitude at −80 mV from experiments as in a. n = 3 cells for MmOTOP1, n = 4 cells for HsOTOP1, n = 7 cells for GgOTOP1, and n = 6 cells for DrOTOP1.
Fig. 5
Fig. 5. A conserved arginine (R292) is involved in activation of mOTOP1 by NH4Cl.
a Topology of mOTOP1 showing 12 transmembrane domains. Amino acid residues located on intracellular loops selected for mutation are highlighted in gray (K187, K527, R528) and red (R292). b Average data (mean ± SEM) and a scatterplot of the normalized current magnitude in response to extracellular 160 mM NH4+ from wild-type mOTOP1 and mutants (R292A, K527A, K187A, R528A). Current magnitudes were normalized to the response to the acid stimuli (pH 5.5) in each cell. Statistical significance was determined using a two-tailed Mann–Whitney test. **p < 0.01. n = 6 cells for WT and R292A, n = 4 cells for K527A and R528A, n = 3 cells for K187A. c Average data (mean ± SEM) and scatterplot of the current magnitude of wild-type mOTOP1 (n = 6) and mutant R292A (n = 6) from the experiments described as in d. Statistical significance determined using two-tailed Welch’s t test. *p < 0.05, **p < 0.01. d Representative trace (Vm = –80 mV) of HEK-293 cells expressing wild-type mOTOP1 (gray, same trace as in Fig. 4a) or mutant R292A (red) showing current in response to extracellular pH 5.5, 10–160 mM NH4+ and 1 mM Zn2+, respectively. e Sequence alignment of the N-terminal portion of the tm 6–7 linker from OTOP channels from diverse species. The amino acid residues at the position equivalent to R292 in mOTOP1 are highlighted in pink.
Fig. 6
Fig. 6. OTOP1 is necessary for the behavioral aversion to NH4Cl mediated by Type III TRCs.
a Schematic showing the mouse taste behavior setup using a Davis rig lickometer. In each experiment, mice were given the opportunity to lick at the control solution (artificial saliva), and multiple concentrations of the same chemical tastant, presented in random order. b Mice were water-deprived for 24 h (day 1), acclimatized to the rig on day 2, and then tested for three consecutive days with 23 h water deprivation between them. c Average data (mean ± SEM) of lick numbers, normalized to that of artificial saliva, for NH4Cl (50–500 mM), citric acid (1–30 mM), and quinine (0.1–3 mM). Mouse strains were wild-type (gray), Skn-1a−/− (blue), Otop1−/− (red), and Skn-1a−/− Otop1−/− (double knockout; purple). Otop1−/− mice showed a reduction in taste aversion to 300 mM NH4Cl; Skn-1a−/− mice, were still sensitive to but showed a reduced aversion to 300 and 500 mM NH4Cl. Skn-1a−/− Otop1−/− showed no aversion to any of the concentrations of NH4Cl, while they retained aversion to citric acid. Mice lacking Type II TRCs Skn-1a−/− showed no aversion to the bitter compound quinine, as expected. Statistical significance as compared with wild-type determined by two-way ANOVA with TUKEY correction for multiple comparisons. n = 36(left, right) and 37(middle) mice for wild-type, n = 15 (left, right) and 16 (middle) mice for Otop1−/−, n = 13 (left) and 12 (middle, right) mice for Skn-1a−/−, n = 8 (left, middle, right) mice for double knockout.
Fig. 7
Fig. 7. Mechanism of NH4Cl-induced currents through OTOP1.
a Proposed mechanism for activation of OTOP1 by NH4Cl. NH3 crosses the cell membrane inducing intracellular alkalinization. This creates both a driving force for proton entry and is hypothesized to open OTOP1 channels through actions on a conserved basic residue. b mOTOP1 structure (sideview with zoom-in) generated by AlphaFold2 with R292 highlighted as the potential site for intracellular pH regulation of gating of OTOP1.

References

    1. Auron A, Brophy PD. Hyperammonemia in review: pathophysiology, diagnosis, and treatment. Pediatr. Nephrol. 2012;27:207–222. - PubMed
    1. Batshaw ML. Hyperammonemia. Curr. Probl. Pediatr. 1984;14:1–69. - PubMed
    1. Frokjaer-Jensen C, Ailion M, Lockery SR. Ammonium-acetate is sensed by gustatory and olfactory neurons in Caenorhabditis elegans. PLoS One. 2008;3:e2467. - PMC - PubMed
    1. Vulpe A, et al. An ammonium transporter is a non-canonical olfactory receptor for ammonia. Curr. Biol. 2021;31:3382–3390.e3387. - PMC - PubMed
    1. van der Klaauw NJ, Smith DV. Taste quality profiles for fifteen organic and inorganic salts. Physiol. Behav. 1995;58:295–306. - PubMed

Publication types