. 2023 Oct 5;14(1):6221.
doi: 10.1038/s41467-023-41850-1.

Statistical laws of stick-slip friction at mesoscale

Affiliations

Statistical laws of stick-slip friction at mesoscale

Caishan Yan et al. Nat Commun. .

Abstract

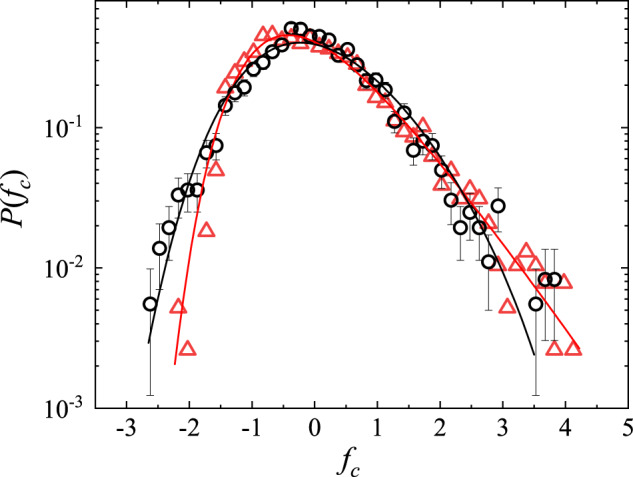
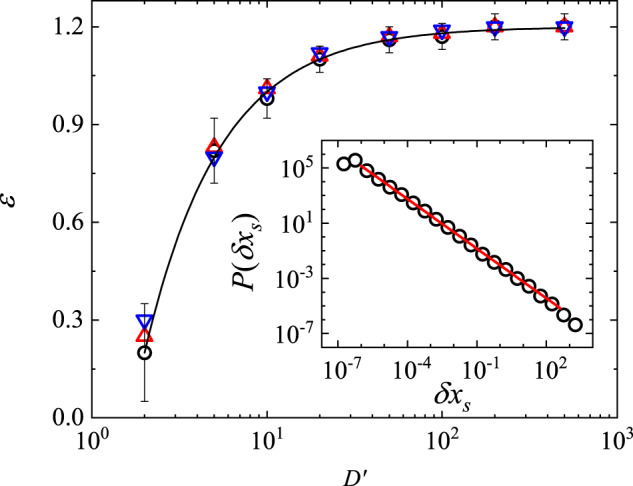
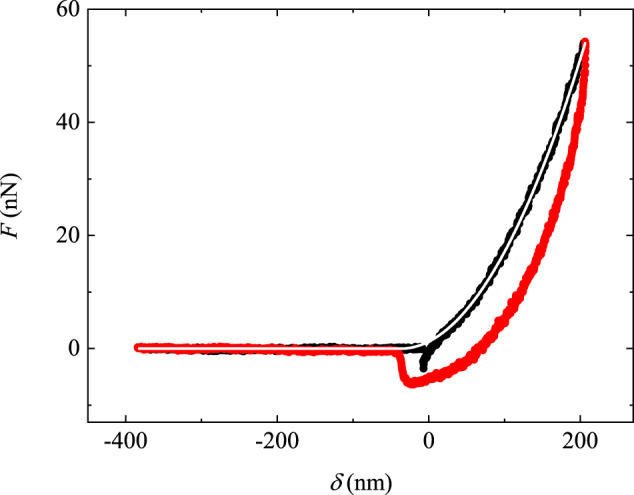
Friction between two rough solid surfaces often involves local stick-slip events occurring at different locations of the contact interface. If the apparent contact area is large, multiple local slips may take place simultaneously and the total frictional force is a sum of the pinning forces imposed by many asperities on the interface. Here, we report a systematic study of stick-slip friction over a mesoscale contact area using a hanging-beam lateral atomic-force-microscope, which is capable of resolving frictional force fluctuations generated by individual slip events and measuring their statistical properties at the single-slip resolution. The measured probability density functions (PDFs) of the slip length δxs, the maximal force Fc needed to trigger the local slips, and the local force gradient [Formula: see text] of the asperity-induced pinning force field provide a comprehensive statistical description of stick-slip friction that is often associated with the avalanche dynamics at a critical state. In particular, the measured PDF of δxs obeys a power law distribution and the power-law exponent is explained by a new theoretical model for the under-damped spring-block motion under a Brownian-correlated pinning force field. This model provides a long-sought physical mechanism for the avalanche dynamics in stick-slip friction at mesoscale.


Conflict of interest statement

The authors declare no competing interests.

Figures

Fig. 1
Fig. 1. Experimental setup and measurement of the frictional force curve.
a A sketch of the hanging-beam AFM for the measurement of the frictional force F(x) between the end surface of the scanning probe and the substrate. b An SEM image showing the side and end (inset) views of a quasi-1D scanning probe with an end contact area of (34 ± 2) × (3.0 ± 0.5)μm2. c An SEM image showing the side and end (inset) views of a 2D scanning probe with an end contact area of (12 ± 1) × (12 ± 1)μm2. The end-view SEM image reveals that the thin cantilever beam is embedded in the middle of the end portion of the scanning probe. d An AFM topographical image of the ultra-fine sandpaper surface (10 × 10 μm2) with a nominal grain size of 100 nm. The vertical grayscale indicates the surface height. The scale bar in b and c is 20 μm, and that in d is 2 μm. e Measured force trajectories F(x) as a function of scan displacement x under three different normal loads: N = 100 nN (blue curve), 500 nN (black curve), and 2400 nN (red curve). For clarity, the black and red curves are shifted upwards by 0.15 μN and 0.5 μN, respectively, which become their new zero-points in the vertical axis. The measurements are made using the 2D probe at the same scanning speed U = 100 nm/s. f A magnified view of the force trajectories in the blue-shaded region in (e). The blue downward triangles on the black curve mark the onset of each individual slip event. The inset shows two stick-slip events in the blue-shaded area of the black curve (at x ≃ 51.1 μm). Here k, Fc, and δf denote, respectively, the dynamic spring constant in the steady state, the maximum force needed to trigger a slip and force release during a slip. Source data are provided as a Source Data file. Source Data.
Fig. 2
Fig. 2. Statistics of the maximal depinning force.
Measured probability density function (PDF) of the normalized maximal force fc. The measurements are made at the same scanning speed U = 100 nm/s, and under the same normal load N = 500 nN, for both the quasi-1D probe (black circles) and 2D probe (red triangles). For each set of data, the measured F(x) recorded ~2500 slip events over a traveling distance x ≃ 500 μm. The black and red solid lines show, respectively, the fits of Eq. (1) to the black circles with ξ = − 0.13 ± 0.06 and to the red triangles with ξ = − 0.03 ± 0.05. The error bars show the standard deviation of the black circles. Source data are provided as a Source Data file. Source Data.
Fig. 3
Fig. 3. Frictional force loops measured on a smooth silicon wafer surface.
The force loops are measured as a function of traveling distance x when the quasi-1D probe (black curve) and 2D probe (red curve) are pulled to advance ( → ) and recede ( ← ) for a whole cycle against a smooth silicon wafer surface, which is coated with a thin layer of gold. The measurements are made under the same normal load N = 200 nN and at the same scanning speed U = 1 μm/s. In the plot, k0 denotes the slope of the force curve on the left and right sides of the force loop. Source data are provided as a Source Data file. Source Data.
Fig. 4
Fig. 4. Statistics of the slip length.
Log–log plot of the measured PDF of the interface displacement δxs associated with each slip. The measurements are made at the same scanning speed U = 100 nm/s, and under the same normal load N = 500 nN, for both the quasi-1D probe (black circles) and 2D probe (red triangles). The solid lines show the power-law fits of Eq. (2) to the black circles with the power-law exponent τ = 1.12 ± 0.10 and to the red triangles with τ = 0.72 ± 0.10. The error bars show the standard deviation of the black circles. Source data are provided as a Source Data file. Source Data.
Fig. 5
Fig. 5. Statistics of the local force gradient.
Measured PDF of the local force gradient k of the pinning force field. In the plot, the value of k is normalized by k0. The measurements are made at the same scanning speed U = 100 nm/s, and under the same normal load N = 500 nN, for both the quasi-1D probe (black circles) and 2D probe (red triangles). The error bars show the standard deviation of the black circles. The solid line shows an exponential fit, P(k/k0)=bexp[b(k/k0)], to all the data with b = 0.14 ± 0.02. The inset shows the PDF P(k) of the normalized dynamic spring constant k/k0. Source data are provided as a Source Data file. Source Data.
Fig. 6
Fig. 6. Numerically calculated power-law exponent of the slip length distribution.
The data are obtained for three different values of γ in the under-damped regime: γ=0.5 (black circles), γ=1 (red upward triangles), and γ=2 (blue downward triangles). The solid line shows a fit, ϵ=τκ/D, to the data points with τ = 1.20 ± 0.05 and κ = 2.0 ± 0.2. Inset shows the obtained PDF P(δxs) of the slip length δxs from the numerical simulations of Eq. (7) at D=500 and γ=1 with a total of 1.5 × 104 slip events. The red solid line shows a power-law fit, P(δxs)~δxsϵ, to the data points with ϵ = 1.20 ± 0.03. The error bars show the standard deviation of the black circles. Source data are provided as a Source Data file. Source Data.
Fig. 7
Fig. 7. Measurement of the Young’s modulus of the UV-cured glue.
A typical force-indentation curve F(δ) is obtained when a conical AFM tip is pressed against a nanoparticles-embedded UV-cured glue surface with indentation depth δ. The black and red curves are obtained, respectively, when the AFM tip advances and then retracts from the glue surface. The measurements are made at a constant speed of 0.64 μm/s. The white solid line shows a fit of Eq. (8) to the black curve with E = 3.0 MPa and δ0 = − 37 nm. Source data are provided as a Source Data file. Source Data.
Fig. 8
Fig. 8. Roughness of the end surface of the scanning probe.
a An AFM topographical image (6 μm × 6 μm) of the end surface of the 2D scanning probe, which is measured in the tapping mode. The vertical dark boundary between the left and right regions with parallel stripes indicates the position of the thin cantilever beam embedded in the middle of the end portion of the scanning probe. The vertical grayscale indicates the surface height. b Typical horizontal (black curve) and vertical (red curve) surface height profiles h(x) along the black and red lines as marked in (a). Source data are provided as a Source Data file. Source Data.

References

    1. Zapperi S, Cizeau P, Durin G, Stanley HE. Dynamics of a ferromagnetic domain wall: avalanches, depinning transition, and the Barkhausen effect. Phys. Rev. B. 1998;58:6353.
    1. Fisher D. Collective transport in random media: from superconductors to earthquakes. Phys. Rep. 1998;301:113.
    1. Sethna J, Dahmen K, Myers C. Crackling noise. Nature. 2001;410:242. - PubMed
    1. Colaiori F. Exactly solvable model of avalanches dynamics for Barkhausen crackling noise. Adv. Phys. 2008;57:4.
    1. Heslot F, Baumberger T, Perrin B, Caroli B, Caroli C. Creep, stick-slip, and dry-friction dynamics. Phys. Rev. E. 1994;49:4973. - PubMed