. 2023 Nov;7(11):2008-2022.
doi: 10.1038/s41562-023-01707-5. Epub 2023 Oct 5.

No phenotypic or genotypic evidence for a link between sleep duration and brain atrophy

Affiliations

No phenotypic or genotypic evidence for a link between sleep duration and brain atrophy

Anders M Fjell et al. Nat Hum Behav. 2023 Nov.

Abstract

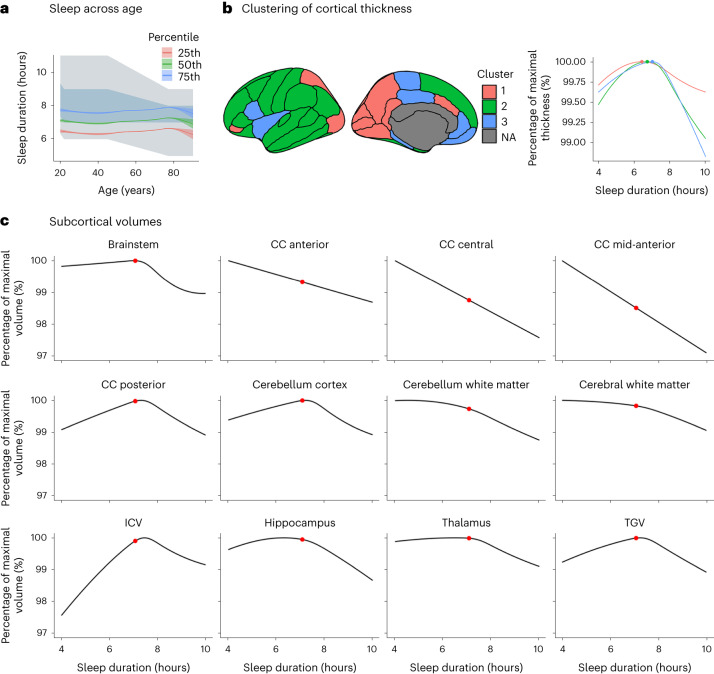
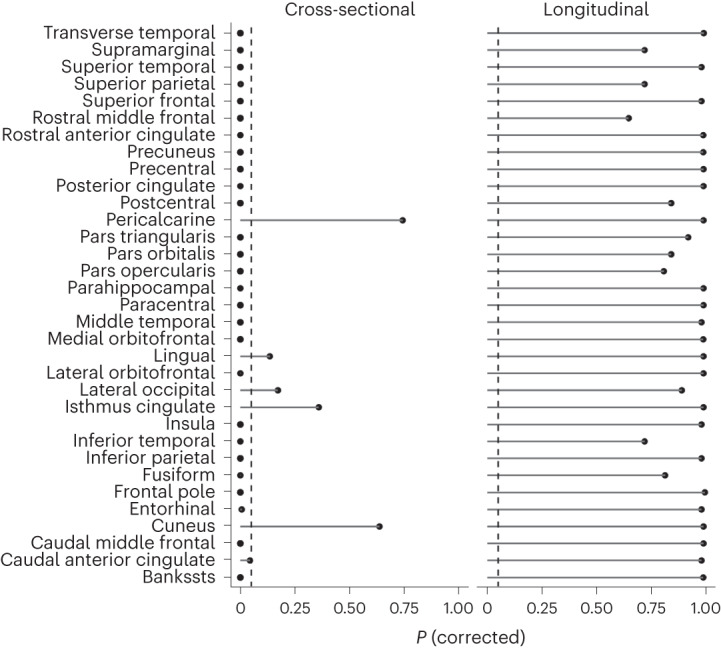
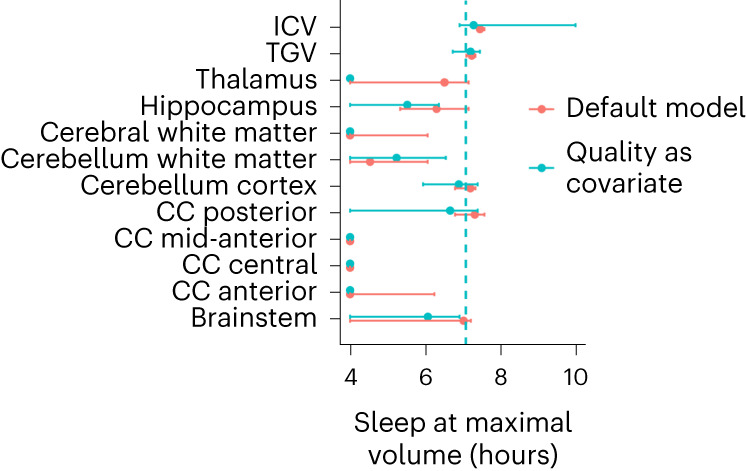
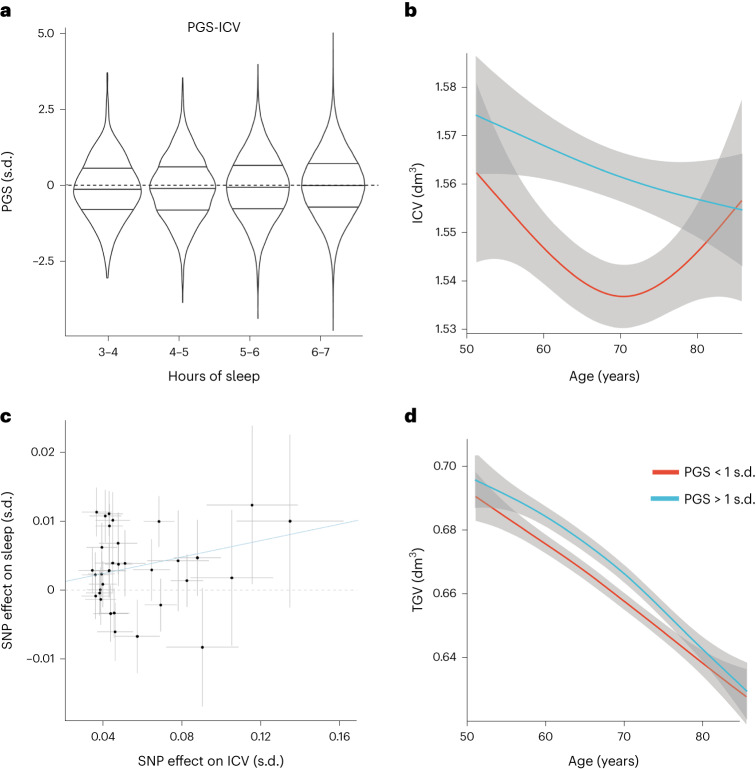
Short sleep is held to cause poorer brain health, but is short sleep associated with higher rates of brain structural decline? Analysing 8,153 longitudinal MRIs from 3,893 healthy adults, we found no evidence for an association between sleep duration and brain atrophy. In contrast, cross-sectional analyses (51,295 observations) showed inverse U-shaped relationships, where a duration of 6.5 (95% confidence interval, (5.7, 7.3)) hours was associated with the thickest cortex and largest volumes relative to intracranial volume. This fits converging evidence from research on mortality, health and cognition that points to roughly seven hours being associated with good health. Genome-wide association analyses suggested that genes associated with longer sleep for below-average sleepers were linked to shorter sleep for above-average sleepers. Mendelian randomization did not yield evidence for causal impacts of sleep on brain structure. The combined results challenge the notion that habitual short sleep causes brain atrophy, suggesting that normal brains promote adequate sleep duration-which is shorter than current recommendations.


Conflict of interest statement

C.E.S. reports consulting fees from Jazz Pharmaceuticals and is now a full-time employee of the US Alzheimer’s Association. C.A.D. is a cofounder, stock owner, board member and consultant in the contract laboratory Vitas AS, performing personalized analyses of blood biomarkers. The rest of the authors report no competing interests.

Figures

Fig. 1
Fig. 1. Cross-sectional relationships.
a, Self-reported sleep duration superimposed on the recommended sleep intervals from the National Sleep Foundation. The blue/grey area depicts the recommended sleep interval (blue indicates ‘recommended’; grey indicates ‘may be appropriate’). The green line shows average self-reported sleep in this study; the blue and red lines show the 75th and 25th percentiles, respectively. The shaded area around each curve shows the 95% CI. b, Clusters of regions showing similar relationships between thickness and sleep duration. The graph shows thickness in each cluster as a function of sleep duration. The maximum thickness is 100%, illustrated by the coloured dots. NA, non-cortical region. c, Subcortical and global volumes as a function of sleep duration. The maximum volume is 100%. The red dots show the average reported sleep duration. Only regions significantly related to sleep duration are shown. The plots are corrected for baseline age, sex, site, follow-up time and ICV (except for the ICV plot). CC, corpus callosum.
Fig. 2
Fig. 2. Sleep duration, cortical thickness and thickness change.
P values corrected for multiple comparisons by FDR are shown for each cortical region. The left panel shows the cross-sectional results (thickness). The right panel shows the longitudinal results (thickness change). GAMMs were used for testing. The P values are two-sided and adjusted using the Benjamini–Hochberg procedure. The dashed lines show P < 0.05. The results for cortical area and volume are shown in the Supplementary Information, ‘Cortical cross-sectional’ and ‘Cortical longitudinal’. Bankssts, banks of the superior temporal sulcus.
Fig. 3
Fig. 3. Sleep at maximum subcortical volume.
The sleep durations associated with the maximum subcortical volume are indicated by the dots. Only regions significantly related to sleep duration are shown. The error bars indicate 95% CIs (N = 47,029; 51,295 observations). The default model is shown in red, and the model including global sleep quality as a covariate is shown in turquoise.
Fig. 4
Fig. 4. Genetic relations between sleep duration and brain structure.
a, Distributions of PGSs for ICV in different sleep duration strata among shorter-than-average sleepers (3–4 h, N = 541; 4–5 h, N = 2,937; 5–6 h, N = 13,863; 6–7 h, N = 177,493), expressed in s.d. compared with the sample mean of 0. The horizontal lines in each violin represent the median group value and the interquartile range, the height represents the 95% CI and the width represents the probability density. b, ICV for shorter-than-average sleepers with one standard deviation above (blue) and below (red) the average PGS for sleep duration. The grey shaded areas represent the 95% CIs. c, SNP effects on ICV (x axis) and sleep duration (y axis) for the shorter-than-average sleepers. d, TGV for shorter-than-average sleepers with one standard deviation above (blue) and below (red) the average PGS for sleep duration. The grey shaded areas represent the 95% CIs.

References

    1. Watson NF, et al. Recommended amount of sleep for a healthy adult: a joint consensus statement of the American Academy of Sleep Medicine and Sleep Research Society. Sleep. 2015;38:843–844. - PMC - PubMed
    1. Paruthi S, et al. Pediatric sleep duration consensus statement: a step forward. J. Clin. Sleep Med. 2016;12:1705–1706. doi: 10.5664/jcsm.6368. - DOI - PMC - PubMed
    1. Paruthi S, et al. Consensus statement of the American Academy of Sleep Medicine on the recommended amount of sleep for healthy children: methodology and discussion. J. Clin. Sleep Med. 2016;12:1549–1561. doi: 10.5664/jcsm.6288. - DOI - PMC - PubMed
    1. Paruthi S, et al. Recommended amount of sleep for pediatric populations: a consensus statement of the American Academy of Sleep Medicine. J. Clin. Sleep Med. 2016;12:785–786. doi: 10.5664/jcsm.5866. - DOI - PMC - PubMed
    1. Lyon L. Is an epidemic of sleeplessness increasing the incidence of Alzheimer’s disease? Brain. 2019;142:e30. doi: 10.1093/brain/awz087. - DOI - PubMed