. 2023 Nov;55(11):1807-1819.
doi: 10.1038/s41588-023-01520-w. Epub 2023 Oct 5.

Genome-wide association study of placental weight identifies distinct and shared genetic influences between placental and fetal growth

Robin N Beaumont #  1 Christopher Flatley #  2   3 Marc Vaudel #  4 Xiaoping Wu  5 Jing Chen  6   7 Gunn-Helen Moen  8   9   10   11   12 Line Skotte  5 Øyvind Helgeland  3   4 Pol Solé-Navais  2 Karina Banasik  13 Clara Albiñana  14 Justiina Ronkainen  15 João Fadista  5   16   17 Sara Elizabeth Stinson  18 Katerina Trajanoska  19   20 Carol A Wang  21   22 David Westergaard  13   23   24 Sundararajan Srinivasan  25 Carlos Sánchez-Soriano  26 Jose Ramon Bilbao  27   28   29 Catherine Allard  30 Marika Groleau  31 Teemu Kuulasmaa  32 Daniel J Leirer  1 Frédérique White  31 Pierre-Étienne Jacques  30   31 Haoxiang Cheng  33 Ke Hao  33 Ole A Andreassen  34   35 Bjørn Olav Åsvold  10   36   37 Mustafa Atalay  32 Laxmi Bhatta  10 Luigi Bouchard  38   39 Ben Michael Brumpton  10   36   40 Søren Brunak  13 Jonas Bybjerg-Grauholm  41   42 Cathrine Ebbing  43   44 Paul Elliott  45 Line Engelbrechtsen  18   46 Christian Erikstrup  47   48 Marisa Estarlich  49   50   51 Stephen Franks  52 Romy Gaillard  53   54 Frank Geller  5 Jakob Grove  42   55   56   57 David M Hougaard  41   42 Eero Kajantie  58   59   60 Camilla S Morgen  18   61 Ellen A Nohr  62 Mette Nyegaard  63 Colin N A Palmer  25 Ole Birger Pedersen  64   65 Early Growth Genetics (EGG) ConsortiumFernando Rivadeneira  19   53 Sylvain Sebert  15 Beverley M Shields  1 Camilla Stoltenberg  66   67 Ida Surakka  68 Lise Wegner Thørner  69 Henrik Ullum  70 Marja Vaarasmaki  58   71 Bjarni J Vilhjalmsson  14   57 Cristen J Willer  68   72   73 Timo A Lakka  32   74   75 Dorte Gybel-Brask  76 Mariona Bustamante  51   77   78 Torben Hansen  18 Ewan R Pearson  25 Rebecca M Reynolds  26 Sisse R Ostrowski  65   69 Craig E Pennell  21   22 Vincent W V Jaddoe  53   54 Janine F Felix  53   54 Andrew T Hattersley  1 Mads Melbye  10   65   79   80 Deborah A Lawlor  11   81 Kristian Hveem  10   36 Thomas Werge  42   65   82   83 Henriette Svarre Nielsen  23   65 Per Magnus  84 David M Evans  9   12   81 Bo Jacobsson  2   3 Marjo-Riitta Järvelin  45   85   86   87 Ge Zhang  7   88   89   90 Marie-France Hivert  91   92 Stefan Johansson  93   94 Rachel M Freathy  95   96 Bjarke Feenstra  97   98 Pål R Njølstad  99   100
Affiliations

Genome-wide association study of placental weight identifies distinct and shared genetic influences between placental and fetal growth

Robin N Beaumont et al. Nat Genet. 2023 Nov.

Abstract

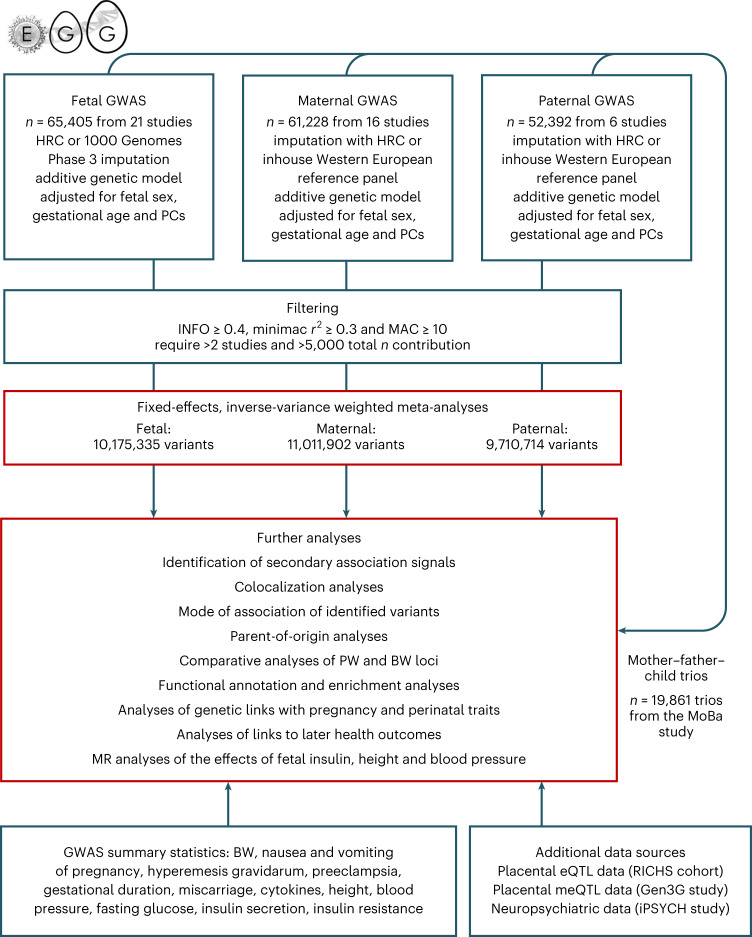
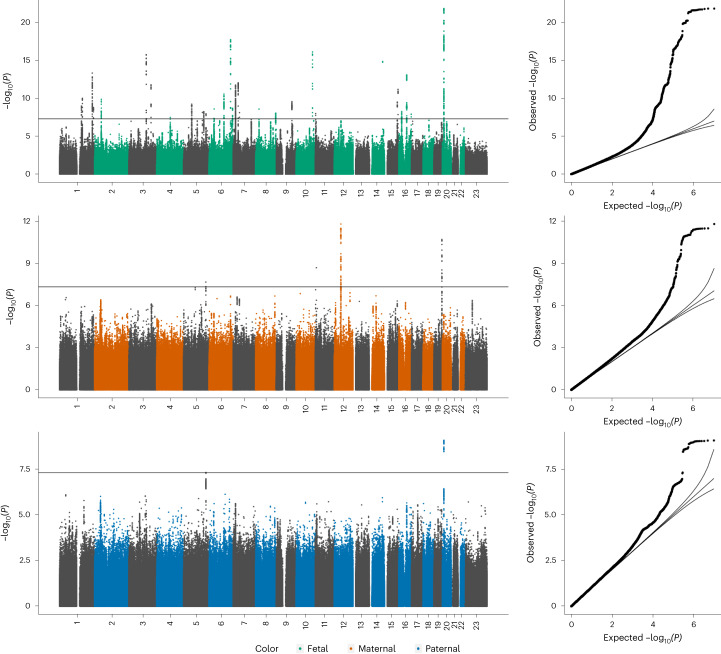
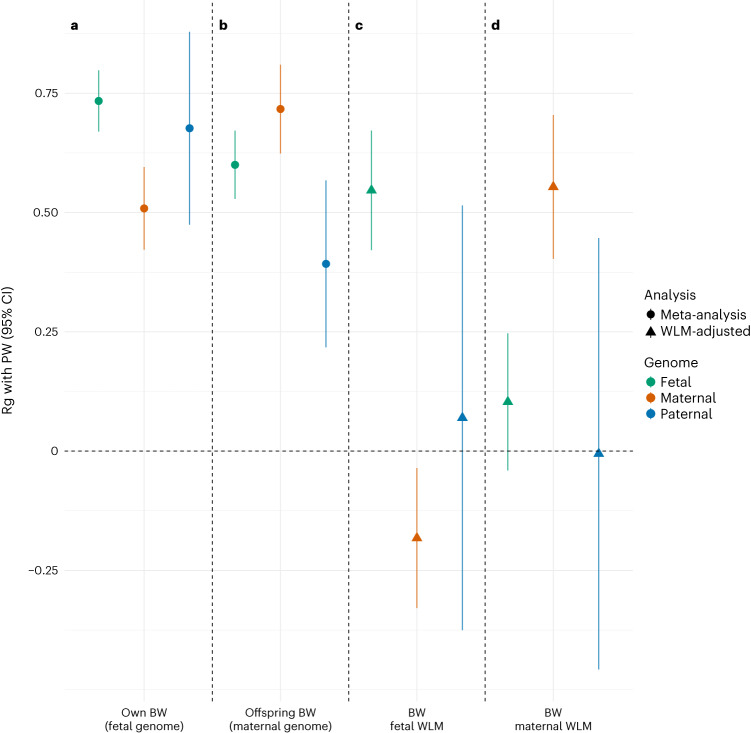
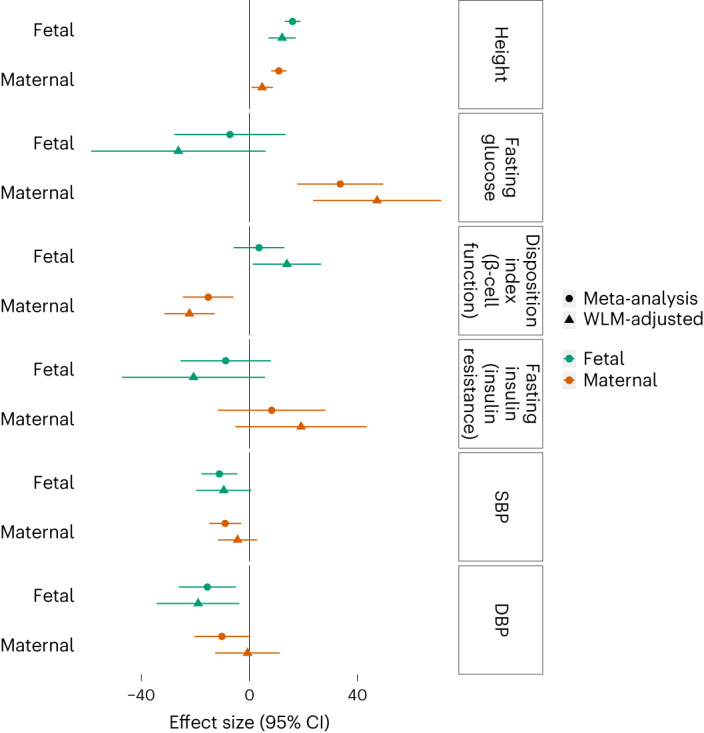
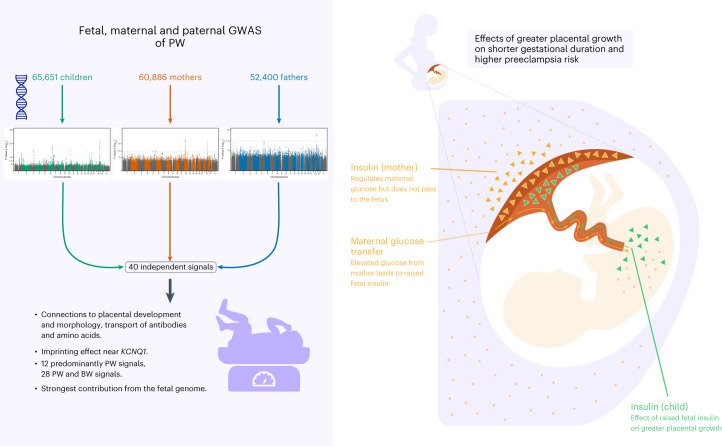
A well-functioning placenta is essential for fetal and maternal health throughout pregnancy. Using placental weight as a proxy for placental growth, we report genome-wide association analyses in the fetal (n = 65,405), maternal (n = 61,228) and paternal (n = 52,392) genomes, yielding 40 independent association signals. Twenty-six signals are classified as fetal, four maternal and three fetal and maternal. A maternal parent-of-origin effect is seen near KCNQ1. Genetic correlation and colocalization analyses reveal overlap with birth weight genetics, but 12 loci are classified as predominantly or only affecting placental weight, with connections to placental development and morphology, and transport of antibodies and amino acids. Mendelian randomization analyses indicate that fetal genetically mediated higher placental weight is causally associated with preeclampsia risk and shorter gestational duration. Moreover, these analyses support the role of fetal insulin in regulating placental weight, providing a key link between fetal and placental growth.


Conflict of interest statement

O.A.A. is a consultant to Cortechs.ai and has received speaker’s fees from Lundbeck, Janssen and Sunovion. B.J.V. is on Allelica’s scientific advisory board. C.J.W.’s spouse works for Regeneron Pharmaceuticals. D.A.L. has received support from Roche Diagnostics and Medtronic for research unrelated to that presented here. H.S.N. has received speaker’s fees from Ferring Pharmaceuticals, Merck A/S, Astra Zeneca, Cook Medical and IBSA Nordic. S.B. has ownerships in Intomics A/S, Hoba Therapeutics Aps, Novo Nordisk A/S, Lundbeck A/S, ALK-Abelló A/S and managing board memberships in Proscion A/S and Intomics A/S. The remaining authors declare no competing interests.

Figures

Fig. 1
Fig. 1. Flow chart of the study design.
HRC, Haplotype Reference Consortium; MAC, minor allele count; PC, principal component.
Fig. 2
Fig. 2. Genome-wide association results for PW.
Manhattan plots of −log10(P values) across the chromosomes and corresponding quantile–quantile plot of observed versus expected −log10(P values) for meta-analyses of SNP associations with PW in the fetal GWAS (top, n = 65,405 children), the maternal GWAS (middle, n = 61,228 mothers) and the paternal GWAS (bottom, n = 52,392 fathers).
Fig. 3
Fig. 3. Resolving fetal and parental contributions to PW associations.
a, Effect size and significance estimates for the 41 association signals in our PW meta-analysis (M: maternal genome, n = 61,228; F: fetal genome, n = 65,405; not conditioned on each other), our PW allele contribution analysis in MoBa (n = 19,861), the BW allele contribution analysis discussed in ref. (a cross indicates that no genome-wide significant hit discussed in ref. had r2 ≥ 0.2 with the PW-lead SNP) and the BW meta-analysis discussed in ref. (M: maternal genome, F: fetal genome, not conditioned against each other, a cross indicates that no proxy was found with r2 ≥ 0.2). b, Effect size estimates for standardized PW and BW adjusted for sex and gestational duration for rs2237892 near KCNQ1 in MoBa, n = 19,861. Thin and thick error bars, respectively, represent 95% confidence intervals and one s.e. on each side of the point representing the effect size estimate. c,d, Regional plots at the KCNQ1 locus (chromosome 11, 2689751–3007297 Mb), plotting −log10 of the unadjusted P value against genomic location, for the maternal nontransmitted, maternal transmitted, paternal transmitted and paternal nontransmitted alleles in their association with standardized PW (c) and BW (d) adjusted for sex and gestational duration in MoBa, n = 19,861. Recombination rates are plotted in blue, and the exons of KCNQ1, KCNQ1-AS1 and CDKN1C are displayed under the plot. The leading variants for PW and BW, rs2237892 and rs234864, are annotated with a diamond and a circle, respectively. Points are colored according to their LD with rs2237892. F and M, fetal and maternal; MnT, maternal nontransmitted allele; MT, maternal transmitted allele; PT, paternal transmitted allele; PnT, paternal nontransmitted allele.
Fig. 4
Fig. 4. Genetic correlation between PW and BW.
ad, Genetic correlation estimates and corresponding 95% CIs between PW (current study) and BW (n = 321,223 fetal and 230,069 maternal) from ref. . a, Fetal GWAS of BW. b, Maternal GWAS of offspring BW. c, WLM-adjusted fetal GWAS of BW. d, WLM-adjusted maternal GWAS of BW. Values are provided for fetal, maternal and paternal effects before and after WLM adjustment. Rg, genetic correlation.
Fig. 5
Fig. 5. Scatter plots comparing effect sizes from PW and BW GWAS for PW SNPs.
a,b, Scatter plots comparing effect size estimates and 95% confidence estimates from the PW GWAS (n = 65,405) with those from the BW GWAS (n = 321,223). a, Colored (blue and green) points represent variants classified as having both PW and BW effects. b, Colored (orange) points represent variants classified as having predominantly or only PW effects.
Fig. 6
Fig. 6. MR analyses testing effects of maternal exposures (and fetal genetic predisposition to those exposures) on PW.
Point (effect size estimate) and line (95% CI of effect size) of two-sample MR analyses estimating the causal effects of maternal height, glycemic traits and blood pressure on PW, as well as the effects of fetal genetic predisposition to the same traits on PW. Maternal WLMs are adjusted for the effects of the fetal genotypes, and fetal WLM analyses are adjusted for the effects of the maternal genotypes. WLM, weighted linear model;SBP, systolic blood pressure; DBP, diastolic blood pressure. Units for exposures are height (s.d.), fasting glucose (s.d.), disposition index (s.d.), fasting insulin (s.d.), SBP (10 mmHg) and DBP (10 mmHg). Causal estimates are grams of PW per unit exposure.
Fig. 7
Fig. 7. Overview of main study findings.
Summary of results and conclusions from fetal, maternal and paternal meta-analyses (left panel) and a schematic of the results of Mendelian randomization analyses (right panel).
Extended Data Fig. 1
Extended Data Fig. 1. Effect sizes and minor allele frequencies for placental weight-associated lead SNPs.
Variants identified in the fetal, maternal and paternal analyses are shown in black, red, and blue, respectively. The lines indicate effect sizes needed to have 80% power to detect variants at genome-wide significance with the sample sizes of the fetal, maternal, and paternal analyses. Circles indicate main signals and triangles indicate secondary signals (fetal n = 65,405; maternal n = 61,228; paternal n = 52,392). Error bars represent 95% confidence intervals.
Extended Data Fig. 2
Extended Data Fig. 2. Heritability estimates for placental weight from genomic SEM analysis.
Scatter plot showing SNP heritability estimates (h2) for fetal, maternal and paternal genomes estimated using genomic SEM (fetal n = 65,405; maternal n = 61,228; paternal n = 52,392). Error bars represent 95% confidence intervals.
Extended Data Fig. 3
Extended Data Fig. 3. Fetal classified loci: effects from meta-analysis and weighted linear model for each genome.
Shown are the variants which were classified as having a fetal effect. Estimates are provided for fetal, maternal, and paternal effects for the meta-analysis results and after weighted linear model adjustment (fetal n = 65,405; maternal n = 61,228; paternal n = 52,392). Circles and triangles are association estimates, and error bars represent 95% confidence intervals. Abbreviation: WLM, weighted linear model. *Note different scale on x-axis for rs140691414 - TSNAX-DISC1 & rs541541049 NUDT3.
Extended Data Fig. 4
Extended Data Fig. 4. Classifications of remaining loci and effects from meta analysis and weighted linear model for each genome.
Shown are the remaining variants. Estimates are provided for fetal, maternal, and paternal effects for the meta-analysis results and after weighted linear model adjustment (fetal n = 65,405; maternal n = 61,228; paternal n = 52,392). Circles and triangles are association estimates, and error bars represent 95% confidence intervals. Abbreviation: WLM, weighted linear model.
Extended Data Fig. 5
Extended Data Fig. 5. Scatter plots comparing effect sizes from placental weight and birth weight GWAS for placental weight SNPs.
ae, Scatter plots comparing effect size estimates and 95% confidence intervals from the placental weight GWAS (n = 65,405) with those from the birth weight GWAS (n = 321,223). Panels a and b show only SNPs classified as having fetal only effects, panels c and d show SNPs with maternal only or maternal and fetal effect, and panels e and f show unclassified SNPs. Panels a, c and e show fetal PW and BW betas, and panels b, d and f show maternal PW and BW betas. The left column shows fetal genome associations, and the right shows maternal. The top row shows SNPs classified as fetal only effects on PW (Supplementary Table 7). The middle row shows SNPs classified as maternal, or maternal and fetal, and the bottom row shows unclassified SNPs. Colors indicate classifications, which are given in a key below the figure. Abbreviations: BW, birth weight; GWAS, genome-wide association study; PW, placental weight. Error bars represent 95% confidence intervals.
Extended Data Fig. 6
Extended Data Fig. 6. Tissue enrichment by mRNA data.
Plot illustrating the enrichment or depletion of RNA expression of the 31 placental weight-associated protein-coding genes identified in the fetal GWAS, in 61 different tissues. Each dot represents a specific tissue and plots the difference in average rank of expression levels between the 31 placental weight-associated genes and all the other genes (x-axis) with associated -log(P value) based on the Wilcoxon rank-sum test (y-axis). The size of the points is inversely proportional to the log P value. The two dashed horizontal lines represent significance levels with (red) or without (orange) Bonferroni correction (n = 61). Tissues with nominally significant (P value < 0.05) higher or lower expression of the test genes are plotted and labeled as red or blue dots, respectively. Tissues with Bonferroni corrected significance are highlighted by labels with yellow background.
Extended Data Fig. 7
Extended Data Fig. 7. Cell-type enrichment by scRNA-seq data.
Plot illustrating the enrichment or depletion of RNA expression of the 31 nearest protein-coding genes at placental weight loci identified in the fetal GWAS in 32 different cell types at the early maternal-fetal interface. Each dot represents a specific cell-type and plots the difference in average rank of expression between the 31 placental genes and all the other genes (x-axis) with associated -log(P value) based on the Wilcoxon rank-sum test (y-axis). The size of the points is inversely proportional to the log P value. The two dashed horizontal lines represent significance levels with (red) or without (orange) after Bonferroni correction (n = 32). Cell types with nominally significant (P value < 0.05) higher or lower expression of the test genes are plotted and labeled as red or blue dots, respectively. Cell types with Bonferroni corrected significance are highlighted by labels with yellow background. Abbreviations of cell types with nominally significant difference in expression: Endo (f), endothelial cells (fetal); SCT, syncytiotrophoblast (fetal); ILC, innate lymphocyte cells (maternal); HB, Hofbauer cells (fetal); fFB1 and fFB2, fibroblasts (fetal); Epi1 and Epi2, epithelial glandular cells (unassigned or maternal); dM3, Maternal macrophages (maternal cell in placenta); EVT, extravillous trophoblast; DC1, dendritic cells; T cells, T cells (maternal or fetal).
Extended Data Fig. 8
Extended Data Fig. 8. Mendelian randomization analyses.
a, Diagram illustrating the Mendelian randomization analyses used to test for a causal relationship (*) between higher placental weight (exposure; a proxy for faster placental growth) and either preeclampsia, or gestational duration (outcomes). Key assumptions:(i) fetal genotype (genetic instrumental variable) is robustly related to placental weight, (ii) potential confounders of the causal relationship of interest are not associated with the genetic instrumental variable, and (iii) the genetic instrumental variable is only related to the outcome via its effect on the exposure (placental weight), not through any other pathway. Since maternal genotype is correlated with fetal genotype and may additionally influence placental weight and the outcome variables, it is a potential confounder and should be adjusted for in the analyses (indicated by the box around it). We were able to adjust for maternal genotype using weighted linear model (WLM) estimates of fetal genetic effects on placental weight and on preeclampsia and gestational duration, since both maternal and fetal GWAS summary statistics are available for those outcomes. To check for deviation from assumption (iii) above, we used the MR Egger, weighted median and penalized weighted median sensitivity analyses. b–d, Results of two-sample Mendelian randomization analyses testing the effect of (b) higher placental weight (n = 65,405) using fetal genetic instruments on preeclampsia (n = 167,234), (c) higher placental weight using fetal genetic instruments on gestational duration (n = 43,568), and (d) higher birth weight (n = 321,223) using fetal genetic instruments on preeclampsia. Points represent SNP effect estimates and error bars show 95% confidence intervals.
Extended Data Fig. 9
Extended Data Fig. 9. Polygenic score analyses.
The panels show associations between quantiles of fetal polygenic scores for placental weight and standardized observed placental weight in the iPSYCH cohort (n = 33,035). Points represent association effect estimates and error bars show 95% confidence intervals. Black dots show associations for the population representative sample used as controls in iPSYCH, and blue dots show associations for cases of four different neuropsychiatric diseases. Abbreviations: CI, confidence interval; ADHD, attention deficit/hyperactivity disorder; ASD, autism spectrum disorder; PGS, polygenic score.
Extended Data Fig. 10
Extended Data Fig. 10. Analyses in the iPSYCH cohort of placental weight and risk of neuropsychiatric diseases.
The figure shows odds ratios (ORs) from logistic regressions of four neuropsychiatric diseases on standardized observed placental weight (upper panel) and fetal polygenic score of placental weight (lower panel). The ORs correspond to a change of one standard deviation in standardized observed placental weight or PGS for placental weight. Abbreviations: CI, confidence interval; ADHD, attention deficit/hyperactivity disorder; ASD, autism spectrum disorder; OR, odds ratio; PGS, polygenic score.

References

    1. Burton GJ, Jauniaux E. Pathophysiology of placental-derived fetal growth restriction. Am. J. Obstet. Gynecol. 2018;218:S745–S761. doi: 10.1016/j.ajog.2017.11.577. - DOI - PubMed
    1. Vahanian SA, Lavery JA, Ananth CV, Vintzileos A. Placental implantation abnormalities and risk of preterm delivery: a systematic review and metaanalysis. Am. J. Obstet. Gynecol. 2015;213:S78–S90. doi: 10.1016/j.ajog.2015.05.058. - DOI - PubMed
    1. Fisher SJ. Why is placentation abnormal in preeclampsia? Am. J. Obstet. Gynecol. 2015;213:S115–S122. doi: 10.1016/j.ajog.2015.08.042. - DOI - PMC - PubMed
    1. Magee LA, Nicolaides KH, von Dadelszen P. Preeclampsia. N. Engl. J. Med. 2022;386:1817–1832. doi: 10.1056/NEJMra2109523. - DOI - PubMed
    1. Gaillard R, Steegers EAP, Tiemeier H, Hofman A, Jaddoe VWV. Placental vascular dysfunction, fetal and childhood growth, and cardiovascular development: the generation R study. Circulation. 2013;128:2202–2210. doi: 10.1161/CIRCULATIONAHA.113.003881. - DOI - PubMed

Publication types