. 2023 Nov;26(11):1868-1879.
doi: 10.1038/s41593-023-01452-y. Epub 2023 Oct 5.

Single-nucleus genomics in outbred rats with divergent cocaine addiction-like behaviors reveals changes in amygdala GABAergic inhibition

Affiliations

Single-nucleus genomics in outbred rats with divergent cocaine addiction-like behaviors reveals changes in amygdala GABAergic inhibition

Jessica L Zhou et al. Nat Neurosci. 2023 Nov.

Erratum in

Abstract

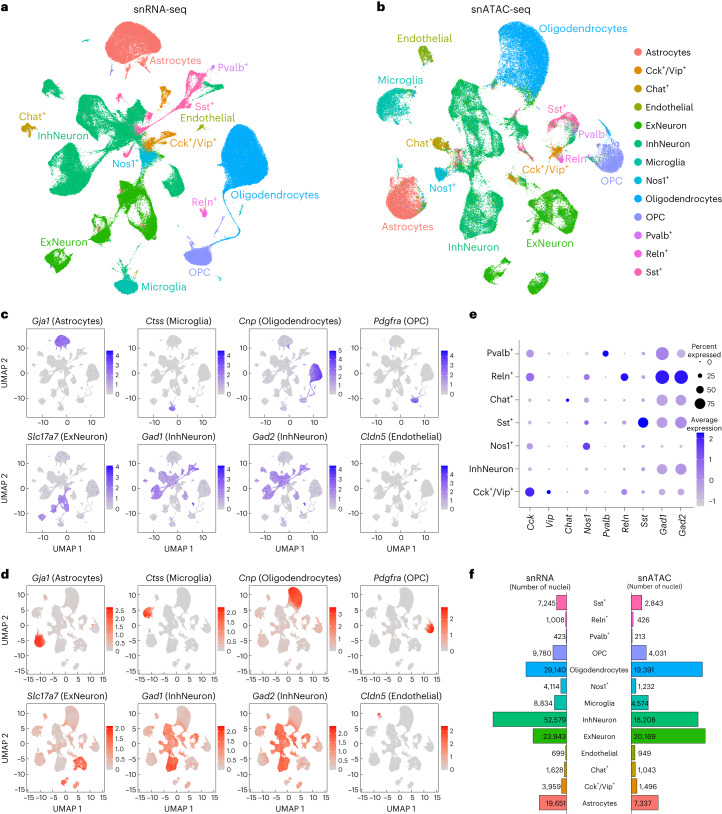
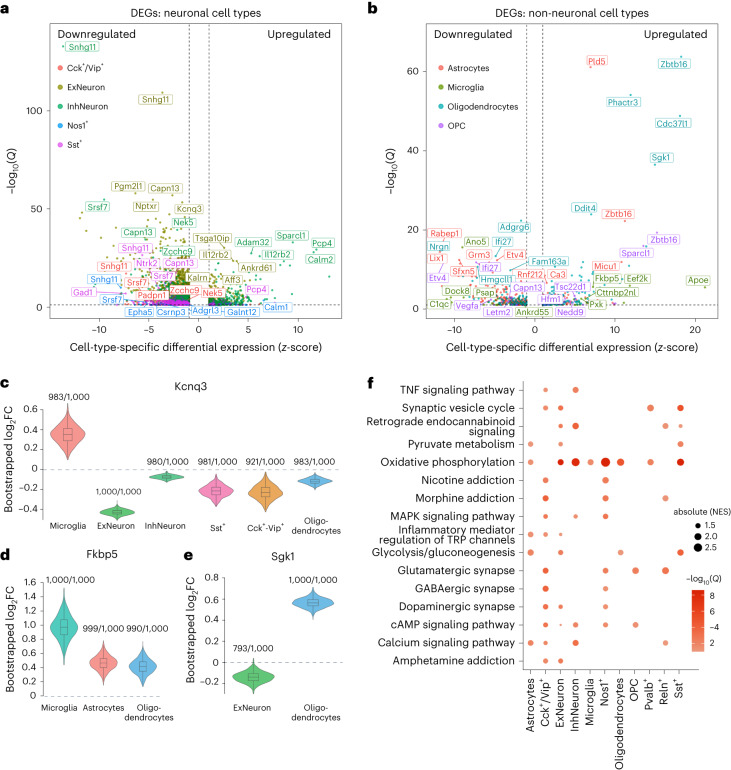
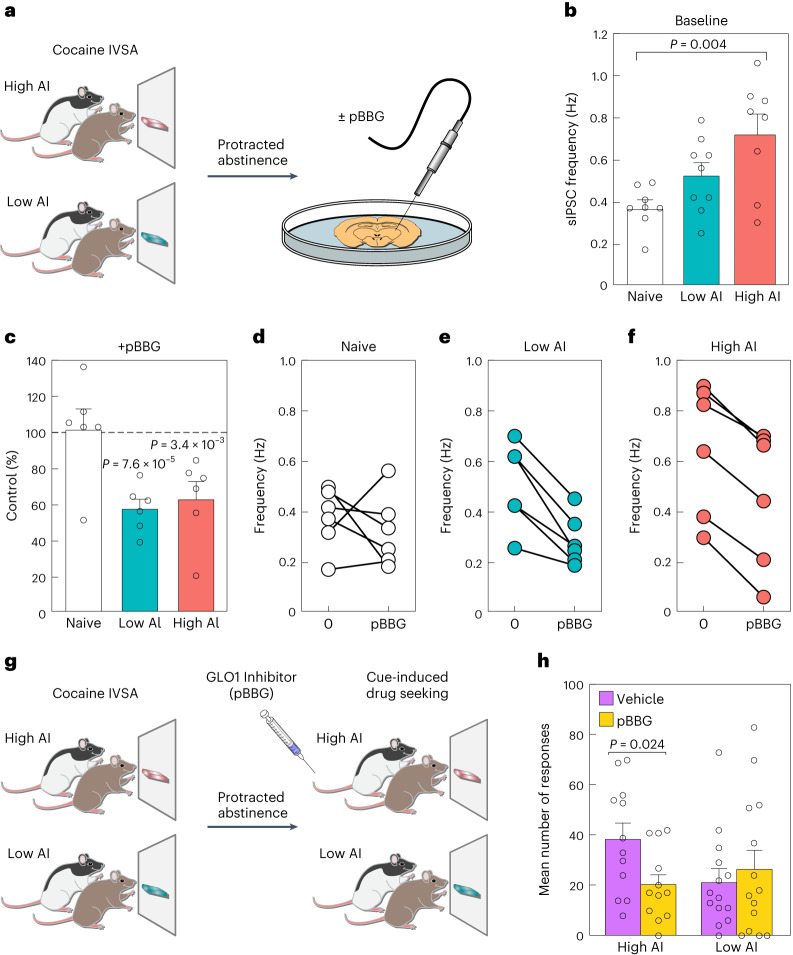
The amygdala processes positive and negative valence and contributes to addiction, but the cell-type-specific gene regulatory programs involved are unknown. We generated an atlas of single-nucleus gene expression and chromatin accessibility in the amygdala of outbred rats with high and low cocaine addiction-like behaviors following prolonged abstinence. Differentially expressed genes between the high and low groups were enriched for energy metabolism across cell types. Rats with high addiction index (AI) showed increased relapse-like behaviors and GABAergic transmission in the amygdala. Both phenotypes were reversed by pharmacological inhibition of the glyoxalase 1 enzyme, which metabolizes methylglyoxal-a GABAA receptor agonist produced by glycolysis. Differences in chromatin accessibility between high and low AI rats implicated pioneer transcription factors in the basic helix-loop-helix, FOX, SOX and activator protein 1 families. We observed opposite regulation of chromatin accessibility across many cell types. Most notably, excitatory neurons had greater accessibility in high AI rats and inhibitory neurons had greater accessibility in low AI rats.


Conflict of interest statement

A.A.P. holds a patent related to the use of GLO1 inhibitors (US20160038559, active). The inventors of this patent are A. Palmer and M. Distler. All other authors declare no competing interests.

Figures

Fig. 1
Fig. 1. Experimental design and rat IVSA cocaine model of addiction.
a, Schematic of the study design. b, Timeline of the behavioral protocol. c, Individual differences in total number of cocaine rewards in self-administration (SA), PR and shock-paired (Shock) sessions for each rat. d, Mean AI scores in high and low AI rats. e, Mean number of cocaine rewards across each ShA and LgA IVSA session in high (n = 21) and low (n = 25) AI rats. f, Breakpoint analysis of high (n = 21) and low (n = 25) AI rats under ShA versus LgA (unpaired two-sided Studentʼs t-test with Bonferroni adjusted P = 0.0001; ShA versus LgA for high AI rats, t41 = 4.525). g, Mean number of cocaine rewards when paired with electric footshock in high (n = 21) and low AI (n = 25) rats (P = 0.0003; unpaired two-sided Studentʼs t-test, t44 = 3.936). Error bars in dg represent s.e.m.
Fig. 2
Fig. 2. Summary of single-nucleus RNA-seq and ATAC-seq data from rat amygdala.
a, UMAP plot of snRNA-seq data from rat amygdala. Data are combined across 19 samples, with high, low and naive AI labels. Cells are colored by cluster assignments performed with KNN analysis. We assigned cell-type labels to clusters based on the expression of known marker genes. b, UMAP plot of snATAC-seq data from 12 rat amygdala samples. snATAC-seq data were integrated with snRNA-seq data, and cluster labels were transferred to snATAC-seq cells. c, Feature plot showing expression of marker genes used to label main subsets of cells: Gja1 (astrocytes), Ctss (microglia), Cnp (oligodendrocytes), Pdgfra (OPCs), Slc17a7 (excitatory neurons), Gad1/Gad2 (inhibitory neurons) and Cldn5 (endothelial cells). d, Feature plot showing imputed gene expression of cell-type-specific marker genes in snATAC-seq dataset. e, Expression of marker genes in cell clusters corresponding to highly specific subsets of inhibitory neurons. The shading and diameter of each circle indicate the estimated mean expression and the percentage of cells in the cluster in which the marker gene was detected. f, The number of nuclei assigned to each cell-type cluster for the snATAC-seq and snRNA-seq datasets.
Fig. 3
Fig. 3. Differential gene expression between high and low AI rats.
a, Volcano plot summarizing differential gene expression between high and low AI rats based on a two-sided negative binomial test. Points are colored by cell type, and the five most significant (FDR < 10%) up- and downregulated genes in each cell type are indicated with labels. In each cell type, we normalized the logFC values reported by Seurat to convert to z-scores and plotted the cell-type-specific z-scores on the x axis (z > 0 indicates higher expression in high AI rats; z < 0 indicates higher expression in low AI rats). The –log10FDR-corrected P values (Q values) are plotted on the y axis. b, Volcano plot summarizing differential gene expression based on a two-sided negative binomial test between high and low AI rats for non-neuronal (glial) cell-type clusters. ce, Violin and embedded boxplots showing distribution of log2FC from the negative binomial (negbinom) test performed in 1,000 bootstrap iterations. Fractions indicate the number of bootstrap iterations in which the log2FC estimate was significantly different from 0. Boxplot hinges are the 25th and 75th percentiles; whiskers extend to the minimum and maximum; center line is the median and dotted line is the mean. Bootstrap distributions were obtained for cell types in which the following genes had significant differential expression (FDR < 10%): Kcnq3 (c), Fkbp5 (d) and Sgk1 (e). f, KEGG pathways that are enriched for DEGs by cell type. Dot size indicates –log10(Q) while color indicates normalized enrichment score (NES), which is a metric of GSEA. Only pathways/cell types where Q < 0.1 are visualized. MAPK, mitogen-activated protein kinase; TNF, tumor necrosis factor; TRP, transient receptor potential.
Fig. 4
Fig. 4. Electrophysiology and GLO1 inhibition experiments implicate GABAergic inhibition in cocaine addiction-like behaviors.
a, Schematic showing animal model used for electrophysiology recording in CeA slices from HS rats subjected to 4 weeks of abstinence from cocaine IVSA. Electrophysiological recordings were taken before and after pBBG treatment from tissue slices of five naive, five low AI and five high AI rats. b, Baseline sIPSC frequency before pBBG injection. A significant difference between the means of the naive versus high AI rats was observed (adjusted P = 0.004, Tukey’s honestly significant difference test). c, sIPSC frequency following pBBG treatment. We observed significantly reduced frequency in the CeA slices from high and low AI rats but not in naive rats when we compare baseline versus pBBG in each group (Phigh = 7.6 × 10–5; Plow = 3.4 × 10–3, Pnaive = 0.51, paired two-sided Student’s t-test). df, Change in sIPSC frequency following pBBG treatment in naive (d), low AI (e) and high AI (f) rats. g, Schematic of animal model used to test cue-induced cocaine-seeking behavior. Rats with low and high AI were injected with vehicle or pBBG following a period of prolonged abstinence, and re-exposed to SA chambers in the absence of cocaine. h, Following injection of pBBG, cocaine-seeking behavior in high AI rats (n = 12), but not low AI rats (n = 14), was reduced by pBBG treatment (unpaired Student’s t-test with Bonferroni adjusted P = 0.024, vehicle versus pBBG in high AI rats). Error bars in panels b, c, and h represent s.e.m.
Fig. 5
Fig. 5. Analysis of chromatin accessibility and regulatory elements involved in cocaine dependence.
a, Pseudobulk chromatin accessibility at the promoter regions of marker genes for main cell types. b, Significant DEGs (FDR < 10%) for each main cell type are enriched for promoters with DA chromatin. Points are log2OR (odds ratio) and error bars are 95% CIs (FDR < 10%; two-sided FET, n = 12,081 genes for astrocytes, n = 12,590 for ExNeuron, n = 12,679 for InhNeuron, n = 11,232 for microglia, n = 11,886 for oligodendrocytes and n = 11,646 for OPC). This indicates that the snRNA-seq and snATAC-seq results are consistent and that gene expression changes are associated with changes in promoter chromatin accessibility. c, Cell-type-specific DA peaks are enriched in TSS/promoter regions compared with non-TSS/promoter regions. Points are log2OR and error bars are 95% CIs (FDR < 10%; two-sided FET, n = 291,844 peaks) d, Heatmap showing differential activity of various motifs in the significant differential peaks of each cell type. Values indicate average difference of chromVAR deviation scores with –log10(Q) in parentheses, where Q is the Benjamini–Hochberg FDR-corrected P value from a two-sided Wilcoxon signed rank test for difference in deviation scores. There are many cases where motifs display increased activity in upregulated peaks in neurons while also displaying decreased activity in downregulated peaks in oligodendrocytes. eg, Volcano plots showing average (mean) difference (x axis) and –log10(Q) (y axis) of chromVAR deviation scores for the top 50 motif clusters in excitatory neurons (e), inhibitory neurons (f) and oligodendrocytes (g). h, LD score regression results showing significance of enrichment of heritability for several traits related to alcohol and nicotine addiction in cell-type-specific accessible chromatin regions (mapped to hg19). Significance is reported as –log10(Q), where Q is the Benjamini–Hochberg FDR-corrected P value obtained from the ldsc software.

References

    1. Janak PH, Tye KM. From circuits to behaviour in the amygdala. Nature. 2015;517:284–292. doi: 10.1038/nature14188. - DOI - PMC - PubMed
    1. Roberto M, Gilpin NW, Siggins GR. The central amygdala and alcohol: role of γ-aminobutyric acid, glutamate, and neuropeptides. Cold Spring Harb. Perspect. Med. 2012;2:a012195. doi: 10.1101/cshperspect.a012195. - DOI - PMC - PubMed
    1. Buffalari, D. M. & See, R. E. in Behavioral Neuroscience ofDrug Addiction (eds. Self, D. W. & Staley Gottschalk, J. K.) (Springer, 2010); 10.1007/7854_2009_18
    1. Koob, G. F. in Anhedonia: Preclinical, Translational, and Clinical Integration (ed. Pizzagalli, D. A.) (Springer, 2022); 10.1007/7854_2021_288
    1. Pickens CL, et al. Neurobiology of the incubation of drug craving. Trends Neurosci. 2011;34:411–420. doi: 10.1016/j.tins.2011.06.001. - DOI - PMC - PubMed