. 2023 Oct;25(10):1415-1425.
doi: 10.1038/s41556-023-01240-7. Epub 2023 Oct 5.

Spatial heterogeneity of bone marrow endothelial cells unveils a distinct subtype in the epiphysis

Affiliations

Spatial heterogeneity of bone marrow endothelial cells unveils a distinct subtype in the epiphysis

Takahito Iga et al. Nat Cell Biol. 2023 Oct.

Abstract

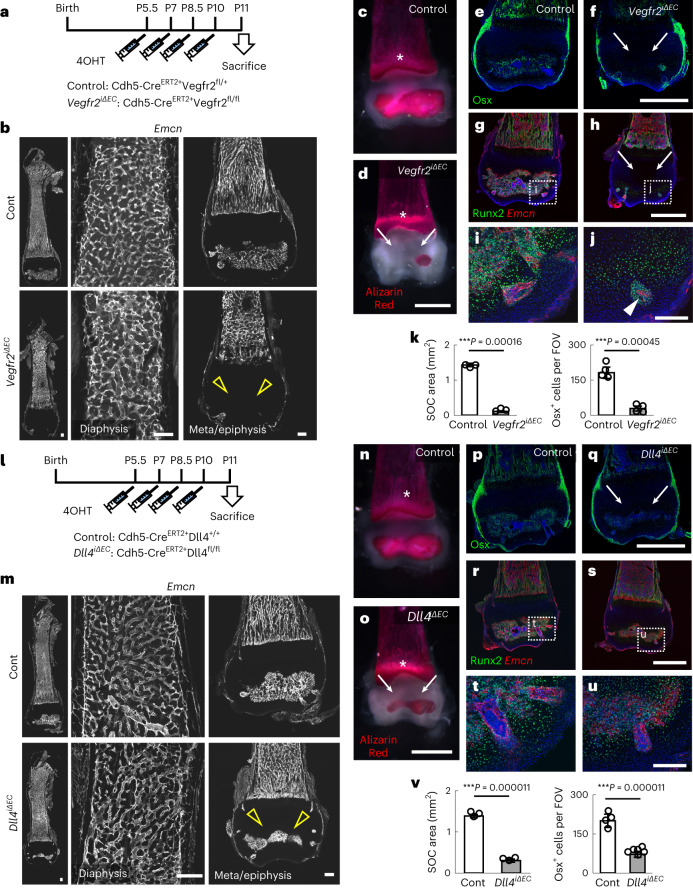
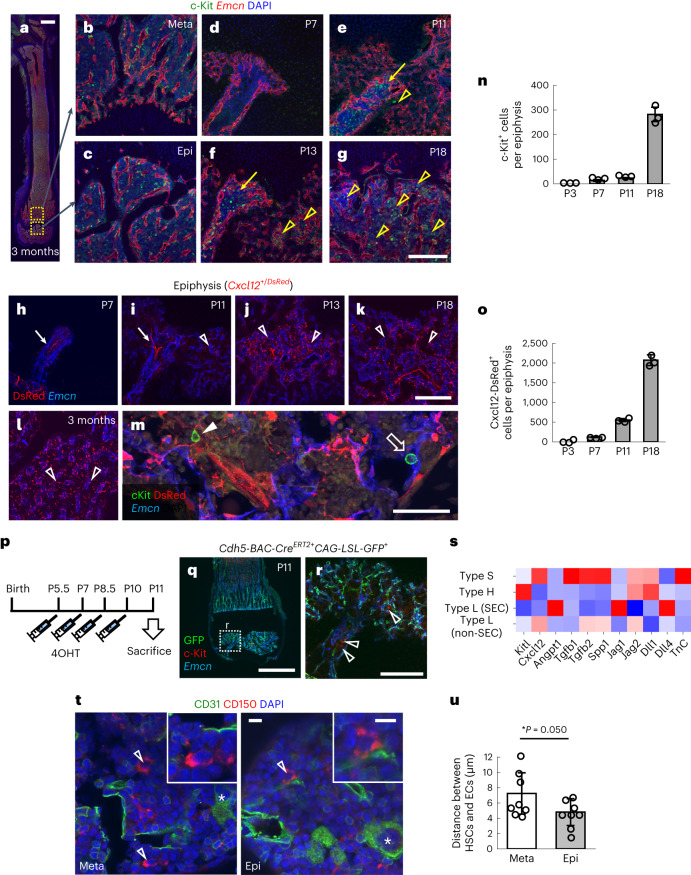
Bone marrow endothelial cells (BMECs) play a key role in bone formation and haematopoiesis. Although recent studies uncovered the cellular taxonomy of stromal compartments in the bone marrow (BM), the complexity of BMECs is not fully characterized. In the present study, using single-cell RNA sequencing, we defined a spatial heterogeneity of BMECs and identified a capillary subtype, termed type S (secondary ossification) endothelial cells (ECs), exclusively existing in the epiphysis. Type S ECs possessed unique phenotypic characteristics in terms of structure, plasticity and gene expression profiles. Genetic experiments showed that type S ECs atypically contributed to the acquisition of bone strength by secreting type I collagen, the most abundant bone matrix component. Moreover, these cells formed a distinct reservoir for haematopoietic stem cells. These findings provide the landscape for the cellular architecture in the BM vasculature and underscore the importance of epiphyseal ECs during bone and haematopoietic development.


Conflict of interest statement

The authors declare no competing interests.

Figures

Fig. 1
Fig. 1. Spatial heterogeneity of transcriptomes in BMECs.
a, Schematic diagram depicting the strategy for scRNA-seq of BMECs. bd, Feature plots of BMECs of three bone fragments and clustering based on the expression of canonical endothelial subtype markers. Dia, diaphysis; Epi, epiphysis; Meta, metaphysis. b, Feature plot showing all cells derived from three datasets (epiphysis, metaphysis and diaphysis). c, Feature plot showing all cells derived from three datasets (epiphysis, metaphysis and diaphysis) with annotation for each cluster. d, Feature plots showing expression of marker genes with enriched expression for each endothelial cluster. The arrowheads in d indicate clusters represented by each marker. e, Violin plots showing the expression of pan-endothelial and type H markers. f, Violin plots showing the expression of genes enriched in type S ECs. g, Feature plots of BMECs. Col1a1 and Col1a2 genes are highly expressed in type S ECs (arrowheads), although their expression is highest in OBs/MSCs (arrows). h, A heatmap showing expression of various collagen genes. i, Flow cytometric analysis of isolated CD31+CD45 BM cells at P11 (Ly6ahighLy6chigh surface protein levels) (n = 4, biologically independent experiments). The P value for the epiphysis versus the metaphysis is 0.000012. j, Immunohistochemistry of femur sections at P11. Ly6a is abundantly expressed in type S ECs (closed arrowheads) and AECs (asterisks), but weakly in type H ECs (open arrowheads). In the box plots of e and f the lower and upper bounds of box represent the 25th and 75th percentiles, respectively; the box represents the middle 50% of the data, namely the interquartile range (IQR); the horizontal line within the box represents the median; and the lower and upper bounds of the whiskers represent the minimum and maximum values within 1.5× the IQR below the 25th percentile and above the 75th percentile, respectively. The black dots represent outliers. Scale bar, 200 µm. Data presented are the mean ± s.d. The comparisons between the averages of two groups were evaluated using the two-tailed Student’s t-test. Source data
Fig. 2
Fig. 2. Molecular and morphological features of type S ECs.
af, Whole-mount Alizarin Red staining (b at P7, (d) at P11 and f at P28) and section immunostaining of femurs (a at P7, c at P11 and e at P28). Vessel invasion of the epiphysis (open arrowheads) and SOC formation (arrows) occur at P7 and spread three-dimensionally during the second week after birth. g, Quantification of vessels and calcified areas in the epiphysis (P3, P7 and P11: n = 4; P28: n = 5, biologically independent experiments). hl, Immunohistochemistry of femurs (vertical (h at P7 and i at P11) or horizontal sections j at P7 (epiphysis), k at P11 (epiphysis) and l at P11 (metaphysis)). Open arrowheads indicate vessel invasion points. m, Micro-CT angiography at P11 showing the heatmap of vessel perfusion of the knee joint. Open arrowheads indicate vessel invasion points. n, Schematic diagram showing the structural difference between type H (columnar) and type S (dendritic) vessels. o,p, Immunohistochemistry of femur sections at P11 (o) or 6 months after birth (p). The growing edges of type S and type H vessels highly express CD31 (open arrowheads) and Vegfr3 (arrows), and project short filopodia towards avascular areas (insets in the leftmost panels). Vegfr1 is specifically expressed in type H ECs (closed arrowheads). R3, Vegfr3; R2-GFP, GFP in Vegfr2-GFP transgenic mice; R1-RFP, red fluorescent protein (RFP) in Vegfr1-RFP transgenic mice. Scale bars, 1 mm (af, hl and m); 200 µm (o and p). Data presented are the mean ± s.d. Source data
Fig. 3
Fig. 3. Type S vessels are highly plastic and crucial for osteogenesis.
a, Protocol for 4OHT injection in neonates. bd, Femur sections (b) and whole-mount Alizarin Red staining (control (c) and Vegfr2iΔEC (d)) at P11. Vegfr2iΔEC mice show severely impaired angiogenesis (open arrowheads) and osteogenesis (arrows) in the epiphysis, although metaphyseal ossification is largely intact (asterisks). ej, Immunohistochemistry of femur sections stained with Osx and DAPI (e,f) or Runx2 and Emcn (gj). Panels i and j how the high magnification views of the area indicated in g and h. Panels e, g and i are from control, and panels f, h and j are from Vegfr2iΔEC mice. Osx+ and Runx2+ cells are found around vessels, their numbers are reduced (arrows) and they are detected only around surviving vessels (arrowhead) in Vegfr2iΔEC mice. k, Quantification of the SOC area (n = 3, biologically independent experiments) and Osx+ cells (n = 4, biologically independent experiments) in the epiphysis. l, Protocol for 4OHT injection in neonates. mo, Femur sections (m) and whole-mount Alizarin Red staining (control (n) and Dll4iΔEC (o)) at P11. Dll4iΔEC mice have an increased vessel density but a reduced vascularized area (open arrowheads) and reduced osteogenesis (arrows) in the epiphysis, although metaphyseal ossification is largely intact (asterisks). pu, Immunohistochemistry of femur sections stained with Osx and DAPI (p,q) or Runx2 and Emcn (ru). Panels t and u show the high magnification views of the area indicated in r and s. Panels p, r and t are from control, and panels q, s and u are from Dll4iΔEC mice. Osx+ and Runx2+ cells are found around vessels and their numbers are reduced (arrows) in Dll4iΔEC mice. v, Quantification of the SOC area (n = 3, biologically independent experiments) and Osx+ cells (control: n = 4, Dll4iΔEC: n = 6, biologically independent experiments) in the epiphysis. Data are presented as the mean ± s.d. ***P < 0.001; two-tailed Student’s t-test. Scale bars, 1 mm (ch and ns); 200 µm (b,i,j,m,t,u). The comparisons between the averages of two groups were evaluated using the two-tailed Student’s t-test. Source data
Fig. 4
Fig. 4. Type S vessels contribute to osteogenesis by secreting type I collagen.
a, A heatmap showing osteogenic factors based on the scRNA-seq data shown in Fig. 1. b, Quantitative PCR analysis of CD31+CD45 cells derived from femurs of P11 mice (n = 3, biologically independent experiments). c, Protocol for 4OHT injection in neonates. di, TEM of epiphyseal sections of P11 mice. Panels d, f and h are from control, and e, g and i are from Col1a1iΔEC mice. Panels f and g show the area of perivascular collagen fibres with dotted area of d and e. Panels h and i show high magnification views of the area indicated in d and e, respectively. The bands of collagen fibres around blood vessels (dotted area) are thin and sparse in Col1a1iΔEC mice (asterisks). j,k, Whole-mount Alizarin Red staining of femurs at P11 (j) and quantification (k) (control: n = 7; Col1a1iΔEC: n = 6, biologically independent experiments). Arrows indicate reduced mineralization in the epiphyses and the asterisk indicates intact ossification in the diaphyses and metaphyses of Col1a1iΔEC mice. lp, Immunohistochemistry of femur sections at P11 stained with Runx2, Emcn and DAPI (l,m) or Osx, Emcn and DAPI (n,o). Panels l and n are from control, and m and o are from Col1a1iΔEC mice. Quantification of Osx+ cells (n = 4, biologically independent experiments) is shown in p. q, X-ray images of adult mice. Col1a1iΔEC mice show reduced X-ray intensity (asterisks) in the epiphysis. rt, Mechanical strength of the femoral distal epiphysis or diaphysis measured by a compression test. Panel r shows the scheme of the test, and quantification of the maximum load of the epiphysis (s) and the metaphysis (t) is shown individually (control: n = 4; Col1a1iΔEC: n = 3, biologically independent experiments). The epiphysis has inferior biomechanical properties in Col1a1iΔEC mice. Scale bars, 1 mm (j and q); 200 μm (lo); 10 μm (dg); and 1 μm (h and i). *P < 0.05; data presented are the mean ± s.d. The comparisons between the averages of two groups were evaluated using the two-tailed Student’s t-test. Source data
Fig. 5
Fig. 5. Type S vessels postnatally establish a satellite niche for HSPCs.
ag, Immunohistochemistry of femur sections at 3 months after birth (ac), P7 (d), P11 (e), P13 (f) and P18 (g). Panels b and c show the high magnification views of the area indicated in a. The c-Kit+ cells start to appear in the entry point of type S vessels around P11 (arrows) and gradually spread in the epiphysis thereafter (arrowheads). hm, Immunohistochemistry of femur sections from Cxcl12+/DsRed mice at P7 (h), P11 (i), P13 (j) and P18 (k), and 3 months after birth (l,m). Panel m shows the high magnification view co-stained with cKit and Emcn. The arrows indicate DsRed expression detected in arteries. MSCs appear at P11 and spread throughout the epiphysis thereafter (open arrowheads). Most c-Kit+ cells are located in contact with MSCs (closed arrowhead) or ECs (open arrow). n,o, Quantification of c-Kit+ cells (n) and Cxcl12-DsRed+ cells (o) in BM sections at various stages (n = 3, biologically independent experiments). p, Protocol for 4OHT injection in neonates. q,r, Immunohistochemistry of femur sections. Panel r shows the high magnification view of the area indicated in q. Lineage tracing using Cdh5-BAC-CreERT2 mice shows that c-Kit+ cells (arrowheads) do not originate from haemogenic endothelium in type S vessels. s, A heatmap showing HSPC niche factors based on the scRNA-seq data shown in Fig. 1. t,u, Immunohistochemistry of femur sections from a mouse at 3 months (t) and quantification (u) (n = 8, biologically independent experiments). The distance between HSCs (open arrowheads) and ECs is smaller in epiphyses than in metaphyses. Asterisks are CD31+ megakaryocytes. Scale bars, 1 mm (a and q); 200 µm (bg and hl,r); 50 µm (m); and 10 µm (t). Data presented are the mean ± s.d. *P < 0.05. The comparisons between the averages of two groups were evaluated using the two-tailed Student’s t-test. Source data
Fig. 6
Fig. 6. Type S vessels harbour HSCs.
a, Protocol for 4OHT injection during the second week after birth. b, Immunohistochemistry of femur sections at P18 and quantification (vessel area: n = 3, c-Kit+ cells per FOV: n = 4, biologically independent experiments). Vegfr2iΔEC mice lack c-Kit+ cells especially in the avascular area (asterisks). c, Protocol for tamoxifen injection in adult mice. d, Flow cytometric analysis of BM cells isolated from the epiphysis of 12-week-old mice and quantification (n = 3, biologically independent experiments). Scale bar, 200 µm. **P < 0.01; *P < 0.05. Data presented are the mean ± s.d. The comparisons between the averages of two groups were evaluated using the two-tailed Student’s t-test. Source data
Fig. 7
Fig. 7. Epiphysial HSCs reconstitute long-term multilineage haematopoiesis.
a,b, Flow cytometric analysis of BM cells isolated from the epiphysis and metaphysis of 12-week-old mice (a) and quantification (b) (n = 3, biologically independent experiments). c,d, Quantification of donor-derived cells (c) and lineage differentiation in peripheral blood samples (d) after the first BMT (n = 6, biologically independent experiments). e, Chimaerism of donor-derived cells in the BM (n = 6, biologically independent experiments) at 4 months after the first BMT. f,g, Quantification of donor-derived cells (f) and lineage differentiation in peripheral blood samples (g) after the second BMT (n = 6, biologically independent experiments). h,i, Flow cytometric analysis of BM cells isolated from the epiphysis and metaphysis of 12-week-old mice (h) and quantification (i) (n = 4, biologically independent experiments). The cell-cycle state was determined by DAPI and Ki67 staining. ***P < 0.001; **P < 0.01; *P < 0.05. Data presented are the mean ± s.d. The comparisons between the averages of two groups were evaluated using the two-tailed Student’s t-test. Source data
Extended Data Fig. 1
Extended Data Fig. 1. Quality control and characterization of endothelial clusters in scRNA-seq.
(a) Statistics of cells analyzed by scRNA-seq. (b) Immunohistochemistry of a femur section mechanically dissected into three fragments: diaphysis (Dia), metaphysis (Meta), and epiphysis (Epi). (c) Violin plots of internal control genes for the comparison of all fragments. (d) A scatter plot of normalized expression and ridge plots of raw UMI (Unique Molecular Identifier) counts for Col1a1 and Col1a2. Both plots confirm that definite populations of type S ECs express these genes abundantly. (e) IPA showing the top four networks represented by genes upregulated in type S ECs. Scale bar: 1 mm. In the box plots of c, the lower and upper bounds of box represent the 25th and 75th percentile, respectively. The box represents the middle 50% of the data, namely interquartile range (IQR). The horizontal line within the box represents median. The lower and upper bounds of whisker represent the the minimum and maximum values within 1.5 times the interquartile range below the 25th percentile and above the 75th percentile, respectively. The black dots represent outliers. Data presented are the mean ± SD.
Extended Data Fig. 2
Extended Data Fig. 2. Expression of VEGF receptors and vascular changes caused by Vegfr2 or Dll4 deficiency.
(a) Quantification of the number of tip cell filopodia per 1 mm length of vascular front at P11 (diaphysis: n = 3, metaphysis and epiphysis: n = 4, biologically independent experiments). (b–d) Quantification of the relative intensities of Vegfr1-RFP, Vegfr2-GFP, and Vegfr3 immunoreactivity at P11 shown in Fig. 2o (n = 3, biologically independent experiments). (e, f) Immunohistochemistry of femur sections from mice at P11. ***P<0.001; **P<0.01; *P<0.05. Data presented are the mean ± SD. Scale bar: 50 µm. The comparisons between the averages of two groups were evaluated using the two-tailed Student’s t-test. Source data
Extended Data Fig. 3
Extended Data Fig. 3. Osteogenic Notch signaling and dominance of endothelial Vegfr2 over Dll4.
(a) Protocol for 4OHT injection in neonates. P, postnatal. (b–h) Immunohistochemistry of femur sections and whole-mount Alizarin red staining at P11 and quantification (Cont: = 3, Rbpj iΔOsx: n = 4, biologically independent experiments). (i) Protocol for 4OHT injection in neonates. (j–m) Immunohistochemistry of femur sections at P11. Combined deletion of Vegfr2 and Dll4 in ECs shows that the phenotypes resulting from Vegfr2 knockout dominate those resulting from Dll4 knockout (open arrowheads). Scale bars: 1 mm (b, c, f, g, j, k); 200 µm (d, e, l, m). Data presented are the mean ± SD. The comparisons between the averages of two groups were evaluated using the two-tailed Student’s t-test. Source data
Extended Data Fig. 4
Extended Data Fig. 4. Osteoclasts are dispensable for epiphyseal vascularization.
(a) Immunohistochemistry of femur sections from mice at P11. (b–g) Femur sections at P11. Csf1op/op mice lack CatepsinK+ osteoclasts, but vessel invasion and formation in the epiphysis occur normally. Scale bars: 1 mm (b–e); 50 µm (a, f, g).
Extended Data Fig. 5
Extended Data Fig. 5. DsRed expression in Cxcl12+/DsRed mouse.
(a–g) Immunohistochemistry of a femur section from a Cxcl12+/DsRed mouse at P11. DsRed+ AECs are covered by ASMA+ smooth muscle cells. CGRP+ sensory nerves are located around arteries and do not express DsRed. Scale bars: 50 µm (a); 20 μm (b–g).
Extended Data Fig. 6
Extended Data Fig. 6. Limiting dilution analysis of epiphyseal and metaphyseal cells.
Limiting dilution transplantation analysis using the Poisson statistical method (n = 8 recipients per group). Solid lines indicate the optimal linear model fit, while dotted lines represent the 95% confidence interval. The estimated frequencies of repopulating HSCs within the CD150+CD48LSK fraction are displayed. Epi, epiphysis; Meta, metaphysis.

References

    1. Potente M, Gerhardt H, Carmeliet P. Basic and therapeutic aspects of angiogenesis. Cell. 2011;146:873–887. - PubMed
    1. Augustin HG, Koh GY. Organotypic vasculature: from descriptive heterogeneity to functional pathophysiology. Science. 2017;357:eaal2379. - PubMed
    1. Rafii S, Butler JM, Ding B-S. Angiocrine functions of organ-specific endothelial cells. Nature. 2016;529:316–325. - PMC - PubMed
    1. Kalucka J, et al. Single-cell transcriptome atlas of murine endothelial cells. Cell. 2020;180:764–779.e720. - PubMed
    1. Vanlandewijck M, et al. A molecular atlas of cell types and zonation in the brain vasculature. Nature. 2018;554:475–480. - PubMed

Publication types