. 2023 Nov;24(11):1867-1878.
doi: 10.1038/s41590-023-01642-7. Epub 2023 Oct 5.

Depletion of slow-cycling PDGFRα+ADAM12+ mesenchymal cells promotes antitumor immunity by restricting macrophage efferocytosis

Affiliations

Depletion of slow-cycling PDGFRα+ADAM12+ mesenchymal cells promotes antitumor immunity by restricting macrophage efferocytosis

Selene E Di Carlo et al. Nat Immunol. 2023 Nov.

Abstract

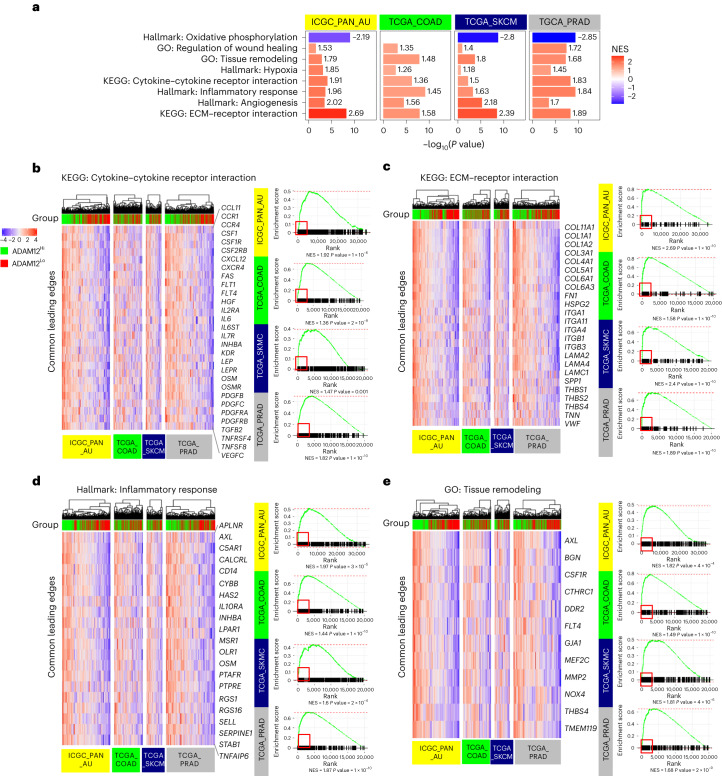
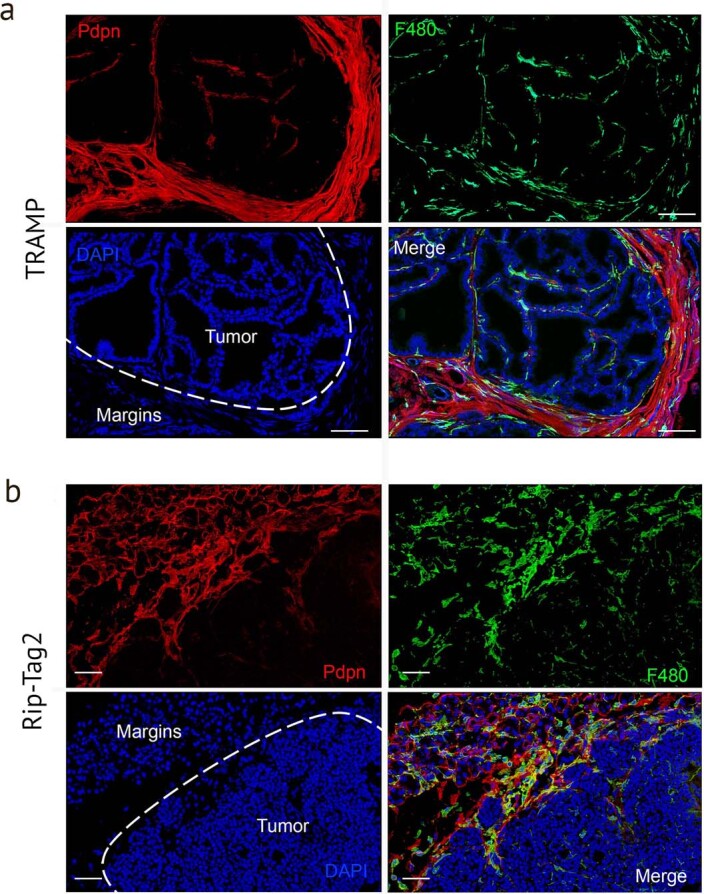
The capacity to survive and thrive in conditions of limited resources and high inflammation is a major driver of tumor malignancy. Here we identified slow-cycling ADAM12+PDGFRα+ mesenchymal stromal cells (MSCs) induced at the tumor margins in mouse models of melanoma, pancreatic cancer and prostate cancer. Using inducible lineage tracing and transcriptomics, we demonstrated that metabolically altered ADAM12+ MSCs induced pathological angiogenesis and immunosuppression by promoting macrophage efferocytosis and polarization through overexpression of genes such as Gas6, Lgals3 and Csf1. Genetic depletion of ADAM12+ cells restored a functional tumor vasculature, reduced hypoxia and acidosis and normalized CAFs, inducing infiltration of effector T cells and growth inhibition of melanomas and pancreatic neuroendocrine cancer, in a process dependent on TGF-β. In human cancer, ADAM12 stratifies patients with high levels of hypoxia and innate resistance mechanisms, as well as factors associated with a poor prognosis and drug resistance such as AXL. Altogether, our data show that depletion of tumor-induced slow-cycling PDGFRα+ MSCs through ADAM12 restores antitumor immunity.


Conflict of interest statement

The authors declare no competing interests.

Figures

Fig. 1
Fig. 1. Genetic depletion of ADAM12+ MSCs restores tumor immunity.
a, Immunofluorescence staining of PDPN, αSMA, CD3 and collagen in MO5 melanomas. The inset shows CD3+ T cells (green) on PDPN+ stromal cells (red). b, Immunofluorescence staining of PDPN, CD31 and ADAM12 (GFP) in MO5 melanomas in ADAM12-GFP mice. The inset shows GFP+ cells (green) close to CD31+ blood vessels (blue; marked with an arrowhead). Scale bars, 100 µm. One representative image from four (a) or six (b) independent experiments is shown. Right, FACS plot and percentage of CD45CD31cells and GFP+ cells in MO5 melanomas 8 d after tumor inoculation. c, Percentage of GFP+ cells, measured by FACS, in PDGFRα+ stroma isolated from normal skin (day 0, n = 2) or MO5 tumors (n = 6 for 8–12 d and n = 4 for 14–17 d), and in other populations (n = 3). d,e, Tumor growth curves (average tumor volume) from ADAM12-DTR (DTR) and littermate mice (Ctrl) treated with diphteria toxin (DT) from days 10 to 18 (DTR, n = 10; Ctrl, n = 12) (d), or from days 0 to 10 (DTR, n = 5; Ctrl, n = 7) (e) after tumor inoculation. The x axis represents days after tumor inoculation. f, Percentage of tumor-infiltrating CD3+ T cells (n = 8 for Ctrl, n = 12 for DTR), CD8+ T cells (n = 14 for Ctrl, n = 17 for DTR), IFN-γ+CD8+ T cells (n = 7 for Ctrl, n = 6 for DTR), NK cells (n = 9 for Ctrl, n = 9 for DTR) and IFN-γ+ NK cells (n = 16 for Ctrl, n = 14 for DTR) in mice treated with DT from day 10, measured by FACS in three independent experiments. Statistics were calculated using ordinary two-way analysis of variance (ANOVA) (d,e) or two-tailed, unpaired Student’s t-test (f). Quantitative data are presented as means ± s.d. n.s., not significant. Source data
Fig. 2
Fig. 2. Depletion of ADAM12+ MSCs normalizes the stromal/vascular TME.
a, Immunofluorescence staining of PDPN, CD3 and CD31 in MO5 tumors of ADAM12-DTR mice (DTR) and littermates (Ctrl) treated with DT from day 10. One representative image of several independent experiments (n = 4) is shown. Scale bars, 100 μm. b, Tumor-infiltrating CD3+ T cells in mice treated as in a; n = 7 in 2 independent experiments. c, Percentage of PDPN+PDGFRα+ cells (gated CD45CD31), measured by FACS, in MO5 tumors of mice treated as in a; n = 12 (Ctrl)–14 (DTR) in 3 independent experiments. d, Percentage of MO5 tumors containing Pdpn+ stromal cells, as indicated in mice treated as in a. n = 6–8 in 4 independent experiments. e, Volcano plot showing differentially expressed (DE) genes in PDPN+PDGFRα+ cells isolated from DTR versus Ctrl tumors. f, Tumor hypoxia was assessed by immunofluorescence staining of pimonidazole in tumors treated as in a (n = 4). Scale bars, 100 μm. g, Extracellular pH in tumors growing in mice treated as in a, or in Ctrl mice treated with U-104. n = 10(Ctrl)–11(DTR) in 3 independent experiments. h, Expression of Car9, as measured by qRT–PCR, in tumors from mice treated as in a; n = 9 (Ctrl)–10 (DTR) in 2 independent experiments. i, Immunofluorescence staining of NG2+ pericytes and CD31+ blood vessels in tumor sections from mice treated as in a. Left, n = 22 (Ctrl)–32 (DTR) and right, n = 15 (Ctrl)–28 (DTR) blood vessels. j, Immunofluorescence staining of ICAM1, CD45 and CD31 in tumor sections from mice treated as in a; n = 11 (Ctrl)–17 (DTR) fields. k, Tissue perfusion, as detected by Hoechst 33342 staining, in tumor sections from mice treated as in a; n = 10 (Ctrl)–8 (DTR). Scale bar, 200 μm. In ik, data are representative of several independent experiments (3–5). In ij, scale bars, 50 μm. Statistics were calculated using two-tailed, unpaired Student’s t-test (f,h,i(right),j,k), ordinary one-way ANOVA (g), two-tailed Mann–Whitney test (b,c,i(left)) or two-sided Wald test (DESeq2) (e). All quantitative data are presented as means ± s.d. Source data
Fig. 3
Fig. 3. Slow-cycling ADAM12+ MSCs promote protumor inflammation and tissue remodeling.
a, Heat map of RNA-seq differential gene expression analysis of ADAM12+ PDPN+PDGFRα+ (GFP+) versus ADAM12PDPN+PDGFRα+ (GFP) CD45CD31 cells isolated by FACS from MO5 tumors growing in ADAM12-GFP mice (n = 4). b,c, Pathway enrichment analysis of genes significantly upregulated (b) or downregulated (c) in GFP+ cells, using KEGG annotation. d, Differential gene expression analysis (GFP+ cells versus GFP cells). The bar plots represent log2(fold change). e, Left, immunofluorescence staining of the indicated markers in MO5 tumors growing in ADAM12-GFP mice. One representative image of three to four independent experiments is shown. Right, quantification of staining in the left panel. Scale bars, 50µm. f, Growth curve of GFP+ and GFP cells isolated from MO5 tumors, n = 4 (GFP+)–7 (GFP). OD, optical density. g, Expression of the indicated transcripts, measured by qRT–PCR, in ADAM12 PDGFRα+ cells isolated from MO5 tumors and treated with TGF-β; n = 3 (–TGF-β)–4 (+TGF-β), except for Adam12, n = 5 (–TGF-β)–4 (+TGF-β). h, Expression of the indicated transcripts, measured by qRT–PCR, in ADAM12+PDGFRα+ cells treated with IL-1β or OSM (fold change treated versus non treated). +IL-1β, n = 3, except for Il6, n = 5; OSM, n = 4, except for Mmp3 and Gadd45g, n = 3. Statistics were calculated using one-way ANOVA (e), two-way ANOVA (f) or two-tailed, unpaired Student’s t-test (g,h). All quantitative data are presented as means ± s.d. Source data
Fig. 4
Fig. 4. ADAM12+ MSCs induce immunosuppressive macrophages by promoting efferocytosis.
a,b, Immunofluorescence staining of the indicated markers in MO5 tumors at 8 d (a) and 12 d (b) growing in ADAM12-GFP mice. Scale bar in a, 100 µm (left, middle) and 50 µm (right); in b, 50 µm. In b, distance of GFP+ cells to AXL-P+ macrophages (right). Results are representative of four independent experiments. c, Gene expression of Axl, Mertk and Tyro3, measured by qRT–PCR, in macrophages isolated from MO5 tumors (n = 4). d, Gene expression of Gas6, measured by qRT–PCR, in ADAM12+ and ADAM12 cells isolated from MO5 tumors; n = 4 from independent experiments. e, Secretion of Gas6, measured by ELISA (n = 3). Results are representative of three independent experiments. f, Efferocytosis test in BMDMs isolated from the indicated mice in presence of CM obtained from GFP+ or GFP cells. n = 9 (+CM GFP+/GFP) and n = 6 (Ctrl medium). Results are representative of three independent experiments. g,h, Left, immunofluorescence staining of the indicated markers in tumors growing in DTR or Ctrl mice injected with DT. Right, quantification of expression, which was performed on n = 12(Ctrl)–11(DTR) in g and n = 9(Ctrl)–12(DTR) in h. Results are representative of three independent experiments.White arrowheads indicate F480+AXL-P+ macrophages (g) and cleaved-C3+ apoptotic cells (h). Scale bars, 50 μm. i, FACS plot and percentages of macrophages expressing MHCII and CD206 in tumors growing in DTR or Ctrl mice treated with DT (left). Ratio of MCHIIhiCD206lo (M1) over MCHIIloCD206hi (M2) macrophages (right). n = 12(Ctrl)–11(DTR) from 2 independent experiments. j, Expression of the indicated transcripts, measured by qRT–PCR, in macrophages isolated by FACS from tumors growing in mice treated as in i; Vegfa, n = 13(Ctrl)–12(DTR); Tgfb1, n = 13(Ctrl)–10(DTR); Light, n = 9(Ctrl)–10(DTR); Il10, n = 14(Ctrl)–13(DTR); Ptgs2, n = 11(Ctrl)–9(DTR). Results are representative of three independent experiments. k, Tumor growth curves of DTR and Ctrl mice treated with DT and activating anti-AXL antibodies or isotype control (IgG). Left, average tumor volume; right, growth curves for individual animals; n = 4, except for Ctrl + IgG (n = 6). The x axis represents days after tumor inoculation. l, Percentage of AXL-P+ macrophages in tumor sections from mice treated as in k. Quantifications were performed on n = 10 (Ctrl + IgG), n = 4 (Ctrl + α-AXL), n = 6 (DTR + IgG), n = 8 (DTR + α-AXL) fields. Statistics were calculated using one-way ANOVA (b), two-tailed, unpaired Student’s t-test (d,e,g,i,j), Mann–Whitney U test (h,j Ptgs2) or two-way ANOVA (f,k,l). All quantitative data are presented as means ± s.d. Source data
Fig. 5
Fig. 5. The tumor-induced ADAM12+ lineage is maintained in advanced tumor stages.
a, Immunofluorescence staining of ADAM12+ cells (GFP), co-stained with the indicated markers, in Rip-Tag2 (left) and TRAMP (right) tumors growing in ADAM12-GFP mice. Scale bars, 50 µm. b, Percentage of GFP+ cells among the indicated populations in TRAMP tumors (n = 3), RIPTag tumors (n = 4 for stroma, n = 3 for CD45+ and CD31+ cells), Ctrl prostate (n = 3) and Ctrl pancreas (n = 2), measured by FACS. Results are representative of two independent experiments. c, Strategy for inducible fate mapping of ADAM12+ cells. tTA, tetracycline transactivator; Dtr, diphteria toxin receptor; Ires, internal ribosomal entry site; Luc, luciferase; TRE, tet-responsive element; hCMV, human cytomegalovirus; Dox, doxycycline, LC-1, Luciferase_Cre transgenic mice. d, Experimental setup for lineage tracing of ADAM12+ cells induced de novo at early or late tumor stages in TRAMP or Rip-Tag2 mice. e, Immunofluorescence staining of YFP and the indicated markers, in Rip-Tag2 and TRAMP tumors growing in ADAM12-tTA-CreYFP mice. Scale bars, 50 μm. f, Percentage of YFP+ cells among total tumor stromal cells, measured by FACS, from mice treated as in d. n = 4 (RIP early), n = 6 (RIP late), n = 4 (TRAMP early), n = 2 (TRAMP late), n = 2 (Ctrl). g, Experimental setup for lineage tracing of ADAM12+ cells induced at early stages of tumorigenesis. h, Immunofluorescence staining of the indicated markers in TRAMP prostate tumors growing in ADAM12-tTA-CreYFP mice treated as in g. Scale bar, 100 µm. i, Immunofluorescence staining of the indicated markers in TRAMP tumors that metastasized in the liver (left and middle) or bone (right) in ADAM12-tTA-CreYFP mice. SV40 stains tumor cells. Scale bars, 50 µm. In a, e, h, and i, images are representative of independent experiments (n = 3–6). Quantitative data are presented as means ± s.d. Met, metastasis. DAPI stains nuclei. Source data
Fig. 6
Fig. 6. ADAM12 stratifies patients with high levels of hypoxia, inflammation and innate resistance mechanisms across tumor types.
a, GSEA of pathways in ADAM12hi versus ADAM12lo tumors (median expression) of human pancreatic ductal adenocarcinoma (ICGC_PAN_AU; yellow, n = 267), colon carcinoma (TCGA_COAD; green, n = 450), melanoma (TCGA_SKCM; navy, n = 147) and prostate adenocarcinoma (TCGA_PRAD; gray, n = 455) datasets. The bar plots represent the –log10(P value) and are colored according to the normalized enrichment score (NES) (red, positive; blue, negative; the value is shown at the end of each bar plot). be, Gene set enrichment analysis (GSEA) curves for the indicated pathways for the four tumor datasets analyzed as in a (right, red square indicates the leading-edge genes). For each pathway, to the left of the GSEA curves, the heat map shows the expression levels of the genes present in the leading edge and shared between the four datasets. All patients whose data have been analyzed are represented, and whether they have high (green) or low (red) ADAM12 expression is indicated above the heat map. A Wilcoxon rank-sum test was used for pre-rank GSEA for statistical analysis.
Extended Data Fig. 1
Extended Data Fig. 1. Depletion of ADAM12+ MSCs restores tumor immunity.
(a) Immunofluorescence staining of the indicated markers in MO5 tumors. Scale bar, 50 µm. (b) Immunofluorescence staining of PDPN and GFP in MO5 tumors growing in GFP+ mice, as in Fig. 1b. Scale bar, 100 µm. (c) Immunofluorescence staining of PDPN+ cells in normal skin. Scale bar, 100 µm. (d) Absolute numbers of GFP+ cells at the indicated days after tumor inoculation, as in Fig. 1c. (e) Expression of Adam12, measured by qRT-PCR, in the indicated populations isolated by FACS from MO5 tumors; n = 6 from 2 independent experiments. (f) FACS plot and percentages of GFP+ cells in the indicated populations from Fig. 1c. (g-i) Immunofluorescence staining of the indicated markers in MO5 tumors growing in GFP+ mice (g,h) or GFP littermates (i). White arrows indicate GFP+ cells; red arrows indicate pericytes; white arrowheads indicate the vBM. Scale bar, 10 µm. (j) Expression of human DTR (HBEGF) measured by qRT-PCR in the indicated conditions; n = 7, except for DTR(n = 9). (k) Expression of Adam12 detected by RNAscope in tumor sections from mice treated as in Fig. 1d; n = 6(DTR)-8(Ctrl) fields from 2 independent experiments. Scale bar, 50 µm. (l,m) Individual animal growth curves from Fig. 1d (l) and Fig. 1e (m). (n) Percentage of tumor infiltrating CD4+ T cells (n = 9 Ctrl, n = 8 DTR), neutrophils (n = 9 Ctrl, n = 8 DTR), eosinophils (n = 13 Ctrl, n = 11 DTR), DCs (n = 13 Ctrl, n = 11 DTR), M-MDSCs (n = 8 Ctrl, n = 6 DTR), G-MDSCs (n = 8 Ctrl, n = 6 DTR), macrophages (n = 13 Ctrl, n = 11 DTR), Tregs (n = 5 Ctrl, n = 7 DTR), measured by FACS. (o,p) Percentage of CD8+ T cells (n = 6 Ctrl, n = 4 DTR), IFNγ+ CD8+cells (n = 9 Ctrl, n = 7 DTR) (o) and the indicated fibroblastic populations (n = 4 Ctrl, n = 3 DTR) (p) in the tumor draining lymph node (LN), as measured by FACS. (q) Tumor growth curves from the indicated mice (n = 11, DTR + I gG; n = 9, DTR + anti-CD8), from 2 independent experiments. Left: average tumor volume and Right: individual animal growth curve. In l,m,q, the x axis represents days after tumor inoculation. In a-c,g-i one representative image of at least 3 independent experiments is shown. FRC: fibroblastic reticular cells; FDC: follicular dendritic cells; MRC: marginal reticular cells; TRC: T-zone FRCs. Statistics were calculated using two-tailed, unpaired Student’s t-test (e,n,o), Kruskal-Wallis test (j), two-tailed Mann-Withey test (k) or two-way ANOVA (q). All quantitative data are presented as mean values +/– SD. Source data
Extended Data Fig. 2
Extended Data Fig. 2. Immune and vascular remodeling of the TME.
(a) Percentage of CD3+ T cells in proximity to PDPN+ stromal cells in mice treated as in Fig. 2a. Measurements were assessed in 3 fields/tumor from independent experiments (n = 3). (b) Absolute numbers of PDPN+ PDGFRα+ cells (gated CD45CD31), measured by FACS, in MO5 tumors growing in mice treated as in Fig. 2a; n = 12(Ctrl)–14(DTR) from 3 independent experiments. (c) Percentage of the indicated immune populations, measured by FACS, infiltrating MO5 tumors in WT mice treated with U-104 inhibitor; from independent experiments (n = 5). (d) Hypoxic zones (identified by pimonidazole staining) in frozen sections of MO5 tumors treated as in c (n = 4); scale bar, 100 µm. (e) Immunofluorescence staining of NG2 and CD31 in frozen sections of MO5 tumors from mice treated as in Fig. 2i. Scale bar, 200 µm. T: tumor. In d,e, one representative image of independent experiments is shown. Statistics were calculated using two-tailed, unpaired Student’s t-test. Data are presented as mean values +/– SD. ns: not significant. Source data
Extended Data Fig. 3
Extended Data Fig. 3. Stromal remodeling of the TME.
(a) FACS gating strategy for S1, S2 and S3 stromal populations from MO5 tumors. (b) Normalized expression of the indicated genes in stromal populations from melanomas single cells RNAseq. (c) Expression of the indicated genes, measured by qRT-PCR, in S1, S2 and S3 isolated from MO5 tumors as shown in a (n = 3). (d) Percentage of the indicated stromal populations, measured by FACS, in MO5 tumors from ADAM12-DTR+ (DTR) and DTR littermates (Ctrl) treated with DT as in Fig. 2a (n = 4). (e) Normalized expression of Adam12 from single cells RNAseq of melanomas and normal skin. (f) FACS plot and percentages of GFP+ cells in the total stromal fraction from MO5 tumors. One representative experiment from independent experiments is shown (n = 7). (g) Expression of the indicated genes, measured by qRT-PCR, in stromal cells treated as indicated; n = 3. Gating strategy for stromal populations S1: PDGFRαHigh PDPNHigh CD34High DPP4High Ly6cHigh; S2: PDGFRα+ PDPN+ CD34Mid/Low DPP4Low/–; S3: PDGFRαLow PDPNLow CD34Low DPP4. Statistics were calculated using two-tailed, unpaired Student’s t-test (d,g). Data are presented as mean values +/– SD. Source data
Extended Data Fig. 4
Extended Data Fig. 4. Immune-stroma crosstalk and Tgfbr2 signaling in ADAM12+ cells.
(a) Violin plot of Lrrc15 from RNASeq data in Fig. 3a (n = 4). (b) Immunofluorescence staining of Ki67 and GFP in melanomas growing in ADAM12-GFP mice. Scale bar, 50 µm. (c) Expression of the indicated genes, measured by qRT-PCR, in the indicated populations isolated by FACS from MO5 tumors at day 12, n = 3 from independent experiments. Macrophages (M), tumor cells (MO5), endothelial cells (EC). (d) Expression of Adam12, measured by qRT-PCR, in ADAM12 PDGFRα+ cells isolated from MO5 tumors, treated as indicated (n = 3). (e) Expression of Gas6, measured by qRT-PCR, in stromal cells cultured in indicated conditions (n = 3). (f) Normalized expression of Tgfb1 in normal skin and melanomas (from single cells RNAseq dataset). (g) Expression of the indicated genes, measured by qRT-PCR, as in c. n = 3 except n = 6 (stroma). (h) Violin plots of Tgfbr1 and Tgfbr2 from RNASeq data in Fig. 3a (n = 4). (i) Expression of Tgfbr2, measured by qRT-PCR, in GFP+ and GFP stromal cells isolated by FACS from MO5 tumors (n = 4). (j) Strategy for inducible depletion of Tgfbr2 in ADAM12+ cells. (k) Experimental set up for l-p. (l) Tumor growth curves from ADAM12-tTA2-CreTgfbr2 mice (Tgfbr2fl, n = 8) and littermate mice (Ctrl, n = 6) treated as indicated in k. Left, average tumor volume, and right, individual animal growth curves, from 2 independent experiments. The x axis represents days after tumor inoculation. (m) Immunofluorescence staining of PDPN and CD3 in tumor sections in the indicated conditions. Right, quantification of tumor infiltrating T cells was performed on n = 6(Ctrl)–7(Tgfbr2fl) fields. Scale bars, 100 μm. (n) Expression of Vegfa, measured by qRT-PCR, in macrophages isolated from tumors. n = 7(Ctrl)–6(Tgfbr2fl) from 2 independent experiments. (o) Immunofluorescence staining of NG2 and CD31 in tumor sections from mice treated as in k; n = 7(Tgfbr2fl)–9(Ctrl) fields. Scale bars, 100 μm. (p) Expression of the indicated transcripts, measured by qRT-PCR, in tumor stromal cells isolated by FACS. n = 3 from independent experiments. In b,e, one representative experiment out of 3 is shown. Statistics were calculated using two-tailed, unpaired Student’s t-test (d,e,i,m-p) or two-way ANOVA (l). Data are presented as mean values +/– SD. Source data
Extended Data Fig. 5
Extended Data Fig. 5. ADAM12+ cells promote efferocytosis.
(a) Immunofluorescence staining of CD3+ T cells and ADAM12+ cells in MO5 tumors margin. Arrowheads indicate T cells infiltrated zones, and arrows indicate ADAM12+ cells. Scale bar, 100 µm. (b) Percentage of tumor stromal cells expressing ADAM12, DPP4 or αSMA in close proximity to AXL-P+ macrophages, as in Fig. 4b (n = 4, except for DPP4+ cells, n = 7), from 2 independent experiments. (c) Expression of Gas6, measured by qRT-PCR, in macrophages (M), T cells, tumor cells (MO5) and stromal cells isolated from MO5 tumors, n = 3. (d) Efferocytosis assay in BMDM, and macrophages or PDPN+PDGFRα+ stromal cells isolated from MO5 tumors (n = 3). AC= apoptotic cells (MO5). (e) Expression of the indicated genes, measured by qRT-PCR in BMDM following efferocytosis (n = 4). (f) Immunofluorescence staining of the indicated markers in MO5 tumors depleted from ADAM12+ cells. Scale bar, 50 µm. Arrowheads indicate cleaved caspase 3+ apoptotic cells. BV= blood vessels; SC= stromal cells. (g) Phagocytic capacity of macrophages isolated by FACS from MO5 tumors growing in ADAM12-DTR or Ctrl littermate mice + DT, as in Fig. 4g; n = 6(DTR)-7(Ctrl) from two independent experiments. (h) Expression of Gas6, measured by qRT-PCR in MO5 tumors growing in mice treated as in Fig. 4g; n = 10(DTR)-12(Ctrl) from 3 independent experiments. In a,f, one representative image from 3 independent experiments is shown. Statistics were calculated using one-way ANOVA (b) or two-tailed, unpaired Student’s t-test (e,g,h). All quantitative data are presented as mean values +/– SD. Source data
Extended Data Fig. 6
Extended Data Fig. 6. PDPN+ stroma and macrophages localization.
Immunofluorescence analysis of PDPN+ stromal cells (red) and F480+ macrophages (green) in frozen sections of tumors isolated from TRAMP mice (a) and RipTag2 mice (b). One representative image from 3 independent experiments is shown. Scale bar, 50 µm. DAPI stains nuclei.
Extended Data Fig. 7
Extended Data Fig. 7. The progeny of ADAM12+ cells in spontaneous tumor models.
(a) Immunofluorescence staining of GFP and the indicated markers in RipTag (n = 4) and TRAMP (n = 3) tumors. Right, absolute numbers of GFP+ cells measured by FACS. (b) Immunofluorescence staining of YFP and the indicated markers in MO5 tumors from ADAM12-tTA-CreYFP mice. Right, frequency and absolute numbers of YFP+ cells measured by FACS in normal skin (n = 2) and tumor (n = 4). (c) Expression of the indicated transcripts, measured by qRT-PCR, in GFP+ and YFP+ cells isolated from MO5 tumors growing in ADAM12-GFP mice or ADAM12-tTA-CreYFP mice, respectively; n = 4, except for Angpt2 and Acta2 YFP+ (n = 6) from independent experiments. (d) Immunofluorescence staining of YFP and the indicated markers in prostate and pancreatic tumors from the indicated mice. (e) Absolute numbers of YFP+ cells measured by FACS on independent mice, as indicated in Fig. 5g. (f) Immunofluorescence staining of fetal YFP+ cells in adult non-tumoral skin, prostate and pancreas. (g) Volume of pancreatic tumors in RIPTag/DTR or RIPTag2 littermate mice (Ctrl) treated with DT from weeks 11 to 14; n = 7(Ctrl)–11(DTR) from independent experiments. (h) Immunofluorescence staining of PDPN and CD3 in tumor sections from mice treated as in g. One representative image is shown of independent experiments (n = 4). (i) Absolute numbers of tumor infiltrating CD3+ T cells. Quantifications were performed on n = 10 images from 6 mice per group. (j) Percentage of PDPN+ PDGFRα+ cells, measured by FACS, in RIP-Tag2 tumors from mice treated as in g; n = 12(Ctrl)–15(DTR) from 6 independent experiments. (k) Distribution of PDPN+ cells within RIPTag tumors, in mice treated as in g; n = 9(Ctrl)-11(DTR) from 3 independent experiments. (l) Immunofluorescence staining of the indicated markers in tumor sections of mice treated as in g; quantification left, n = 13(Ctrl)–20(DTR) and right, n = 9(Ctrl)–8(DTR) fields. (m) Immunofluorescence staining of ICAM1, CD45 and CD31 in tumor sections of mice treated as in g; n = 11(Ctrl)-12(DTR) fields. (n) Tumor perfusion, as detected by Hoechst 33342 staining, in tumor sections from mice treated as in g; n = 9(DTR)-11(Ctrl) fields. In a,b,d,f, representative images of at least 3 independent experiments are shown. Statistics were calculated using two-tailed, unpaired Student’s t-test, except for c (Mann–Whitney test). All quantitative data are presented as mean values +/– SD. Scale bars, 50 μm, 100 µm (f,h), and 200 μm (n). Source data
Extended Data Fig. 8
Extended Data Fig. 8. Characterization of ADAM12+ cells in human tumors.
(a) Expression of ADAM12 transcript in single-cell RNAseq from human colorectal cancer patients (N = 62 patients, total 371,223 cells). Clustering = All cells (tSNE); On x axis, all cell subsets from the tumors are represented (88), and the major clusters expressing ADAM12 are highlighted (annotation from Pelka et al.; Pericyte_cS19, max: 3.314; q3: 1.08525, median: 0; CAF_cS28, max: 4.485, q3:1.50125, median: 0.558). (b) Expression of ADAM12 transcripts in single-cell RNAseq from melanoma patients (N = 31 melanoma tumors, total 39744 cells). Clustering = Non-malignant cells from melanoma tumors (CAF, max: 5.2823, q3: 3.0613, mean: 1.49153, median: 0). (c) Expression of ADAM12 transcripts in single-cell RNAseq from human PDAC (N = 24 primary untreated PDAC tumors, 41986 cells). Clustering= All cells (see Methods). (d) tSNE representation of ADAM12 expression in human PDAC as described in Peng et al. (top panel) and transcriptional signature of activated stromal PDAC subtype as described in Puleo et al. (lower panel). Two-sided Pearson’s Correlation Coefficient (R) was measured between ADAM12 expression and the activated stromal subtype signature (displayed in the tSNE panel). (e) Expression of the indicated transcripts in scRNAseq dataset from d. (f) Clinicopathologic characteristics of patients from the TCGA_PRAD project studied in Fig. 6. Patients (N = 455) were grouped according to their expression of ADAM12, as described in Methods. The associations were tested using two-sided Pearson chi2 test for categorical variables and the Mann–Whitney U test for continuous variables. Pathological classification: T – Extent of the primary tumor; N – Absence or presence and extent of regional lymph node metastases; M – Absence or presence of distant metastases. In a,b, data were visualized on the Single Cell portal of The Broad Institute of MIT and Harvard (https://singlecell.broadinstitute.org/single_cell).
Extended Data Fig. 9
Extended Data Fig. 9. Gating strategy for stromal cells.
Flow cytometry gating strategy for PDPN+PDGFRα+ stromal cells in early stage MO5 tumor.

References

    1. Schito L, Semenza GL. Hypoxia-inducible factors: master regulators of cancer progression. Trends Cancer. 2016;2:758–770. doi: 10.1016/j.trecan.2016.10.016. - DOI - PubMed
    1. Eltzschig HK, Carmeliet P. Hypoxia and inflammation. N. Engl. J. Med. 2011;364:656–665. doi: 10.1056/NEJMra0910283. - DOI - PMC - PubMed
    1. Taylor CT, Doherty G, Fallon PG, Cummins EP. Hypoxia-dependent regulation of inflammatory pathways in immune cells. J. Clin. Invest. 2016;126:3716–3724. doi: 10.1172/JCI84433. - DOI - PMC - PubMed
    1. Huber V, et al. Cancer acidity: an ultimate frontier of tumor immune escape and a novel target of immunomodulation. Semin. Cancer Biol. 2017;43:74–89. doi: 10.1016/j.semcancer.2017.03.001. - DOI - PubMed
    1. Prunier C, Baker D, Ten Dijke P, Ritsma L. TGF-β family signaling pathways in cellular dormancy. Trends Cancer. 2019;5:66–78. doi: 10.1016/j.trecan.2018.10.010. - DOI - PubMed

Substances