. 2023 Oct 5;21(1):696.
doi: 10.1186/s12967-023-04534-4.

Mitochondrial heteroplasmic shifts reveal a positive selection of breast cancer

Affiliations

Mitochondrial heteroplasmic shifts reveal a positive selection of breast cancer

Yanni Li et al. J Transl Med. .

Abstract

Background: Breast cancer is, despite screening, not always detected early enough and is together with other tumor types known to shed genetic information in circulation. Unlike single-copy nuclear DNA, mitochondrial DNA (mtDNA) copies range from 100s to 10,000s per cell, thus providing a potentially alternative to identify potential missing cancer information in circulation at an early stage.

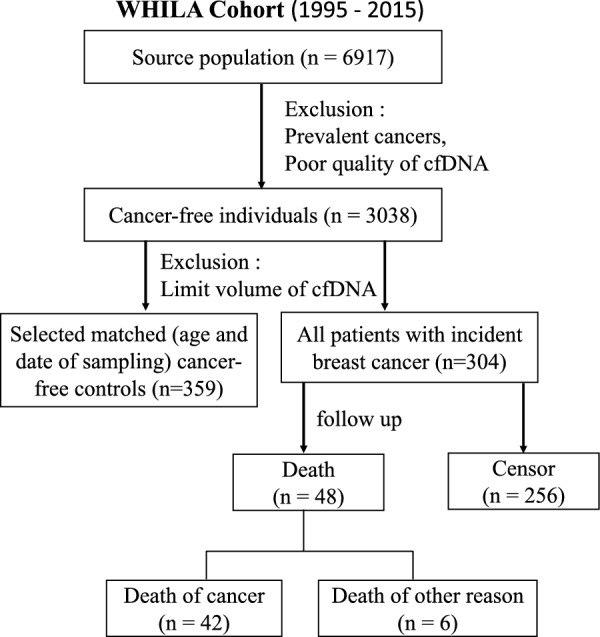
Methods: To characterize mitochondrial mutation landscapes in breast cancer, whole mtDNA sequencing and bioinformatics analyses were performed on 86 breast cancer biopsies and 50 available matched baseline cancer-free whole blood samples from the same individuals, selected from a cohort of middle-aged women in Sweden. To determine whether the mutations can be detected in blood plasma prior to cancer diagnosis, we further designed a nested case-control study (n = 663) and validated the shortlisted mutations using droplet digital PCR.

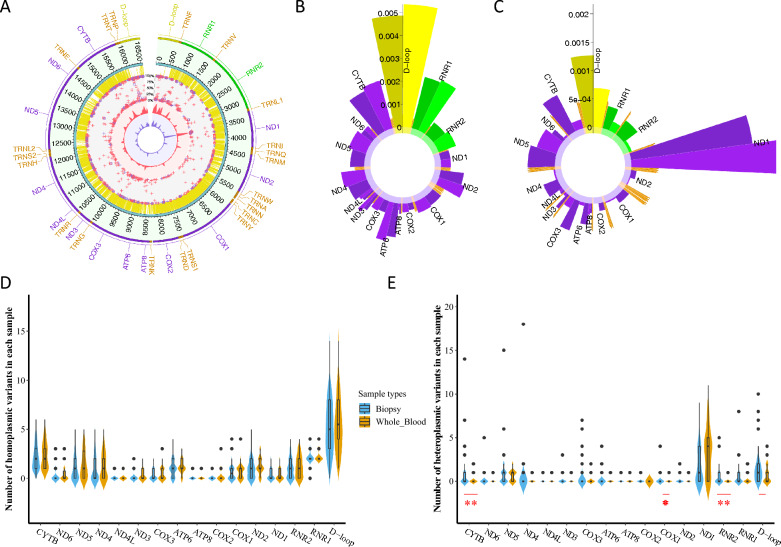
Results: We detected different mutation landscapes between biopsies and matched whole blood samples. Compared to whole blood samples, mtDNA from biopsies had higher heteroplasmic mutations in the D-loop region (P = 0.02), RNR2 (P = 0.005), COX1 (P = 0.037) and CYTB (P = 0.006). Furthermore, the germline mtDNA mutations had higher heteroplasmy level than the lost (P = 0.002) and de novo mutations (P = 0.04). The nonsynonymous to synonymous substitution ratio (dN/dS) was higher for the heteroplasmic mutations (P = 7.25 × 10⁻¹²) than that for the homoplasmic mutations, but the de novo (P = 0.06) and lost mutations (P = 0.03) had lower dN/dS than the germline mutations. Interestingly, we found that the critical regions for mitochondrial transcription: MT-HSP1 (odds ratio [OR]: 21.41), MT-TFH (OR: 7.70) and MT-TAS2 (OR: 3.62), had significantly higher heteroplasmic mutations than the rest of the D-loop sub-regions. Finally, we found that the presence of mt.16093T > C mutation increases 67% risk of developing breast cancer.

Conclusions: Our findings show that mitochondrial genetic landscape changes during cancer pathogenesis and positive selection of mtDNA heteroplasmic mutations in breast cancer. Most importantly, the mitochondrial mutations identified in biopsies can be traced back in matched plasma samples and could potentially be used as early breast cancer diagnostic biomarkers.

Keywords: Breast cancer; Heteroplasmic mutation; Sequencing; ddPCR validation; mtDNA.


Conflict of interest statement

The authors declare that there is no duality of interest associated with this manuscript.

Figures

Fig. 1
Fig. 1
Flow chart of participants in the nested case-control study
Fig. 2
Fig. 2
The distribution of mutations and assessment of the pathogenicity score in major haplogroups. Circos plot summarizing all of the mtDNA variants in biopsies. From outside of the circle to inside: (1) genes on the mitochondrial genome, colored by the genome region as yellow: D-loop; purple: coding genes; green: rRNAs; orange: tRNAs. (2) mtDNA position. (3) phastCons100 conservation scores from UCSC (range 0 to 1 from inner to outer ring, where score > 0.5 as conserved sites and < 0.5 as non-conserved sites). (4) heteroplasmy level (HL) of all mutations in H group. (5) HL of disease-causing mutations in H group. (6) HL of all mutations in HV group. (7) HL of disease-causing mutations in HV group. (8) HL of all mutations in U group. (9) HL of disease-causing mutations in U group. From (4– 9), HL from inner 0% to outer 100% (homoplasmic mutation), blue color: HL of all mutations, red color: HL of disease-causing mutations
Fig. 3
Fig. 3
The mtDNA mutation profiles of 86 biopsies and available matched 50 whole blood samples. A Circos plot of mitochondrial mutations identified in all biopsies and matched whole blood samples. From outside of the circle to inside: (1) genes on the mitochondrial genome, colored by the genome region as yellow: D-loop; purple: coding genes; green: rRNAs; orange: tRNAs. (2) mtDNA position. (3) phastCons100 conservation scores from UCSC. (4) identified mutations, the radial axis corresponds to the heteroplasmy level from inner 0% to outer 100%, the red cross indicates biopsies, while blues are whole blood samples. The mutations observed in both samples of the same individual are presented with squares. (5) The density of mutations. To make the two tracks comparable, the density was adjusted to reflect the difference in the number of mutations of the two groups. a Red: biopsies. b Blue: whole blood samples. B, C The mutation rate of mtDNA genomic regions. The vertical axes represent the number of refined homoplasmic (B) or heteroplasmic (C) mutations rate per base in each sample. The darker color is biopsies and the lighter color is the whole blood samples. Mitochondrial genes are displayed and colored by the regions as A. D, E Comparison of biopsies and whole blood samples regarding mutations in mitochondrial genes, respective P value obtained with Poisson regression. ** = P < 0.01, * = P < 0.05
Fig. 4
Fig. 4
Mitochondrial heteroplasmic shift reveals the positive selection of breast cancer. A, B Comparison of heteroplasmic (A) and homoplasmic (B) nucleotide mutational spectra in the mitochondrial genome from the matched 50 pair samples. Statistical significance for the difference (P) was calculated using Fisher’s exact test. C dN/dS for all types of muatations. P was calculated using Fisher’s exact test. D Left, difference in the percentage shift of heteroplasmy level (HL) between biopsy and the matched whole blood (HL Biopsy − HL whole blood) ordered by the degree of shift. Right, distribution of the difference of the percentage shift of HL between biopsy and the matched whole blood sample. E Number of heteroplasmies showing an increased or decreased HL in each mtDNA region in biopsy-whole blood pairs. P was calculated using the binomial test and Bonferroni correction. P in Fig. 4 was marked with asterisks: *** = P < 0.001, ** = P < 0.01, * = P < 0.05
Fig. 5
Fig. 5
The distribution of mitochondrial heteroplasmic mutations in D-loop. A phastCons100 conservation scores across the mtDNA D-loop region (where score > 0.5 as conserved sites and < 0.5 as non-conserved sites). B heteroplasmic mutations in the D-loop region. Corresponding known 17 sub-regions of the mtDNA D-loop are shown at the bottom

References

    1. Sung H, Ferlay J, Siegel RL, Laversanne M, Soerjomataram I, Jemal A, et al. Global cancer statistics 2020: GLOBOCAN estimates of incidence and mortality worldwide for 36 cancers in 185 countries. CA Cancer J Clin. 2021;71(3):209–249. doi: 10.3322/caac.21660. - DOI - PubMed
    1. Britt KL, Cuzick J, Phillips KA. Key steps for effective breast cancer prevention. Nat Rev Cancer. 2020;20(8):417–436. - PubMed
    1. Harbeck N, Penault-Llorca F, Cortes J, Gnant M, Houssami N, Poortmans P, et al. Breast cancer. Nat Rev Dis Primers. 2019;5(1):66. - PubMed
    1. Loibl S, Poortmans P, Morrow M, Denkert C, Curigliano G. Breast cancer. Lancet. 2021;397(10286):1750–1769. - PubMed
    1. Fowler AM, Strigel RM. Clinical advances in PET-MRI for breast cancer. Lancet Oncol. 2022;23(1):e32–e43. - PMC - PubMed

Publication types

Substances