. 2024 Apr;18(4):895-917.
doi: 10.1002/1878-0261.13534. Epub 2023 Oct 20.

Expanding a precision medicine platform for malignant peripheral nerve sheath tumors: New patient-derived orthotopic xenografts, cell lines and tumor entities

Affiliations

Expanding a precision medicine platform for malignant peripheral nerve sheath tumors: New patient-derived orthotopic xenografts, cell lines and tumor entities

Edgar Creus-Bachiller et al. Mol Oncol. 2024 Apr.

Abstract

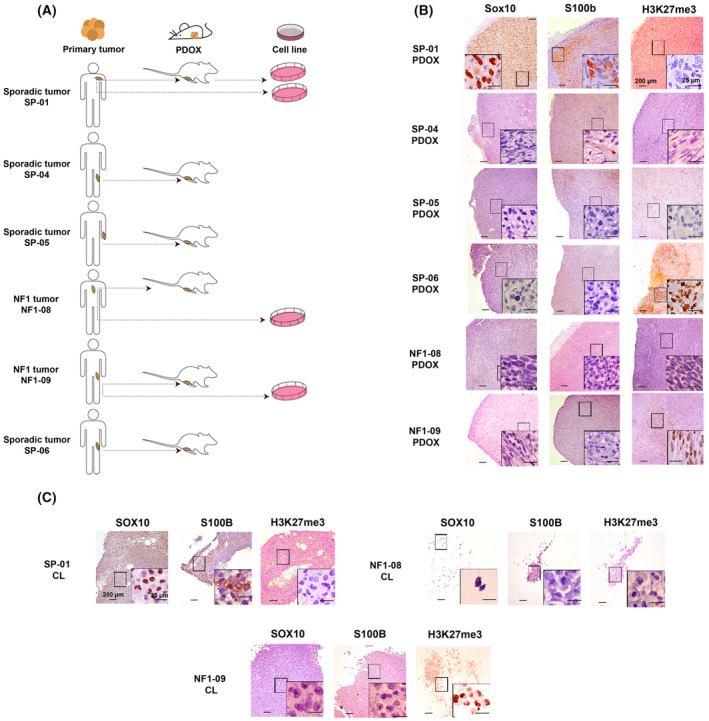
Malignant peripheral nerve sheath tumors (MPNSTs) are aggressive soft-tissue sarcomas with a poor survival rate, presenting either sporadically or in the context of neurofibromatosis type 1 (NF1). The histological diagnosis of MPNSTs can be challenging, with different tumors exhibiting great histological and marker expression overlap. This heterogeneity could be partly responsible for the observed disparity in treatment response due to the inherent diversity of the preclinical models used. For several years, our group has been generating a large patient-derived orthotopic xenograft (PDOX) MPNST platform for identifying new precision medicine treatments. Herein, we describe the expansion of this platform using six primary tumors clinically diagnosed as MPNSTs, from which we obtained six additional PDOX mouse models and three cell lines, thus generating three pairs of in vitro-in vivo models. We extensively characterized these tumors and derived preclinical models, including genomic, epigenomic, and histological analyses. Tumors were reclassified after these analyses: three remained as MPNSTs (two being classic MPNSTs), one was a melanoma, another was a neurotrophic tyrosine receptor kinase (NTRK)-rearranged spindle cell neoplasm, and, finally, the last was an unclassifiable tumor bearing neurofibromin-2 (NF2) inactivation, a neuroblastoma RAS viral oncogene homolog (NRAS) oncogenic mutation, and a SWI/SNF-related matrix-associated actin-dependent regulator of chromatin (SMARCA4) heterozygous truncated variant. New cell lines and PDOXs faithfully recapitulated histology, marker expression, and genomic characteristics of the primary tumors. The diversity in tumor identity and their specific associated genomic alterations impacted treatment responses obtained when we used the new cell lines for testing compounds against known altered pathways in MPNSTs. In summary, we present here an extension of our MPNST precision medicine platform, with new PDOXs and cell lines, including tumor entities confounded as MPNSTs in a real clinical scenario. This platform may constitute a useful tool for obtaining correct preclinical information to guide MPNST clinical trials.

Keywords: MPNST; NF1; PDOX; cellular models; treatment response; tumor entities.


Conflict of interest statement

The authors declare no conflict of interest.

Figures

Fig. 1
Fig. 1
Genomic, epigenomic, and histological characterization of primary tumors and diagnostic validation. (A) Genetic status of the most recurrent inactivated TSGs in MPNSTs using WGS and genes related to other tumor entities. A gray square represents a WT gene; a blue line indicates the presence of LOH; a black dot represents a single nucleotide variant (SNV) affecting the gene; an orange dot represents an activating SNV in the gene; a black triangle indicates a SV; a red square is for CN gain; a light green square is for heterozygous CN loss (Het loss) of the gene, and dark green is for homozygous CN loss (Hom loss); the complete biallelic inactivation of a gene is represented by a black cross. SP‐06 tumor TSGs status was obtained using WES and SNP array. (B) Number of somatic SNVs and contribution of COSMIC mutational signatures in primary MPNSTs. SP‐06 was not included as WGS was not performed on this tumor (n = 1). (C) UMAP plot representing methylome classification of multiple sarcomas. Each dot represents a tumor sample and each color a different sarcoma type [52]. (D) Inset amplification of the UMAP plot, showing the classification of the methylome profile of three cell lines derived from our primary tumors (SP‐01, NF1‐08, and NF1‐09) and three other established control cell lines (S462, ST88‐14, and STS‐26T). The MPNST group is represented in blue, the MPNST‐like group in black, and melanomas in green. Each cell line is represented by a unique color. CL: cell line. (E) Representative immunostaining of SOX10, S100B, and H3K27me3 in the patient's primary tumors (n = 1). PT: Primary tumor. Original magnifications are 40× and 600× in the inset magnified view, and scale bars are 200 μm and 25 μm, respectively.
Fig. 2
Fig. 2
Characterization of new PDOX and cell line models. (A) Scheme of the in vitro/in vivo models generated from the patient's tumors. Two cell lines were generated from the same patient, one from the primary tumor and the second from the PDOX tumor. (B) Representative histological stains of Sox10, S100b, and H3K27me3 in the six PDOX tumors (n = 1). Original magnifications are 40× and 600× in the inset magnified view, and scale bars are 200 μm and 25 μm, respectively. (C) Representative histological stains of SOX10, S100B, and H3K27me3 in the three cell lines derived from primary tumors (n = 1). CL: cell line. Magnifications are 40× and 600× in the inset magnified view, and scale bars are 200 μm and 25 μm, respectively.
Fig. 3
Fig. 3
Patient‐derived orthotopic xenografts and cell lines recapitulate the main genetic and genomic features of primary tumors. (A) CN profile of primary tumor, orthoxenograft (PDOX) tumor, and cell line from patient NF1‐08, representing that the models recapitulate the genomic hallmarks of the primary tumor. BAF and LRR profiles are represented. CN variations are represented by a colored line under each LRR: gray for 2n region; yellow to red for >2n, representing chromosomal gain; and green for <2n, representing chromosomal loss. LOH events are shown in blue. Genomic differences between primary and xenograft tumors are highlighted in purple, and differences between cell lines at low and high passage are marked in a cream color. (B) Number of somatic SNVs in the coding regions of primary tumors and models calculated using WES. The blood of patients was used as a control of constitutive DNA. New somatic SNVs were calculated in PDOX tumors and cell lines compared with primary tumors. The number of SNVs of primary tumor SP‐06 was not analyzed due to the lack of blood sample from the patient. OT: PDOX tumor.
Fig. 4
Fig. 4
Phenotypic and functional characterization of new established cell lines. (A) Representative morphology images of the newly generated cell lines at low and high confluence (n = 1). Images were taken by optical microscope at 100× magnification. The scale bar is 100 μm. (B) Representative immunofluorescence images of MPNSTs markers SOX9 and EGFR, and neural crest‐Schwann cell lineage markers p75 and S100B (n = 1). Original magnification of images is 200×, and the scale bar is 100 μm. (C) DNA content analyses of the three cell lines (using fibroblasts derived from a NF1 patient as a diploid control), represented as the number of cells versus DNA quantity (n = 2). (D) Cell growth curves of the three newly generated cell lines and three control tumor cell lines (S462, ST88‐14, and STS‐26T), obtained using MTT viability assay. Growth curves are derived from mean values ± SD (error bars, n = 6). PDT values and TP53 status correlate with the tumorigenic capacity of the cell lines. In red, cell lines that generate tumors in mice, with low PDT values and TP53 inactivated. In green, cell lines that do not generate tumors, with high PDT values and active TP53. (E) Colony formation ability of cell lines. Representative images of 2D and 3D colonies generated by the new established cell line NF1‐09 and control MPNST cell line S462; both generate tumors in mice (n = 2). Original magnification of images is 400×. The scale bar is 50 μm. (F) Wound healing assay of the three cell lines. Representative images of wound closing were captured at 0, 12, and 24 h (left) at 100× magnification. The migration ability of cells was represented as the percentage of open wound at 0, 4, 8, 12, and 24 h (right). Open wound curves are derived from mean values ± SD (error bars, n = 3). In red, cell lines that generate tumors in mice and, in green, cell lines that do not generate tumors. The scale bar is 100 μm.
Fig. 5
Fig. 5
Genuine and confounded MPNST cell lines exhibit different treatment responses. (A) Cell viability plots of cell lines treated singly with MEK inhibitor (MEKi) Mirdametinib, Aurora A kinase inhibitor (AURKAi) Alisertib, and BET inhibitor (BETi) JQ1, and IC50 values of the compounds for each cell line. Cell viability curves are derived from mean values ± SD (error bars, n = 3). In green, cell lines S462 and NF1‐08 are classic MPNSTs; in khaki green, the NF1‐09 cell line is an MPNST with active PRC2; and in red, the SP‐01 cell line is derived from a melanoma. (B) Cell viability plots of NF1‐08 and S462 cell lines treated with pairwise combinations of the three compounds, alongside CI values to evaluate the synergy of the combinations. Cell viability curves are derived from mean values ± SD (error bars, n = 3). Synergy is observed at CIs <1. Single treatments are marked in blue and red, and combination in green in the cell viability plot.

Similar articles

Cited by

References

    1. Grobmyer SR, Reith JD, Shahlaee A, Bush CH, Hochwald SN. Malignant peripheral nerve sheath tumor: molecular pathogenesis and current management considerations. J Surg Oncol. 2008;97(4):340–349. 10.1002/jso.20971 - DOI - PubMed
    1. Kallionpää RA, Uusitalo E, Leppävirta J, Pöyhönen M, Peltonen S, Peltonen J. Prevalence of neurofibromatosis type 1 in the Finnish population. Genet Med. 2018;20(9):1082–1086. 10.1038/gim.2017.215 - DOI - PubMed
    1. Kresak JL, Walsh M. Neurofibromatosis: a review of NF1, NF2, and schwannomatosis. J Pediatr Genet. 2016;5(2):98–104. 10.1055/s-0036-1579766 - DOI - PMC - PubMed
    1. Evans DG, Baser ME, McGaughran J, Sharif S, Howard E, Moran A. Malignant peripheral nerve sheath tumours in neurofibromatosis 1. J Med Genet. 2002;39(5):311–314. - PMC - PubMed
    1. Uusitalo E, Rantanen M, Kallionpää RA, Pöyhönen M, Leppävirta J, Ylä‐Outinen H, et al. Distinctive cancer associations in patients with neurofibromatosis type 1. J Clin Oncol. 2016;34(17):1978–1986. 10.1200/JCO.2015.65.3576 - DOI - PubMed