. 2023 Jan-Dec:32:9636897231204075.
doi: 10.1177/09636897231204075.

Induced Overexpression of B Cell-Activating Factor by Triiodothyronine Results in Abnormal B Cell Differentiation in Mice

Affiliations

Induced Overexpression of B Cell-Activating Factor by Triiodothyronine Results in Abnormal B Cell Differentiation in Mice

Shu Liu et al. Cell Transplant. 2023 Jan-Dec.

Abstract

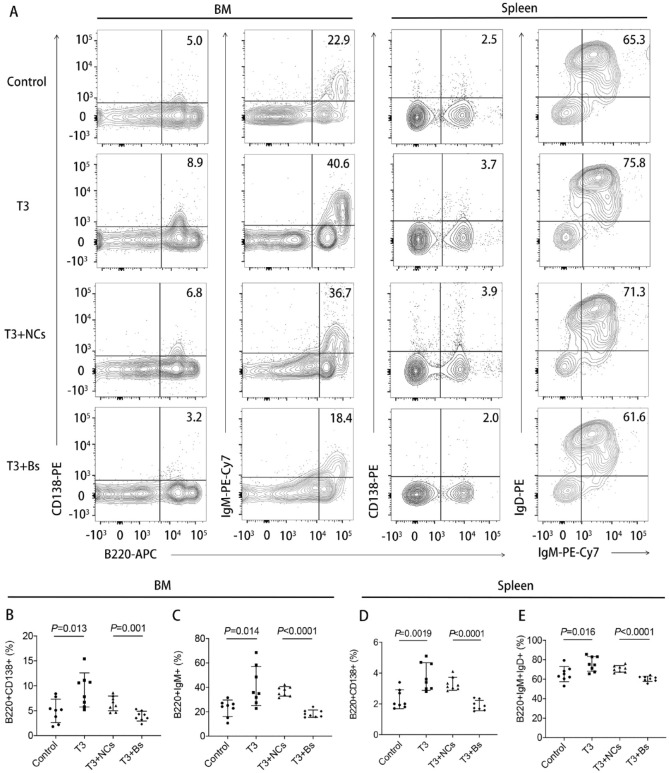
Breakdown of tolerance and abnormal activation in B cells is an important mechanism in the pathogenesis of Graves' disease (GD) and high levels of thyroid hormones (THs) can drive the progression of GD. However, the interactions between THs and abnormal activation of B cells in the context of GD are not well understood. The aim of this study was to investigate B cell-activating factor (BAFF) mediating the cross talk between THs and B cells and the possible underlying mechanisms. A high-level triiodothyronine (T3) mouse model was used to verify T3-mediated induction of overexpression of BAFF and B cell abnormal differentiation. The possible promotion of BAFF overexpression in the mice spleen macrophages during polarization to M1 by T3 was also studied. We showed that high levels of T3 can induce BAFF overexpression and lead to abnormal differentiation of B cells in the mice. While the overexpression of BAFF was observed across many tissue types in the mice, high levels of T3 could induce M1 macrophages polarization by IFN (interferon-gamma)-γ in the spleen of the mice, which in turn generated BAFF overexpression. Our findings provide a novel insight into the interactions between the endocrine and immune systems, as well as provide insight into the role of TH in the pathogenesis of GD.

Keywords: B cell-activating factor (BAFF); B cells; Graves’ disease; macrophages; thyroid hormone.


Conflict of interest statement

Declaration of Conflicting InterestsThe author(s) declared no potential conflicts of interest with respect to the research, authorship, and/or publication of this article.

Figures

Figure 1.
Figure 1.
BAFF overexpression induced by TH and the results of inhibiting BAFF expression by shRNA in mice. (A) Schematic representation of the experimental protocol. The mice were divided into six groups: Control, T3, T3+negative control shRNA (T3 + NCs), T3+BAFF shRNA (T3 + Bs), T3+negative clodronate liposome control (PBS; T3 + NCCls), and T3+clodronate liposome (T3 + CLs) groups. The mouse of T3 group was treated with 5 μg/10 g T3 for 6 weeks. The mice of T3 + Bs and T3 + NCs groups were treated with shRNA and negative control shRNA for 4 weeks before 6 weeks of T3 treatment. (B to D) Representative of the changes of body weight (B), food consumption (C), and water consumption (D) in mice of Control, T3, T3 + NCs and T3 + Bs groups during the 6 weeks. (E to H) Represents the changes of serum T3 level (E), serum BAFF level (F), BAFF mRNA expression in BM (G), and BAFF mRNA expression in spleen (H) for the four groups (n = 8 biological replicates for each group of the mice). (I) Represents the changes of BAFF protein expression in mice spleen of the four groups. Data are presented as mean ± SD. Statistical significance is assessed by two-tailed unpaired t test. (J) The spleen pathological sections stained with hematoxylin and eosin (top panels) and immunohistochemically stained with anti-BAFF antibody (lower panels) for the four groups. (K) Represents the fraction of BAFF positive cells in the four groups. The cytoplasm of BAFF-positive cells was visualized as a brownish yellow stain using a pathological image analysis system. Five visual fields were randomly selected from each section. Integral absorbance was calculated as positive BAFF expression (n = 5 biological replicates). Mean density was calculated by mean IOD/mean area. Scale bar = 100 um. Data are presented as mean ± SD. Statistical significance is assessed by two-tailed unpaired t test. BAFF: B cell-activating factor; TH: thyroid hormone; CL: clodronate liposome; BM: bone marrow; PBS: phosphate-buffered saline; Bs: BAFF shRNA; IOD: Integrated optical density.
Figure 2.
Figure 2.
B cells differentiation in BM and spleen of the mice after T3 treatment. (A) Represents expressions of CD138 and IgM on B220+ B cells in BM, CD138, IgM and IgD on B220+ B cells in spleen of the control, T3, T3 + NCs, and T3 + Bs groups. (B to E) Represents the average fraction of B220+ B cells positive for the CD138 and IgM in BM (B and C), and CD138, IgM, and IgD in spleen (D and E) of the four groups. Data are presented as mean ± SD (n = 8 independent biological experiments). Statistical significance is assessed by two-sided independent t test. BM: bone marrow; NC: negative control; PE: P-phycoeythrin; IgM: immunoglobulin G; IgD: Immunoglobulin D.
Figure 3.
Figure 3.
BAFF expression in some tissues and spleen macrophages after T3 stimulation. (A) Represents BAFF protein expressions in various tissues of the mice treated with T3 for 6 weeks. The average BAFF protein expressions in various tissues are shown at the bottom panel. Data are presented as mean ± SD and P value between T3 and control groups is calculated by two-sided independent t test (n = 8 independent biological experiments). (B and C) Represents BAFF mRNA expression in PBMCs (B) and spleen MCs (C) of the normal mice after various concentrations of T3 stimulation. Data are presented as mean ± SD and P value between 0 and various concentrations of T3 was calculated by two-sided independent t test (n = 8 independent biological experiments). (D to G) Represents BAFF mRNA expression of spleen parenchyma cells (D), CD4+ T cells (E), CD11c+ DC cells (F) and macrophages (G) in the mice treated with T3 for 6 weeks and control. Data are presented as mean ± SD and P value between control and T3 groups is calculated by two-sided independent t test (n = 8 independent biological experiments). (H) Represents expressions of CD86 and CD206 on spleen F4/80+ CD11b+ macrophages in the mice spleen after 6 weeks T3 treatment. The average fraction of spleen F4/80 CD11b macrophages positive for CD86 and CD206 are shown at the right panel. Data are presented as mean ± SD and P value is assessed by two-sided independent t test. (n = 8 independent biological experiments). (I and J) Represents mRNA expression of IFN-γR1 (I) and IL-4 (J) in MΦ macrophages. (K and L) Represents mRNA expression BAFF mRNA expression in M1 macrophages (K) and M2 macrophages (L). Data are presented as mean ± SD and P value is assessed by two-sided independent t test (n = 8 independent biological experiments). BAFF: B cell-activating factor; PBMC: peripheral blood mononuclear cell; MC: mononuclear cell; DC: dendritic cell; PE: P-phycoeythrin.
Figure 4.
Figure 4.
Polarization of spleen MΦ macrophages to M1 macrophages by TH stimulation and effects of eliminating macrophages BAFF expression. (A) Represents spleen weight changes among the control, T3, T3 + NCCLs, and T3 + CLs groups of mice. The T3 + NCCLs and T3 + CLs groups were intravenously injected PBS or CLs through tail veins, respectively. Two days later, the mice were injected subcutaneously with T3 (5 μg/10 g) every day for 6 weeks; meanwhile, the mice were intravenously injected PBS or CLs through tail veins once a week. The spleen volumes in the three groups are showed in the left panel and the average spleen weights of the three groups of mice are shown in the right panel. Data are presented as mean ± SD and P value is assessed by two-sided independent t test (n = 8 independent biological experiments). (B to D) Represents the difference of serum T3 (B) and serum BAFF levels (C), and BAFF mRNA expression (D) in PBMC between the T3 + NCCLs and T3 + CLs groups. Data are presented as mean ± SD and P value is assessed by two-sided independent t test (n = 8 independent biological experiments). (E and F) Represents the difference of BAFF (E), IFN-γR1, and IL-4 (F) protein expression between the T3 + NCCLs and T3 + CLs groups. Data are presented as mean ± SD and P value is assessed by two-sided independent t test (n = 8 independent biological experiments). (G) Represents the fraction of BAFF positive cells in T3 + NCCLs and T3 + CLs groups. The cytoplasm of BAFF-positive cells was visualized as a brownish yellow stain using a pathological image analysis system. Five visual fields were randomly selected from each section. Integral absorbance was calculated as positive BAFF expression (n = 5 biological replicates). Mean density was calculated by mean IOD/mean area. Scale bar = 100 um. Data presented are mean ± SD. Statistical significance is assessed by two-tailed unpaired t test. (H) Comparison of co-immunostaining for anti-BAFF (green, white arrows), anti-CD86 (red), anti-CD206 (pink), and DAPI (blue) in spleen between the T3 + CLs and T3 + NCCLs groups. TH: thyroid hormone; BAFF: B cell-activating factor; NCCLs: negative control liposomes; CL: clodronate liposome; PBMC: peripheral blood mononuclear cell; DAPI: 4l,6-diamidino-2-phenylindole; IL: interleukin; IOD: Integrated optical density.

Similar articles

Cited by

References

    1. Davies TF, Andersen S, Latif R, Nagayama Y, Barbesino G, Brito M, Eckstein AK, Stagnaro-Green A, Kahaly GJ. Graves’ disease. Nat Rev Dis Primers. 2020;66(1):1–23. - PubMed
    1. Thien M, Phan TG, Gardam S, Amesbury M, Basten A, Mackay F, Brink R. Excess BAFF rescues self-reactive B cells from peripheral deletion and allows them to enter forbidden follicular and marginal zone niches. Immunity. 2004;20(6):785–98. - PubMed
    1. Smulski CR, Eibel H. BAFF and BAFF-receptor in B cell selection and survival. Front Immunol. 2018;9:2285. - PMC - PubMed
    1. Mackay F, Schneider P. Cracking the BAFF code. Nat Rev Immunol. 2009;9(7):491–502. - PubMed
    1. Mackay F, Silveira PA, Brink R. B cells and the BAFF/APRIL axis: fast-forward on autoimmunity and signaling. Curr Opin Immunol. 2007;19(3):327–36. - PubMed

Publication types

LinkOut - more resources