2D sodium MRI of the human calf using half-sinc excitation pulses and compressed sensing
- PMID: 37799019
- PMCID: PMC10962573
- DOI: 10.1002/mrm.29841
2D sodium MRI of the human calf using half-sinc excitation pulses and compressed sensing
Abstract
Purpose: Sodium MRI can be used to quantify tissue sodium concentration (TSC) in vivo; however, UTE sequences are required to capture the rapidly decaying signal. 2D MRI enables high in-plane resolution but typically has long TEs. Half-sinc excitation may enable UTE; however, twice as many readouts are necessary. Scan time can be minimized by reducing the number of signal averages (NSAs), but at a cost to SNR. We propose using compressed sensing (CS) to accelerate 2D half-sinc acquisitions while maintaining SNR and TSC.
Methods: Ex vivo and in vivo TSC were compared between 2D spiral sequences with full-sinc (TE = 0.73 ms, scan time ≈ 5 min) and half-sinc excitation (TE = 0.23 ms, scan time ≈ 10 min), with 150 NSAs. Ex vivo, these were compared to a reference 3D sequence (TE = 0.22 ms, scan time ≈ 24 min). To investigate shortening 2D scan times, half-sinc data was retrospectively reconstructed with fewer NSAs, comparing a nonuniform fast Fourier transform to CS. Resultant TSC and image quality were compared to reference 150 NSAs nonuniform fast Fourier transform images.
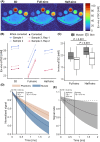
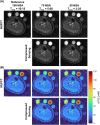
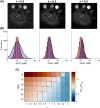
Results: TSC was significantly higher from half-sinc than from full-sinc acquisitions, ex vivo and in vivo. Ex vivo, half-sinc data more closely matched the reference 3D sequence, indicating improved accuracy. In silico modeling confirmed this was due to shorter TEs minimizing bias caused by relaxation differences between phantoms and tissue. CS was successfully applied to in vivo, half-sinc data, maintaining TSC and image quality (estimated SNR, edge sharpness, and qualitative metrics) with ≥50 NSAs.
Conclusion: 2D sodium MRI with half-sinc excitation and CS was validated, enabling TSC quantification with 2.25 × 2.25 mm2 resolution and scan times of ≤5 mins.
Keywords: 23Na MRI; UTE; compressed sensing; half-sinc; sodium.
© 2023 The Authors. Magnetic Resonance in Medicine published by Wiley Periodicals LLC on behalf of International Society for Magnetic Resonance in Medicine.
Conflict of interest statement
Figures


Similar articles
-
Rapid 2D 23Na MRI of the calf using a denoising convolutional neural network.Magn Reson Imaging. 2024 Jul;110:184-194. doi: 10.1016/j.mri.2024.04.027. Epub 2024 Apr 19. Magn Reson Imaging. 2024. PMID: 38642779
-
Towards accelerated quantitative sodium MRI at 7 T in the skeletal muscle: Comparison of anisotropic acquisition- and compressed sensing techniques.Magn Reson Imaging. 2021 Jan;75:72-88. doi: 10.1016/j.mri.2020.09.019. Epub 2020 Sep 24. Magn Reson Imaging. 2021. PMID: 32979516
-
2D radially compensating excitation pulse in combination with an internal transceiver antenna for 3D MRI of the rectum at 7 T.Med Phys. 2016 Jul;43(7):4375. doi: 10.1118/1.4954204. Med Phys. 2016. PMID: 27370152
-
Accelerated multiple-quantum-filtered sodium magnetic resonance imaging using compressed sensing at 7 T.Magn Reson Imaging. 2024 Apr;107:138-148. doi: 10.1016/j.mri.2023.12.011. Epub 2024 Jan 1. Magn Reson Imaging. 2024. PMID: 38171423
-
Two-dimensional UTE overview imaging for dental application.Magn Reson Med. 2020 Nov;84(5):2616-2624. doi: 10.1002/mrm.28312. Epub 2020 May 10. Magn Reson Med. 2020. PMID: 32390153 Review.
Cited by
-
Polyacrylamide Gel Calibration Phantoms for Quantification in Sodium MRI.NMR Biomed. 2025 Jun;38(6):e70056. doi: 10.1002/nbm.70056. NMR Biomed. 2025. PMID: 40329665 Free PMC article.
References
-
- Friedrich A, Linz P, Nagel AM, et al. Hemodialysis patients with cardiovascular disease reveal increased tissue Na+ deposition. Kidney Blood Press Res. 2022;47:185‐193. - PubMed
-
- Kopp C, Linz P, Dahlmann A, et al. 23Na magnetic resonance imaging‐determined tissue sodium in healthy subjects and hypertensive patients. Hypertension. 2013;61:635‐640. - PubMed
-
- Gerhalter T, Gast LV, Marty B, et al. 23Na MRI depicts early changes in ion homeostasis in skeletal muscle tissue of patients with Duchenne muscular dystrophy. J Magn Reson Imaging. 2019;50:1103‐1113. - PubMed
Publication types
MeSH terms
Substances
Grants and funding
LinkOut - more resources
Full Text Sources
Medical

