. 2023:1:1234578.
doi: 10.3389/flupu.2023.1234578. Epub 2023 Oct 3.

Modeling of horizontal pleiotropy identifies possible causal gene expression in systemic lupus erythematosus

Affiliations

Modeling of horizontal pleiotropy identifies possible causal gene expression in systemic lupus erythematosus

Iouri Chepelev et al. Front Lupus. 2023.

Abstract

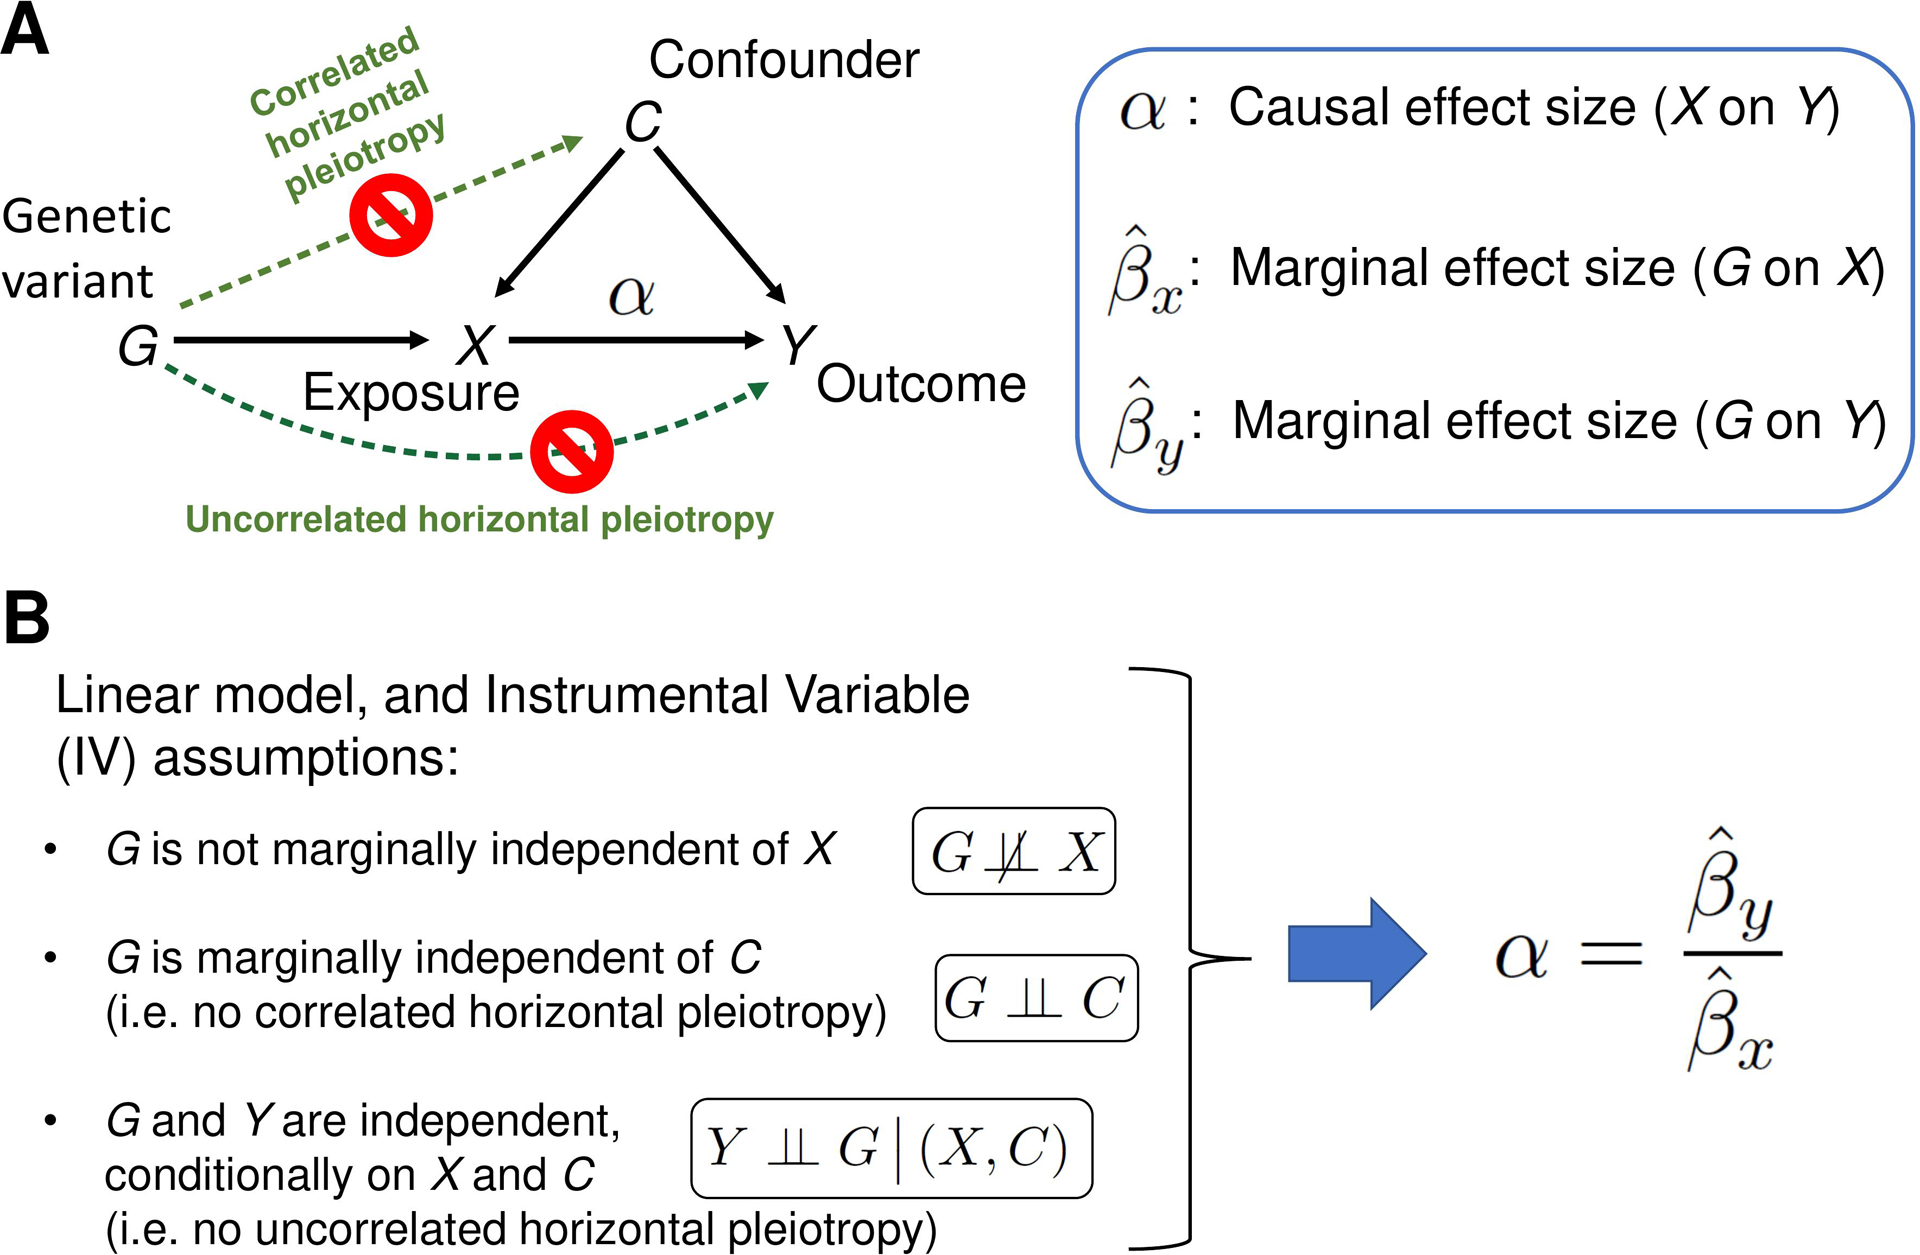
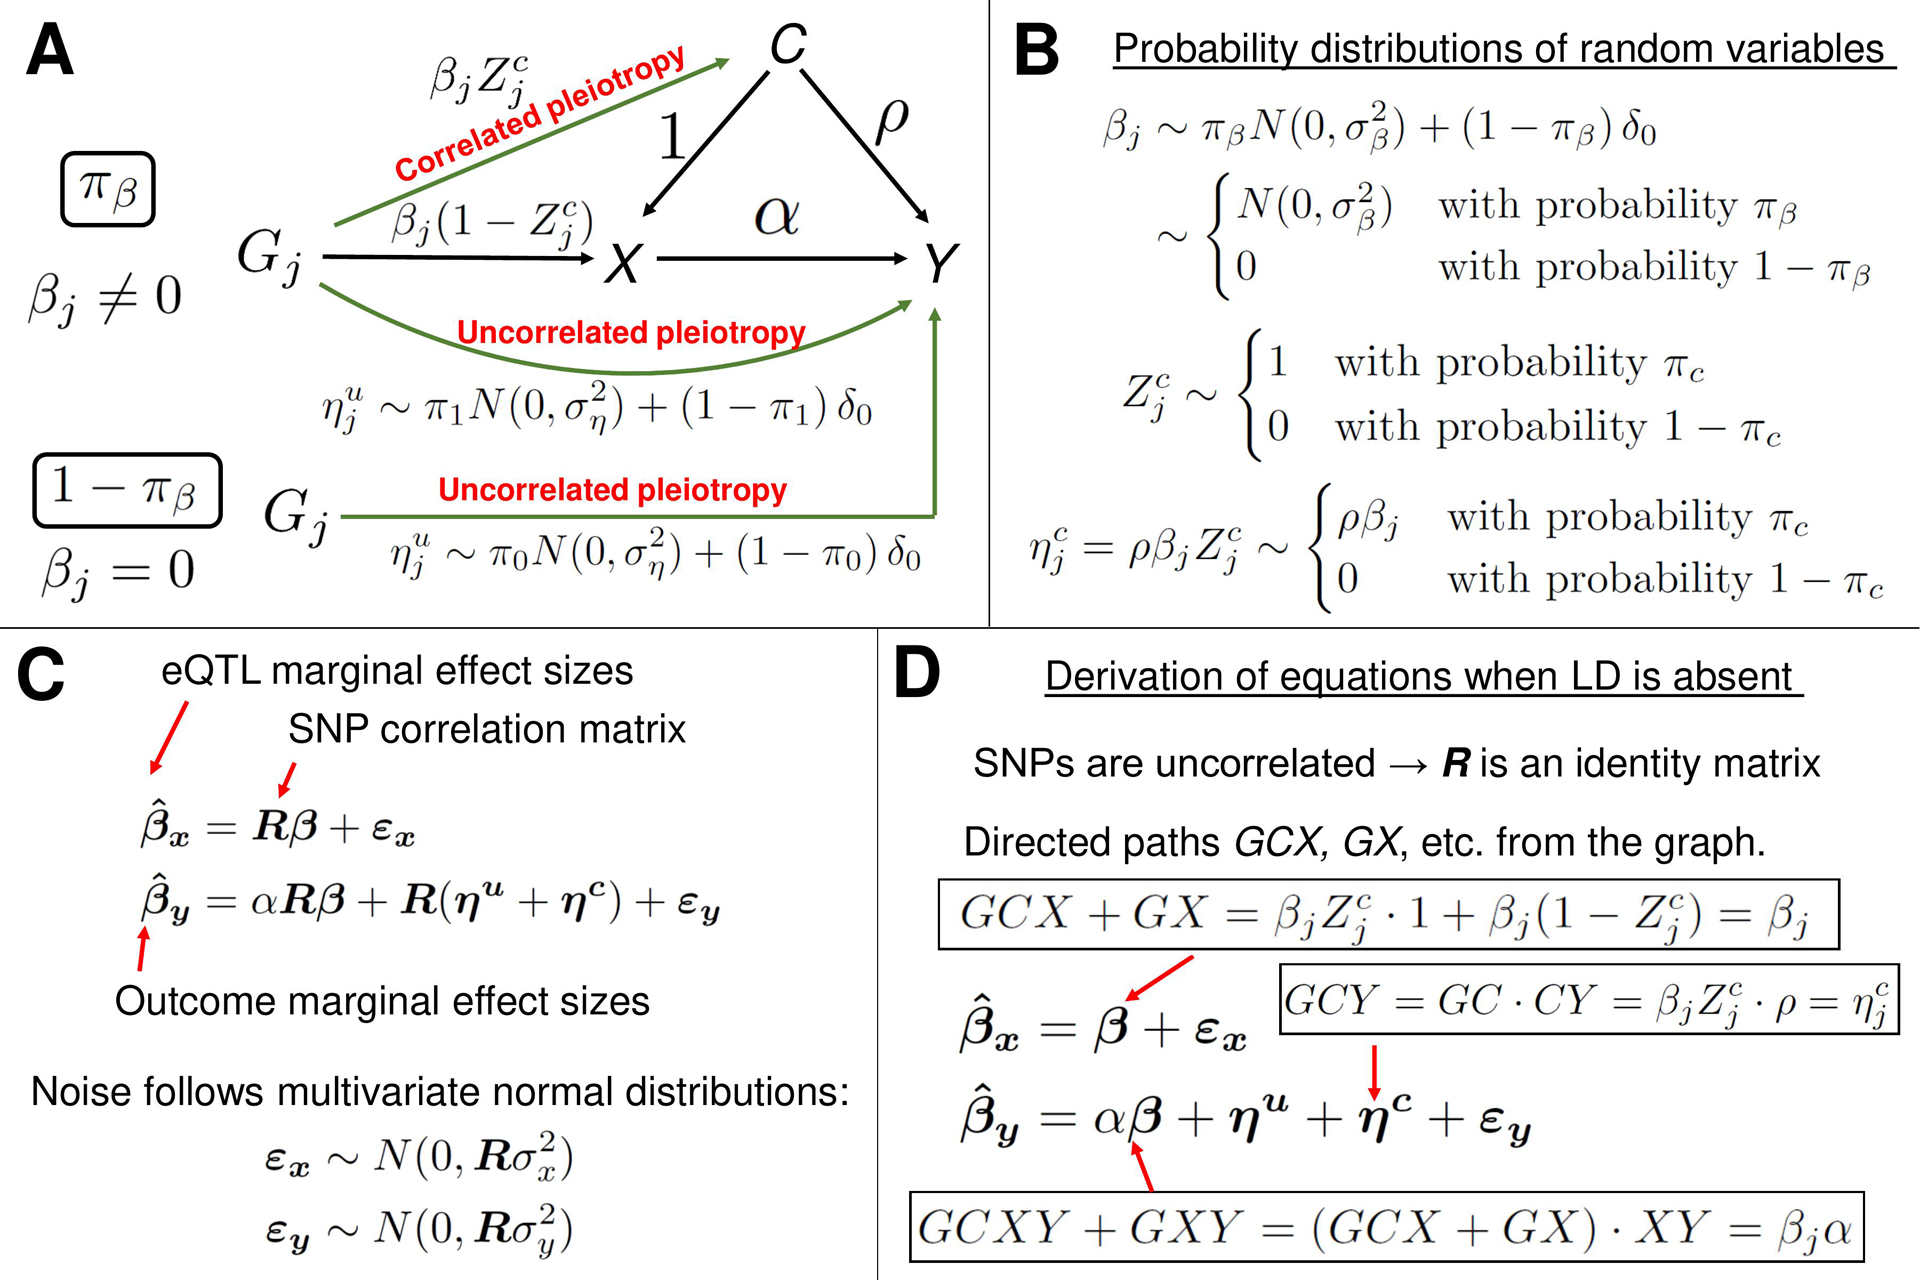
Background: Systemic lupus erythematosus (SLE) is a chronic autoimmune condition with complex causes involving genetic and environmental factors. While genome-wide association studies (GWASs) have identified genetic loci associated with SLE, the functional genomic elements responsible for disease development remain largely unknown. Mendelian Randomization (MR) is an instrumental variable approach to causal inference based on data from observational studies, where genetic variants are employed as instrumental variables (IVs).

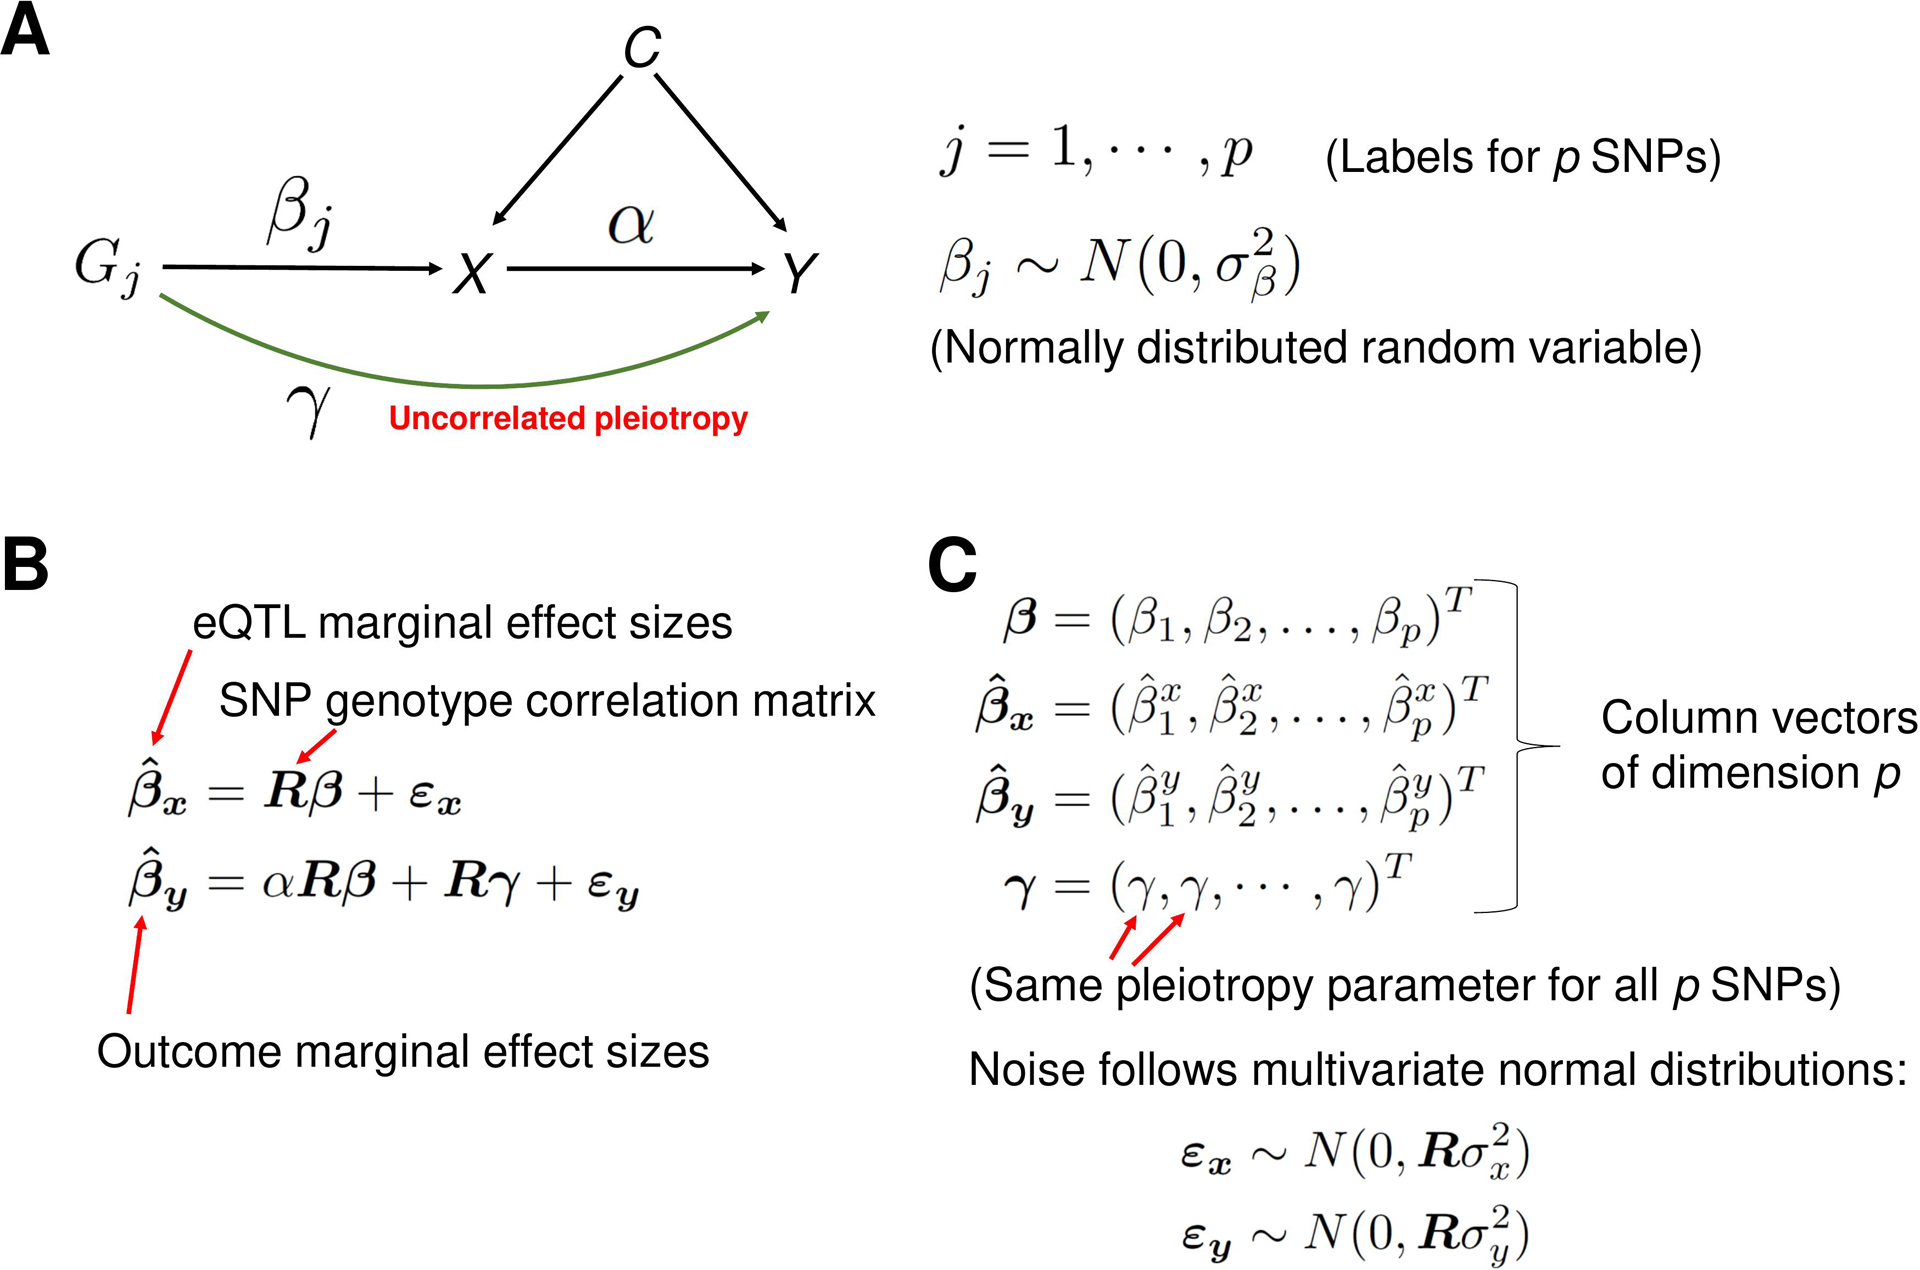
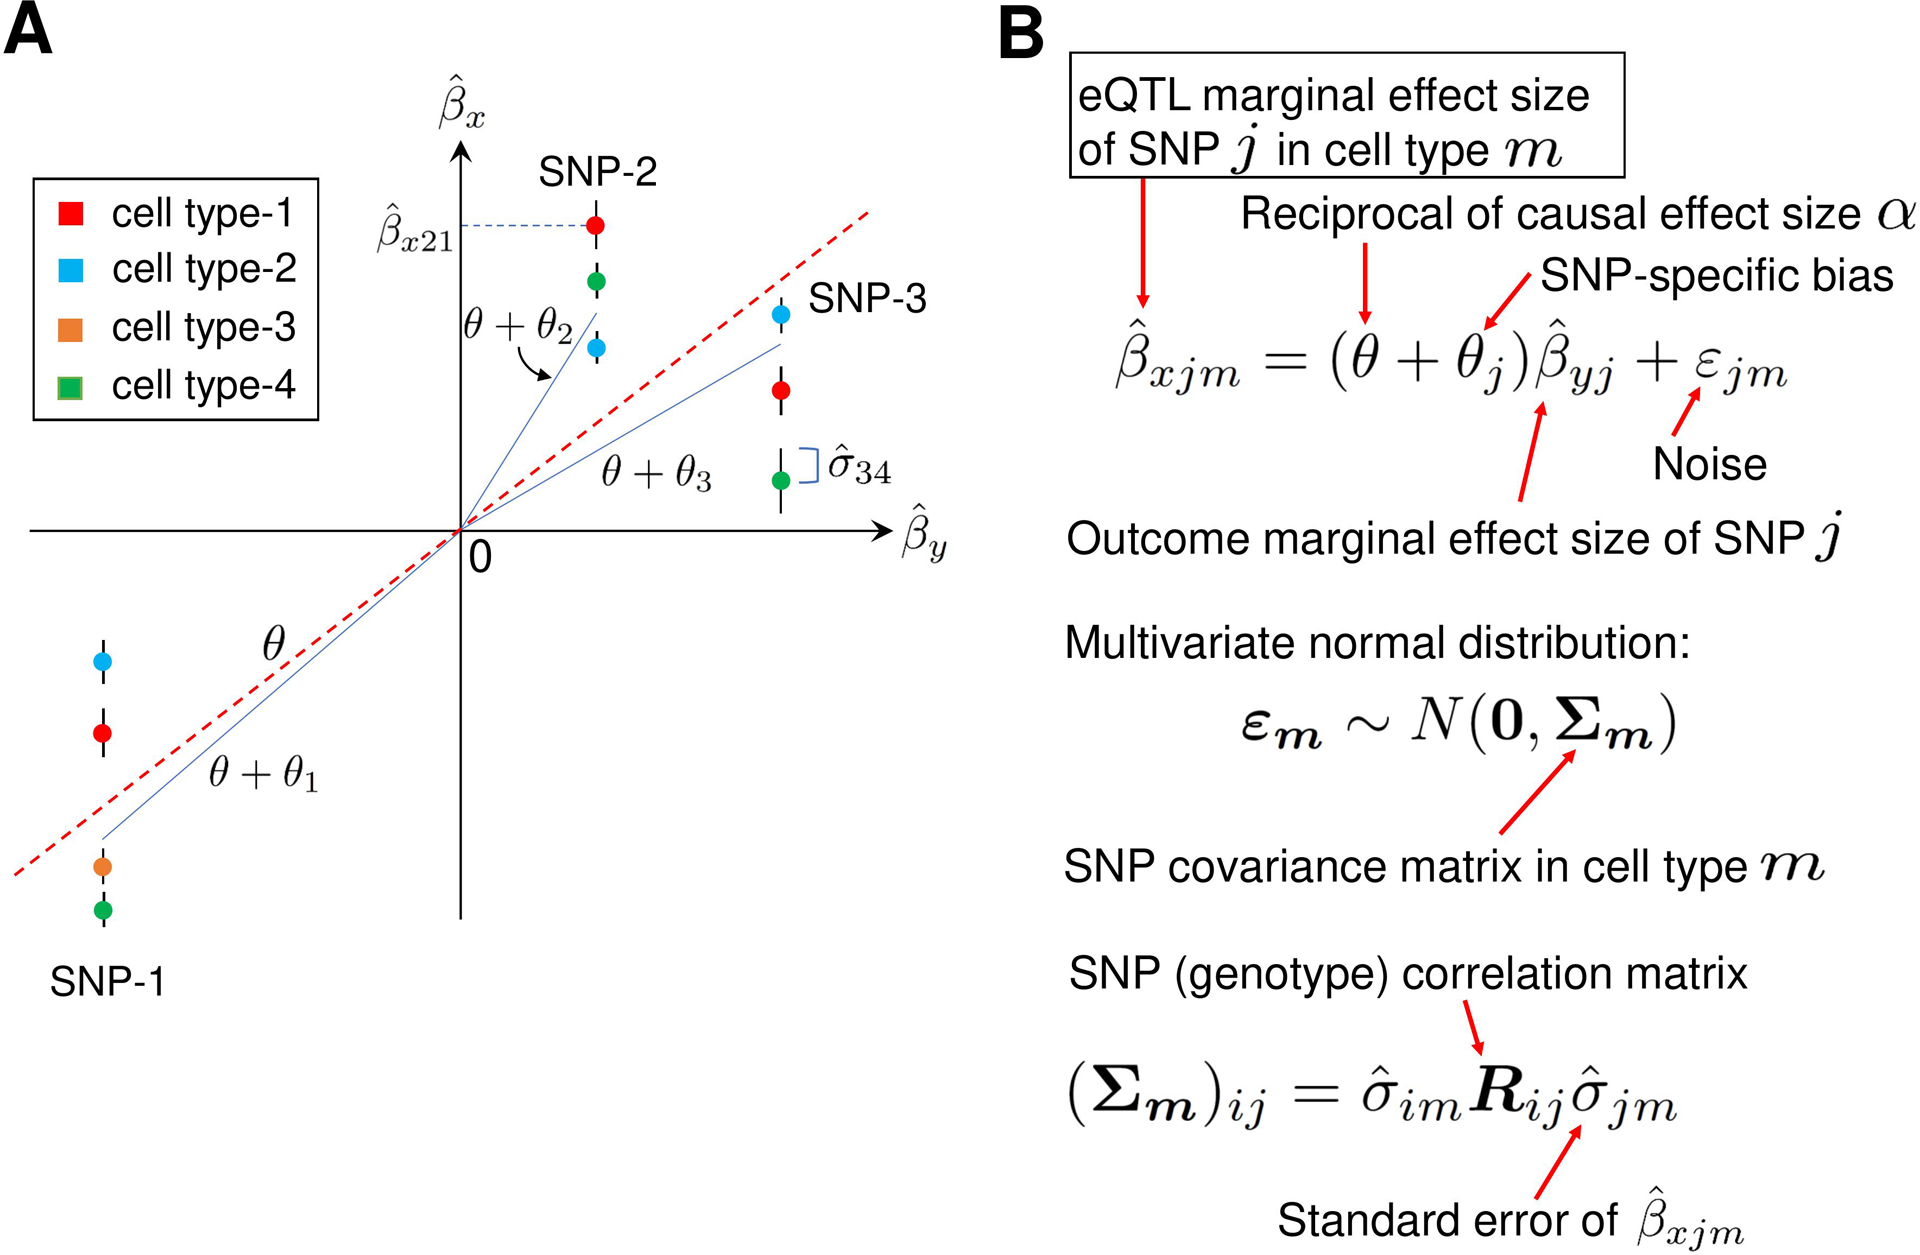
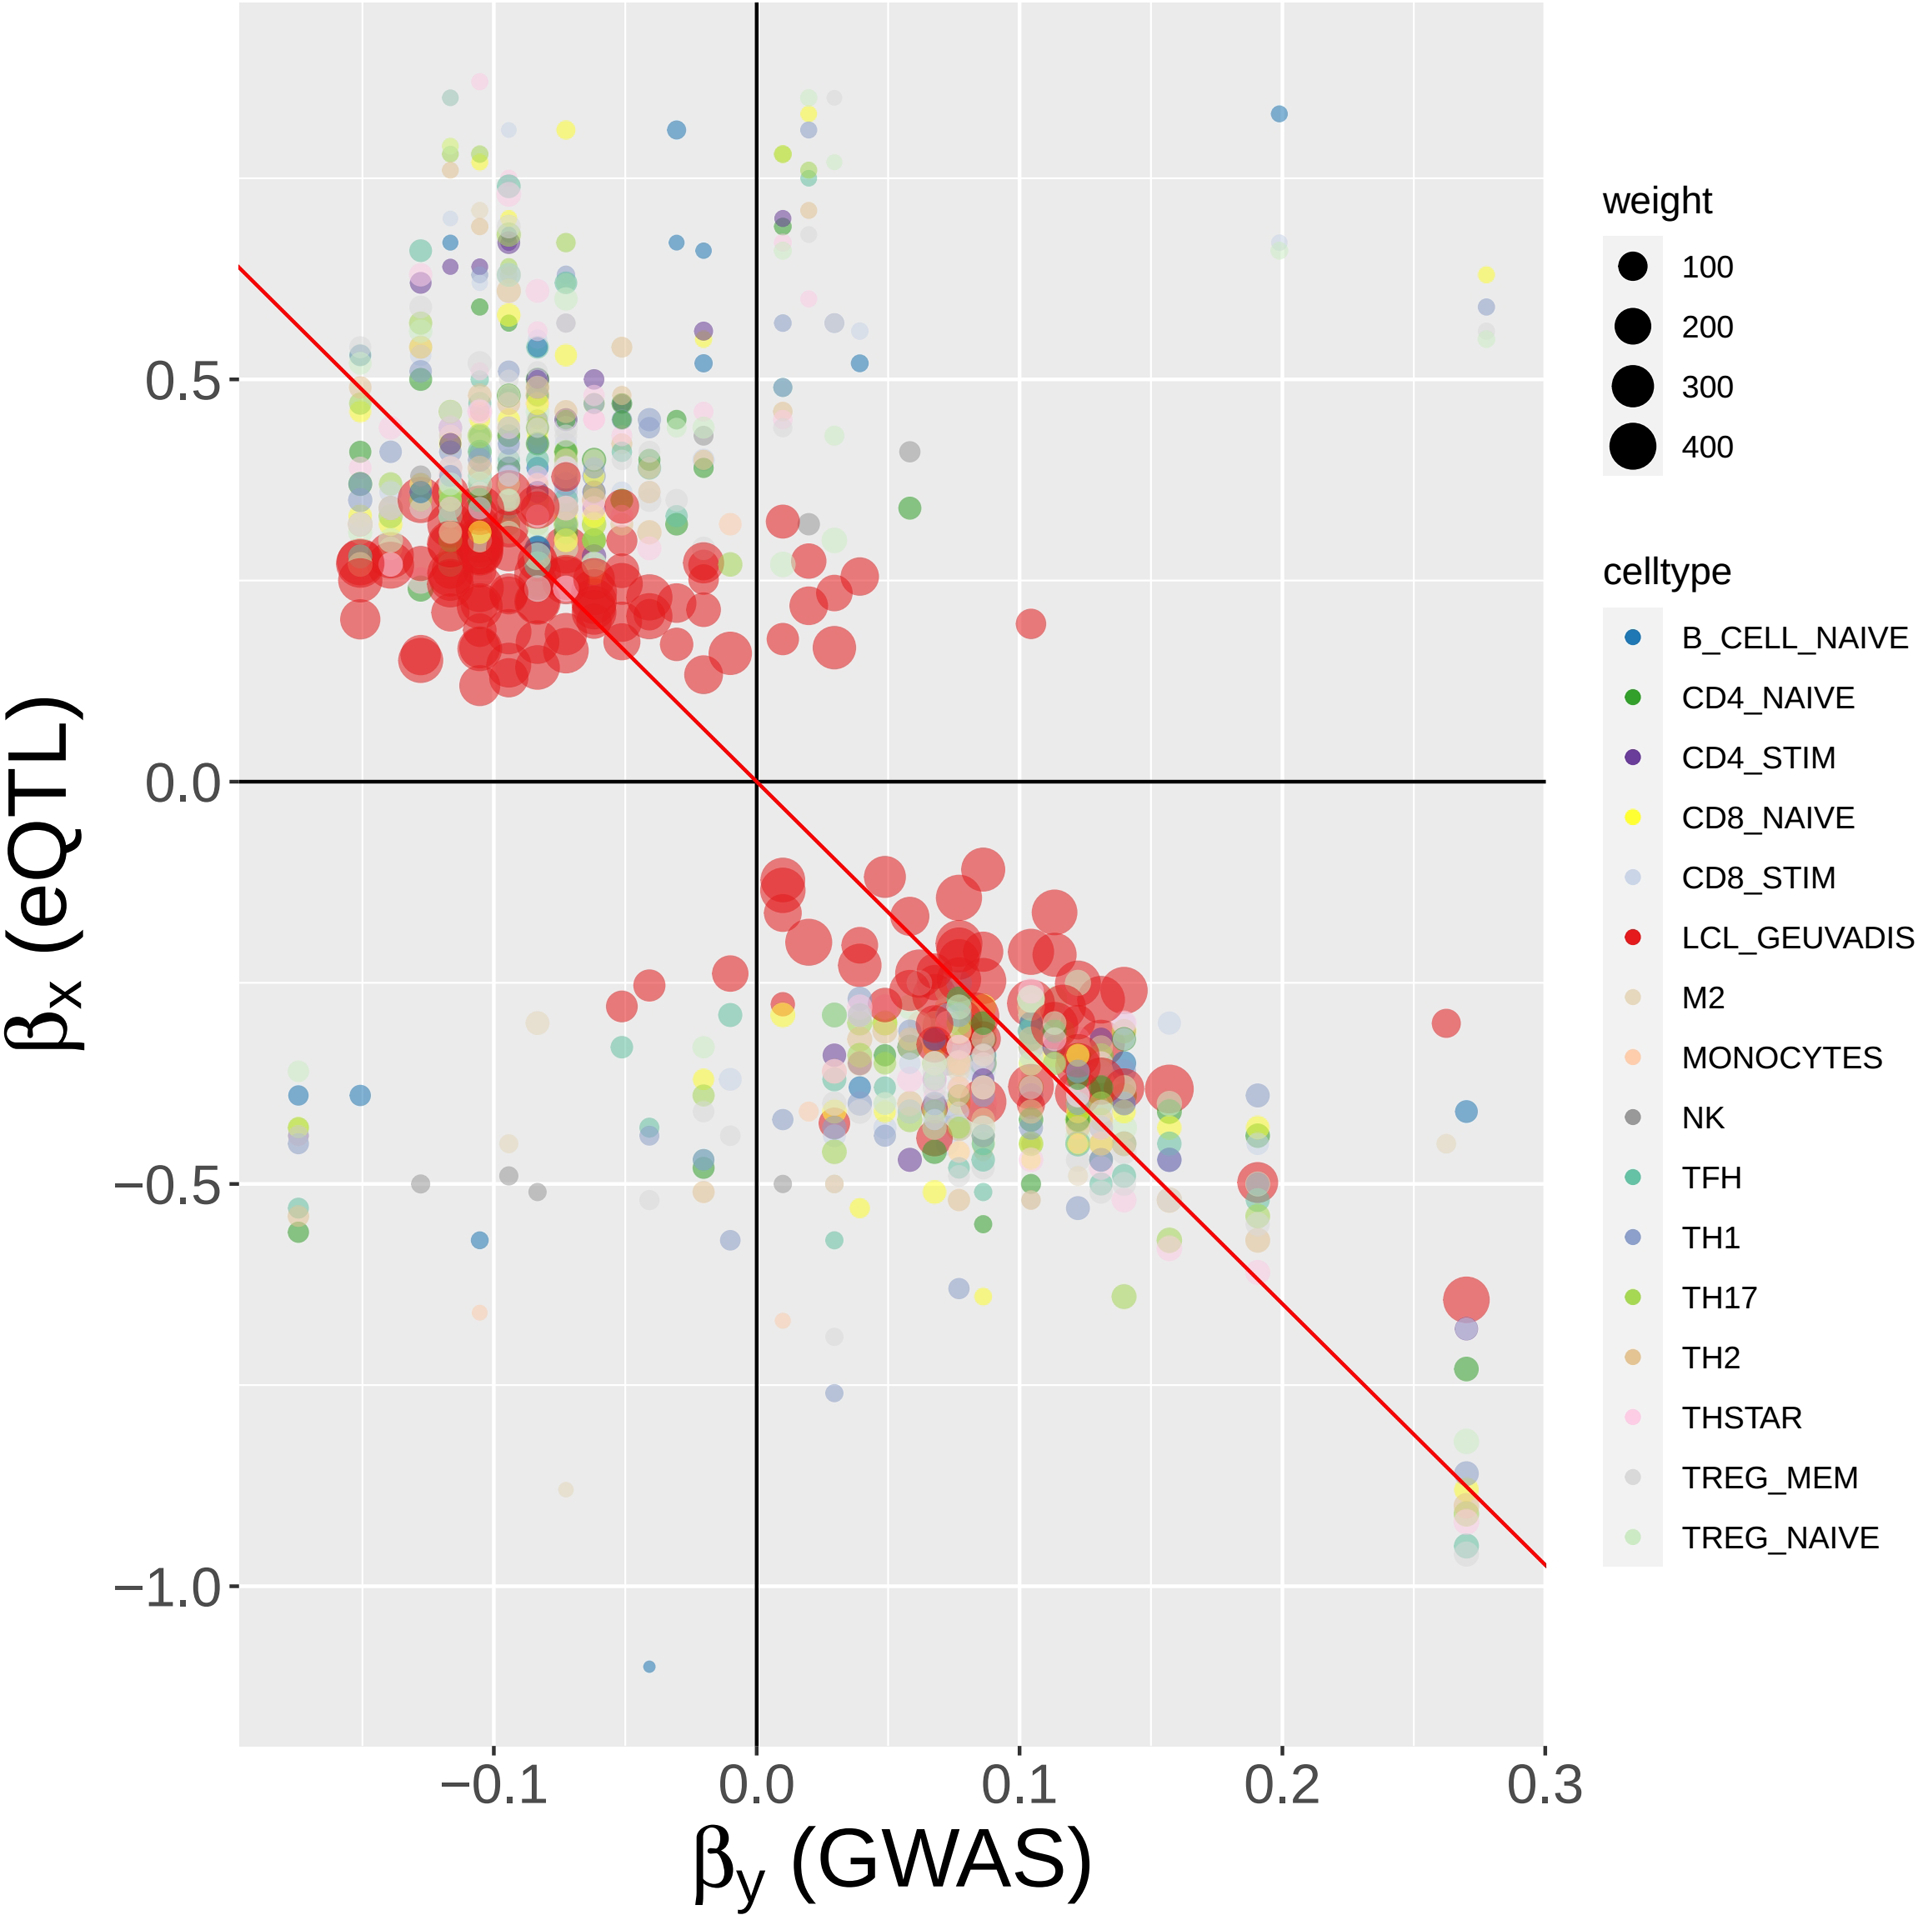
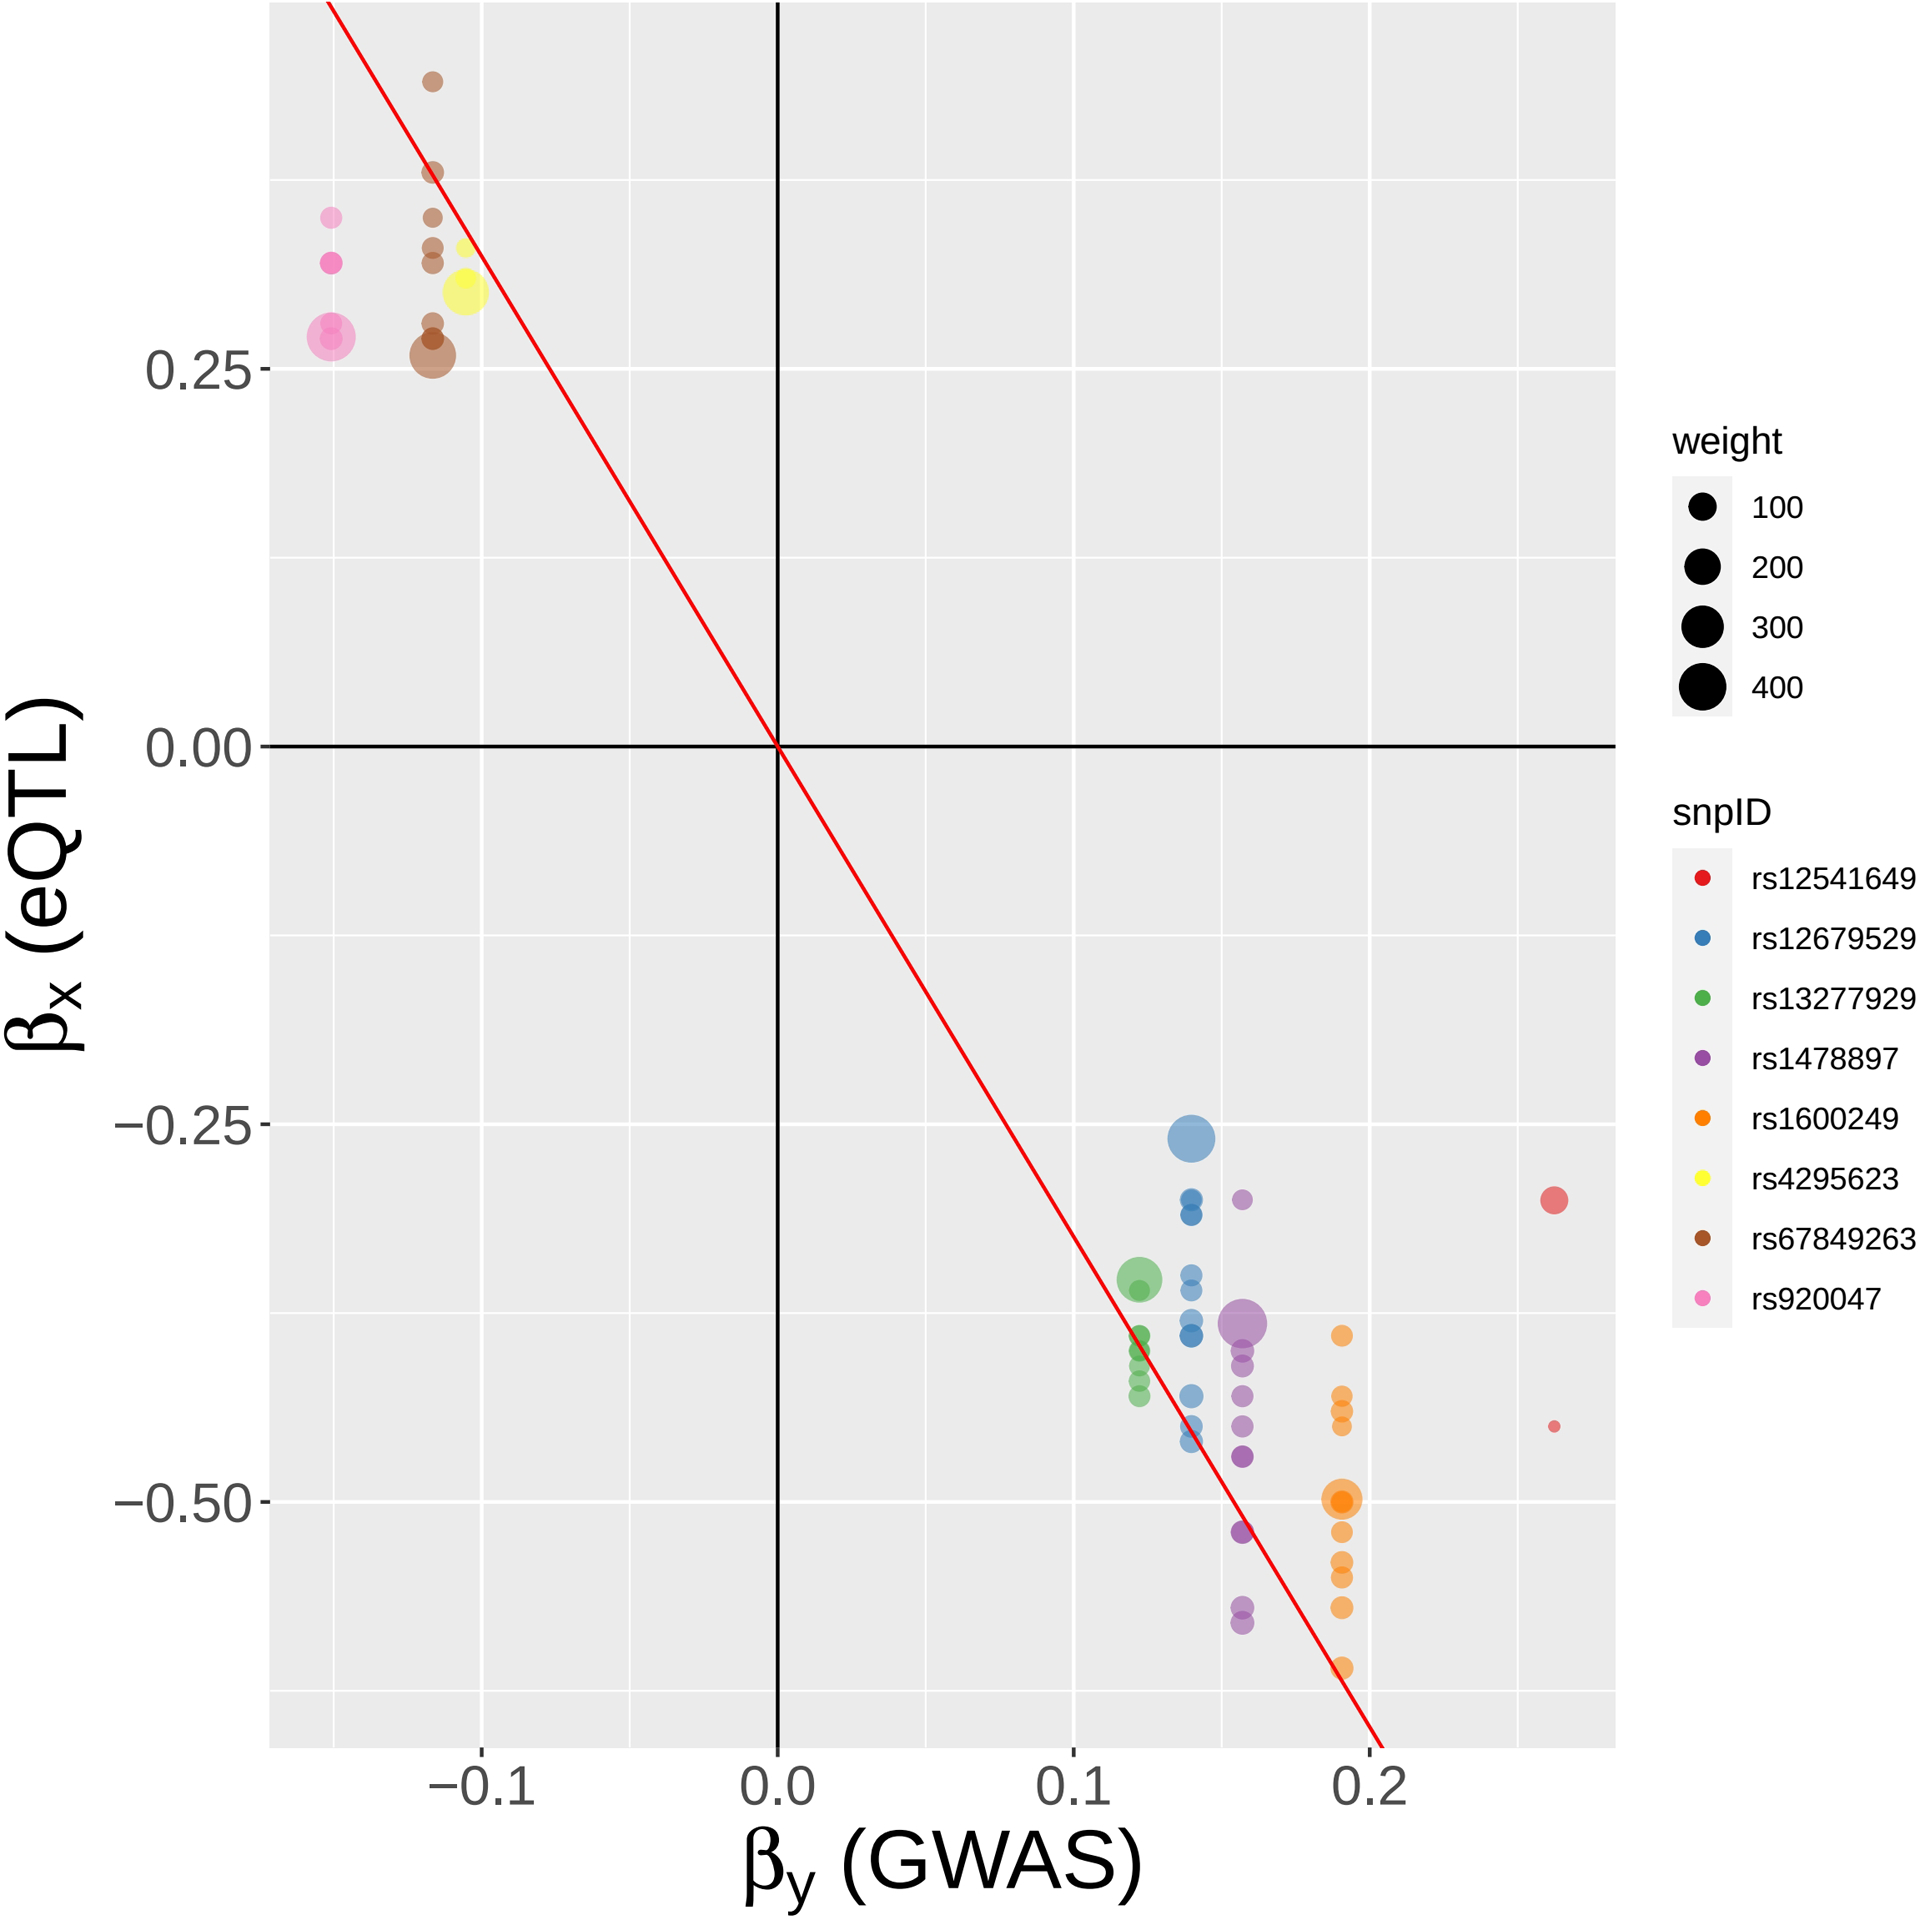
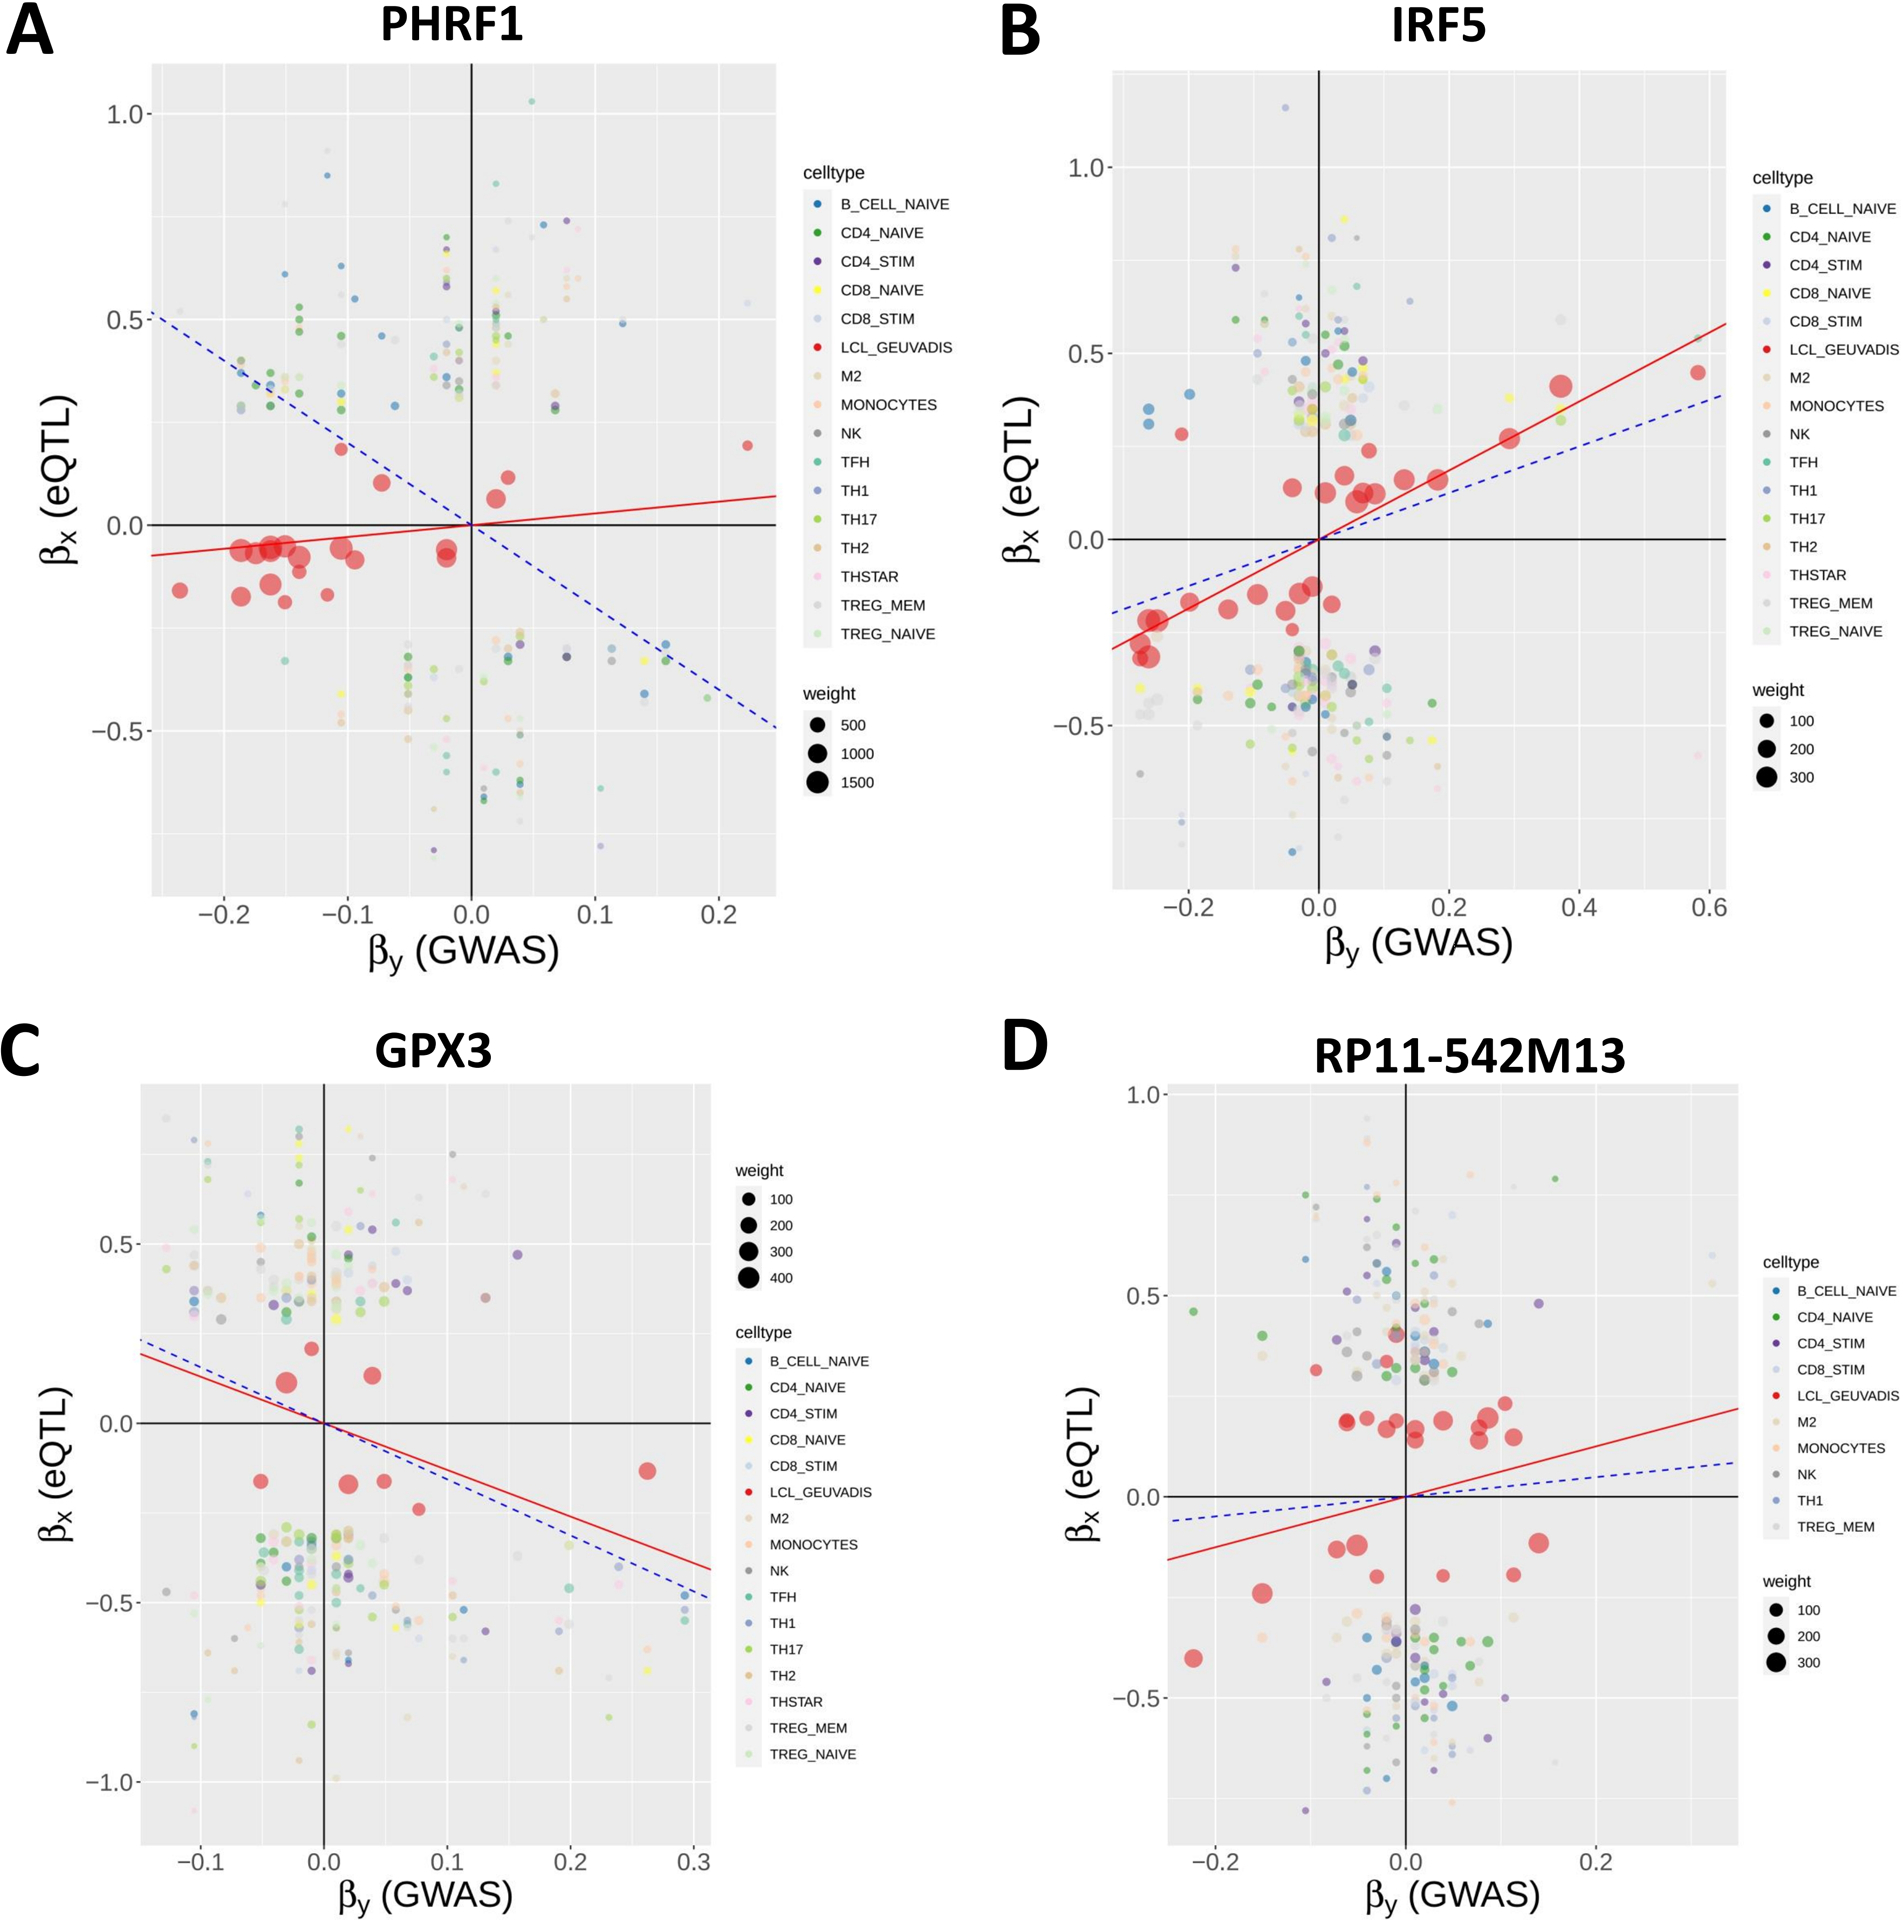
Methods: This study utilized a two-step strategy to identify causal genes for SLE. In the first step, the classical MR method was employed, assuming the absence of horizontal pleiotropy, to estimate the causal effect of gene expression on SLE. In the second step, advanced probabilistic MR methods (PMR-Egger, MRAID, and MR-MtRobin) were applied to the genes identified in the first step, considering horizontal pleiotropy, to filter out false positives. PMR-Egger and MRAID analyses utilized whole blood expression quantitative trait loci (eQTL) and SLE GWAS summary data, while MR-MtRobin analysis used an independent eQTL dataset from multiple immune cell types along with the same SLE GWAS data.

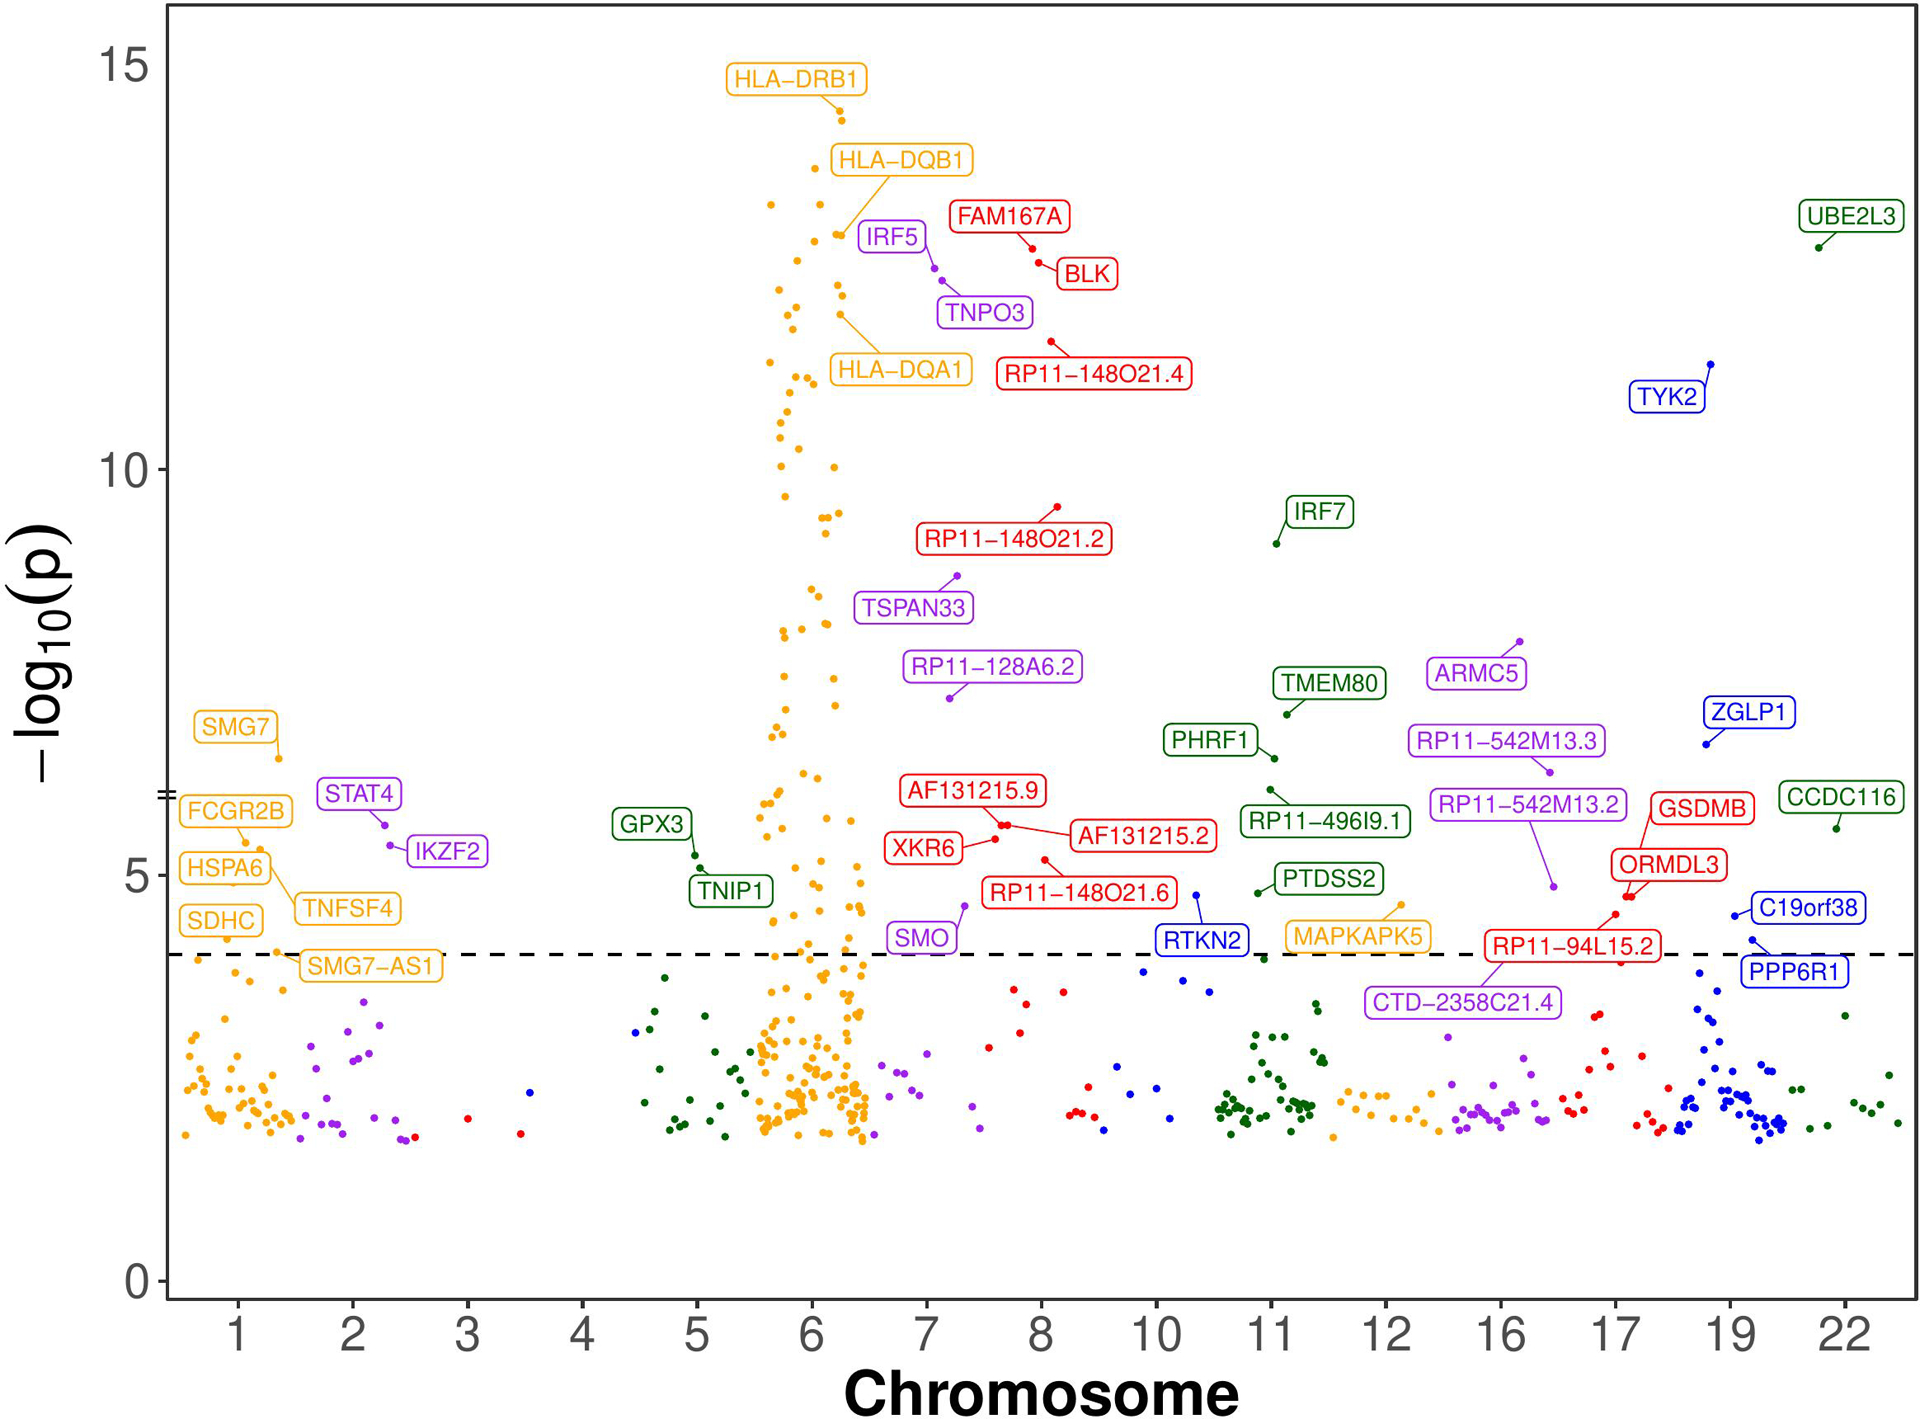
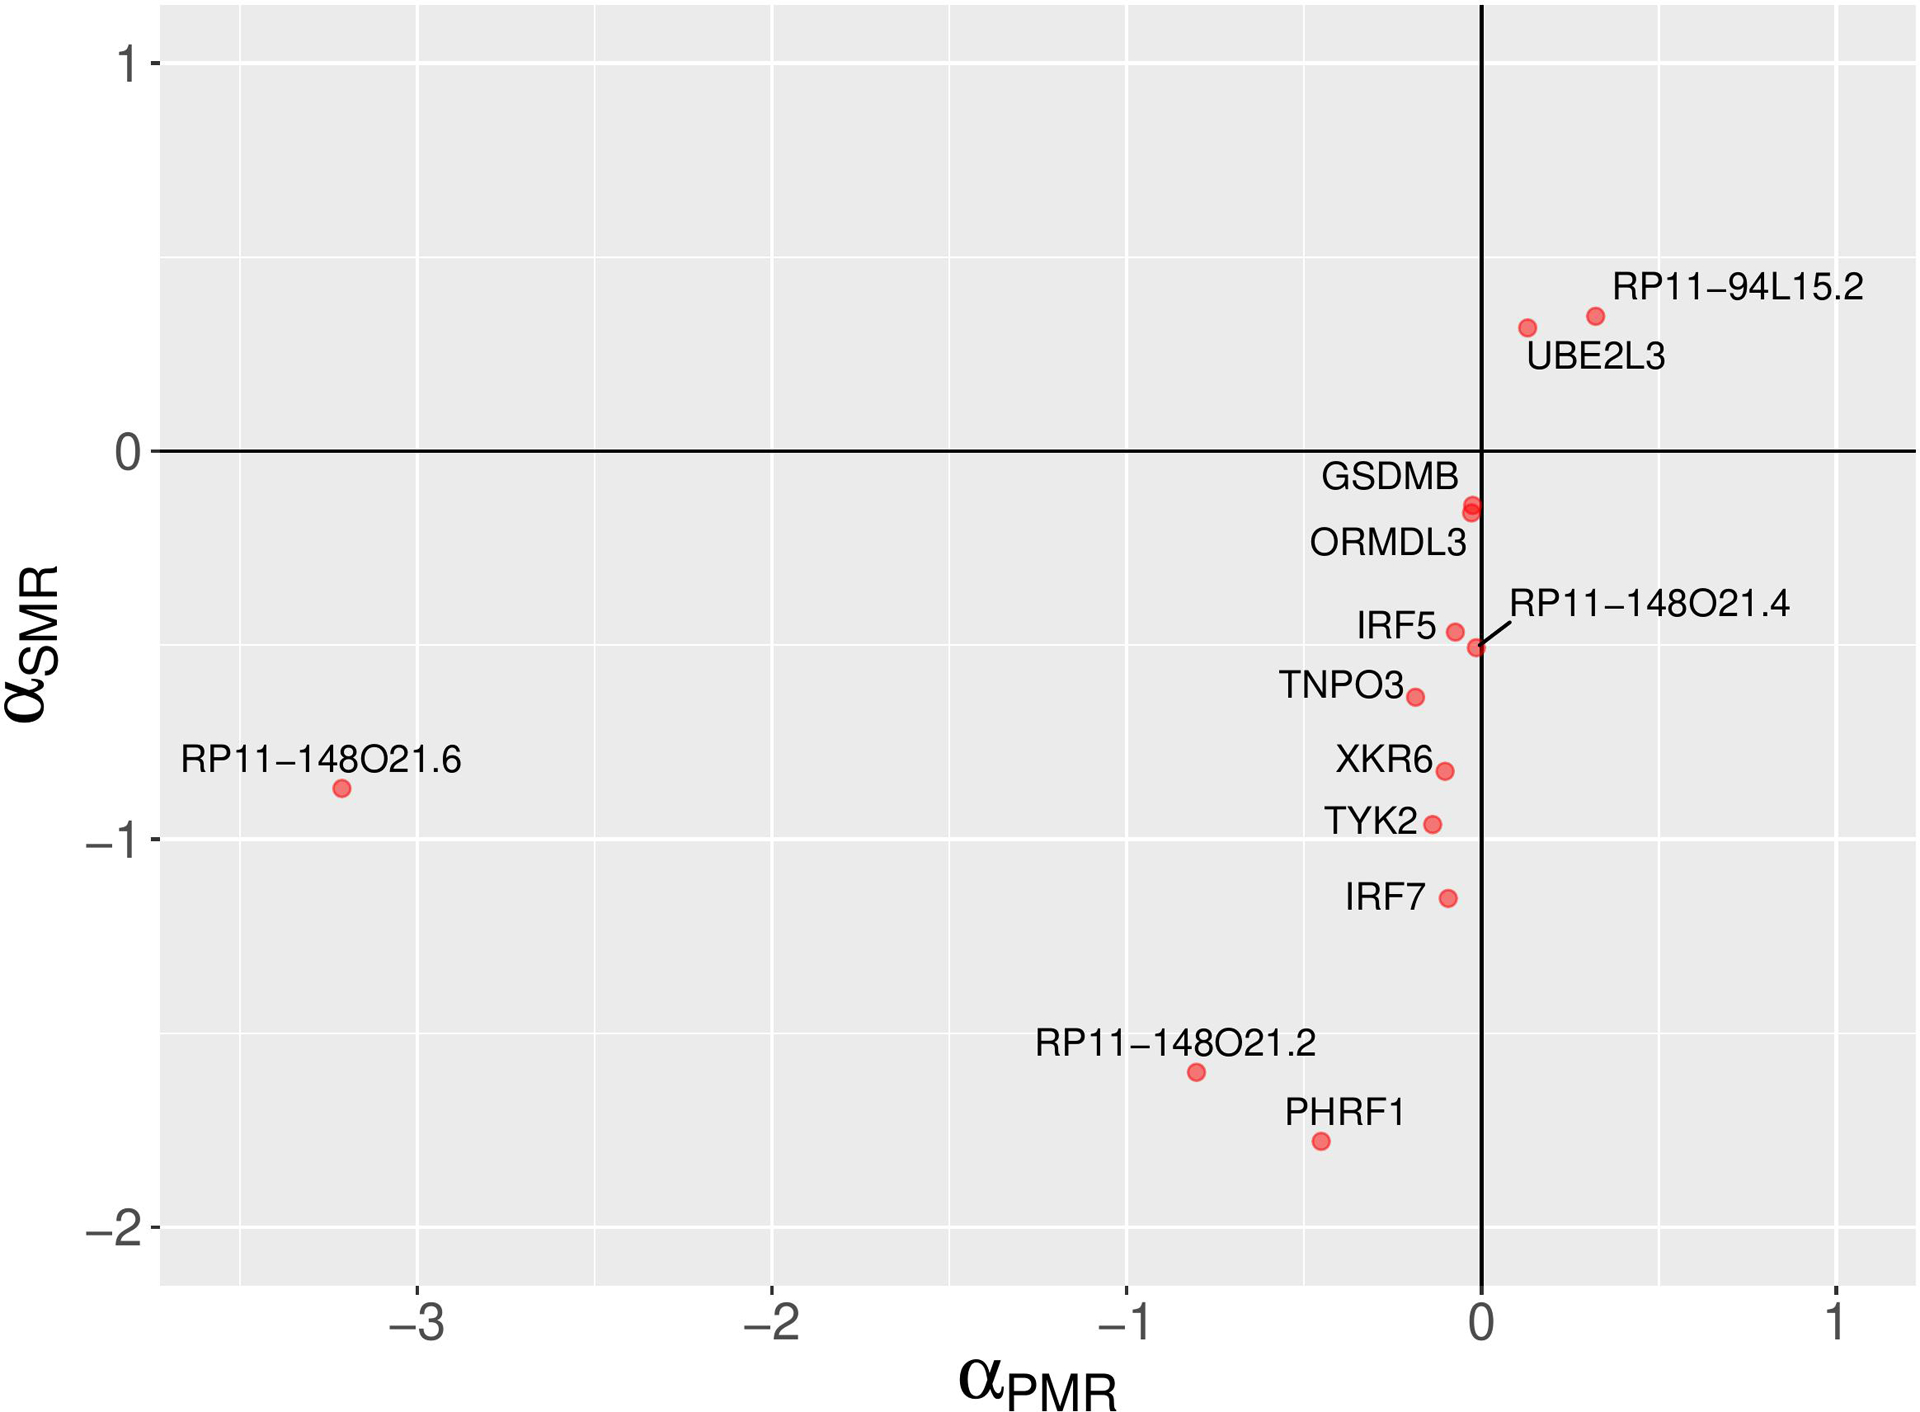
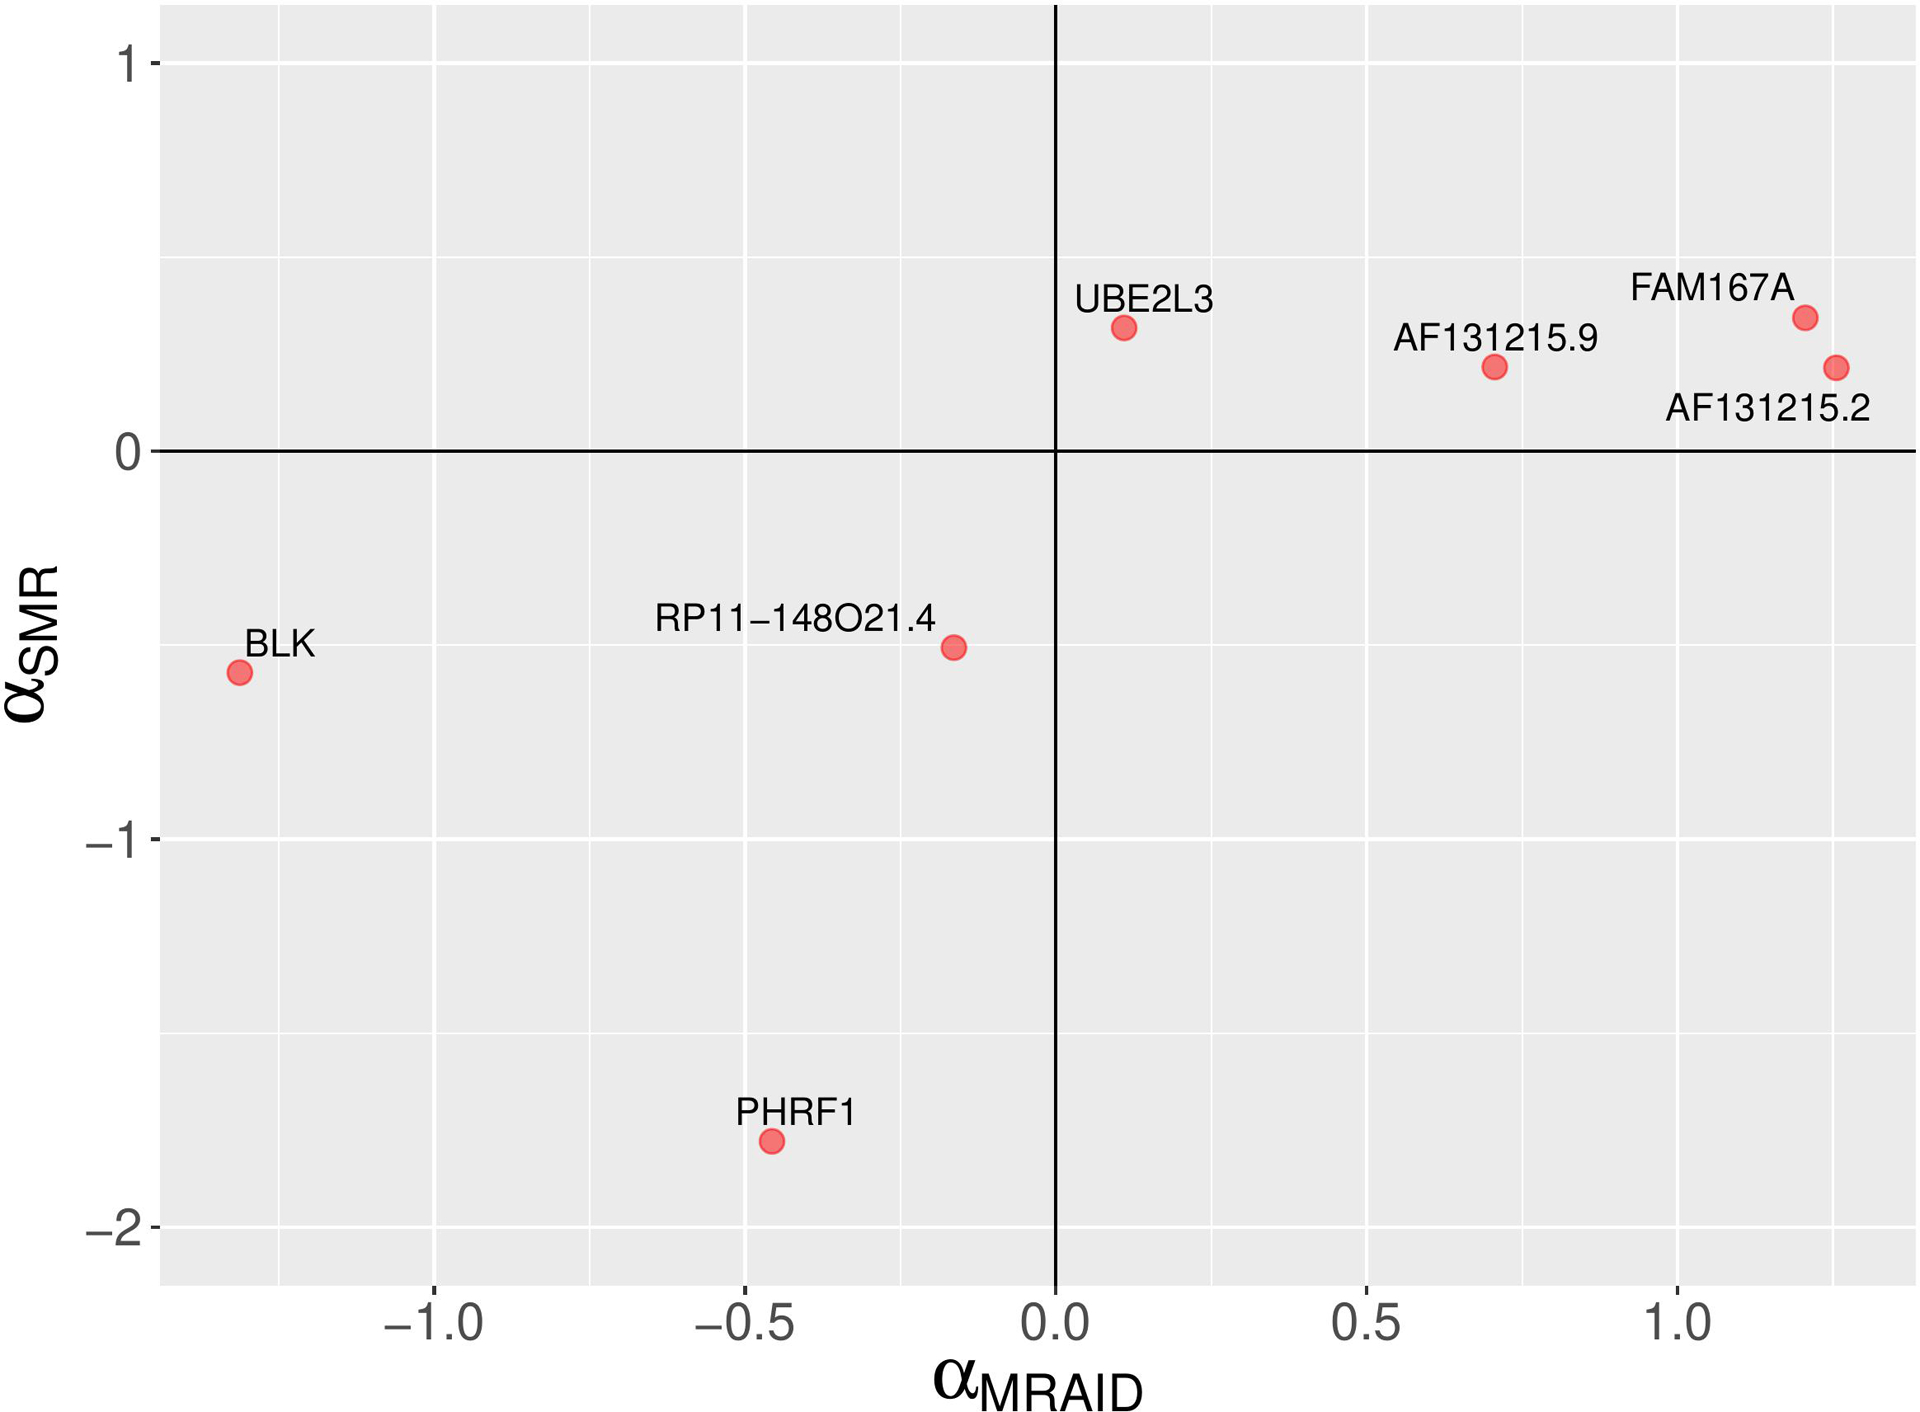
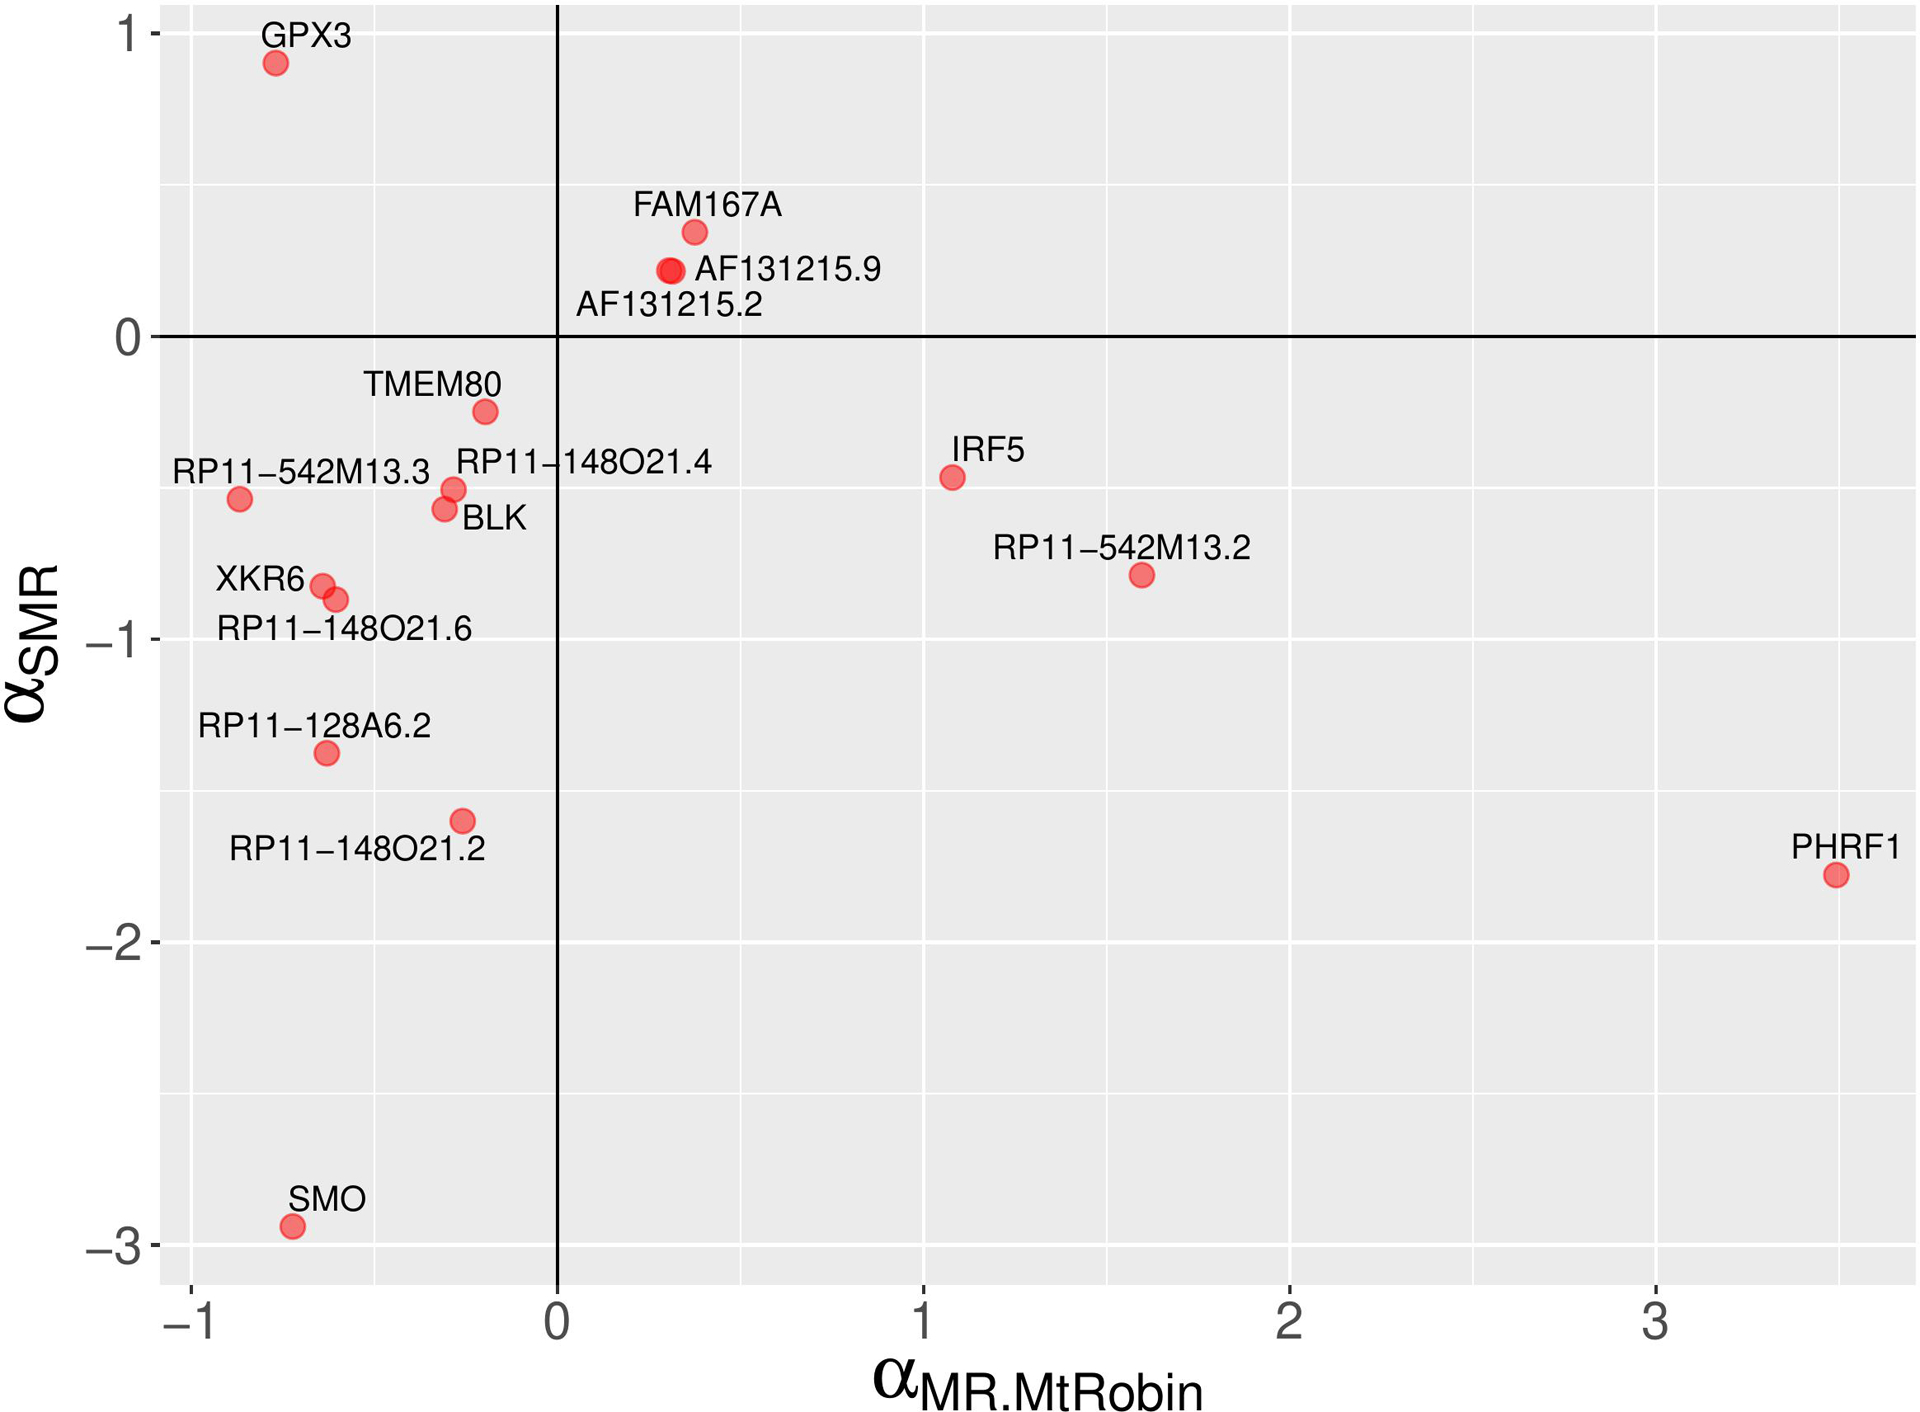
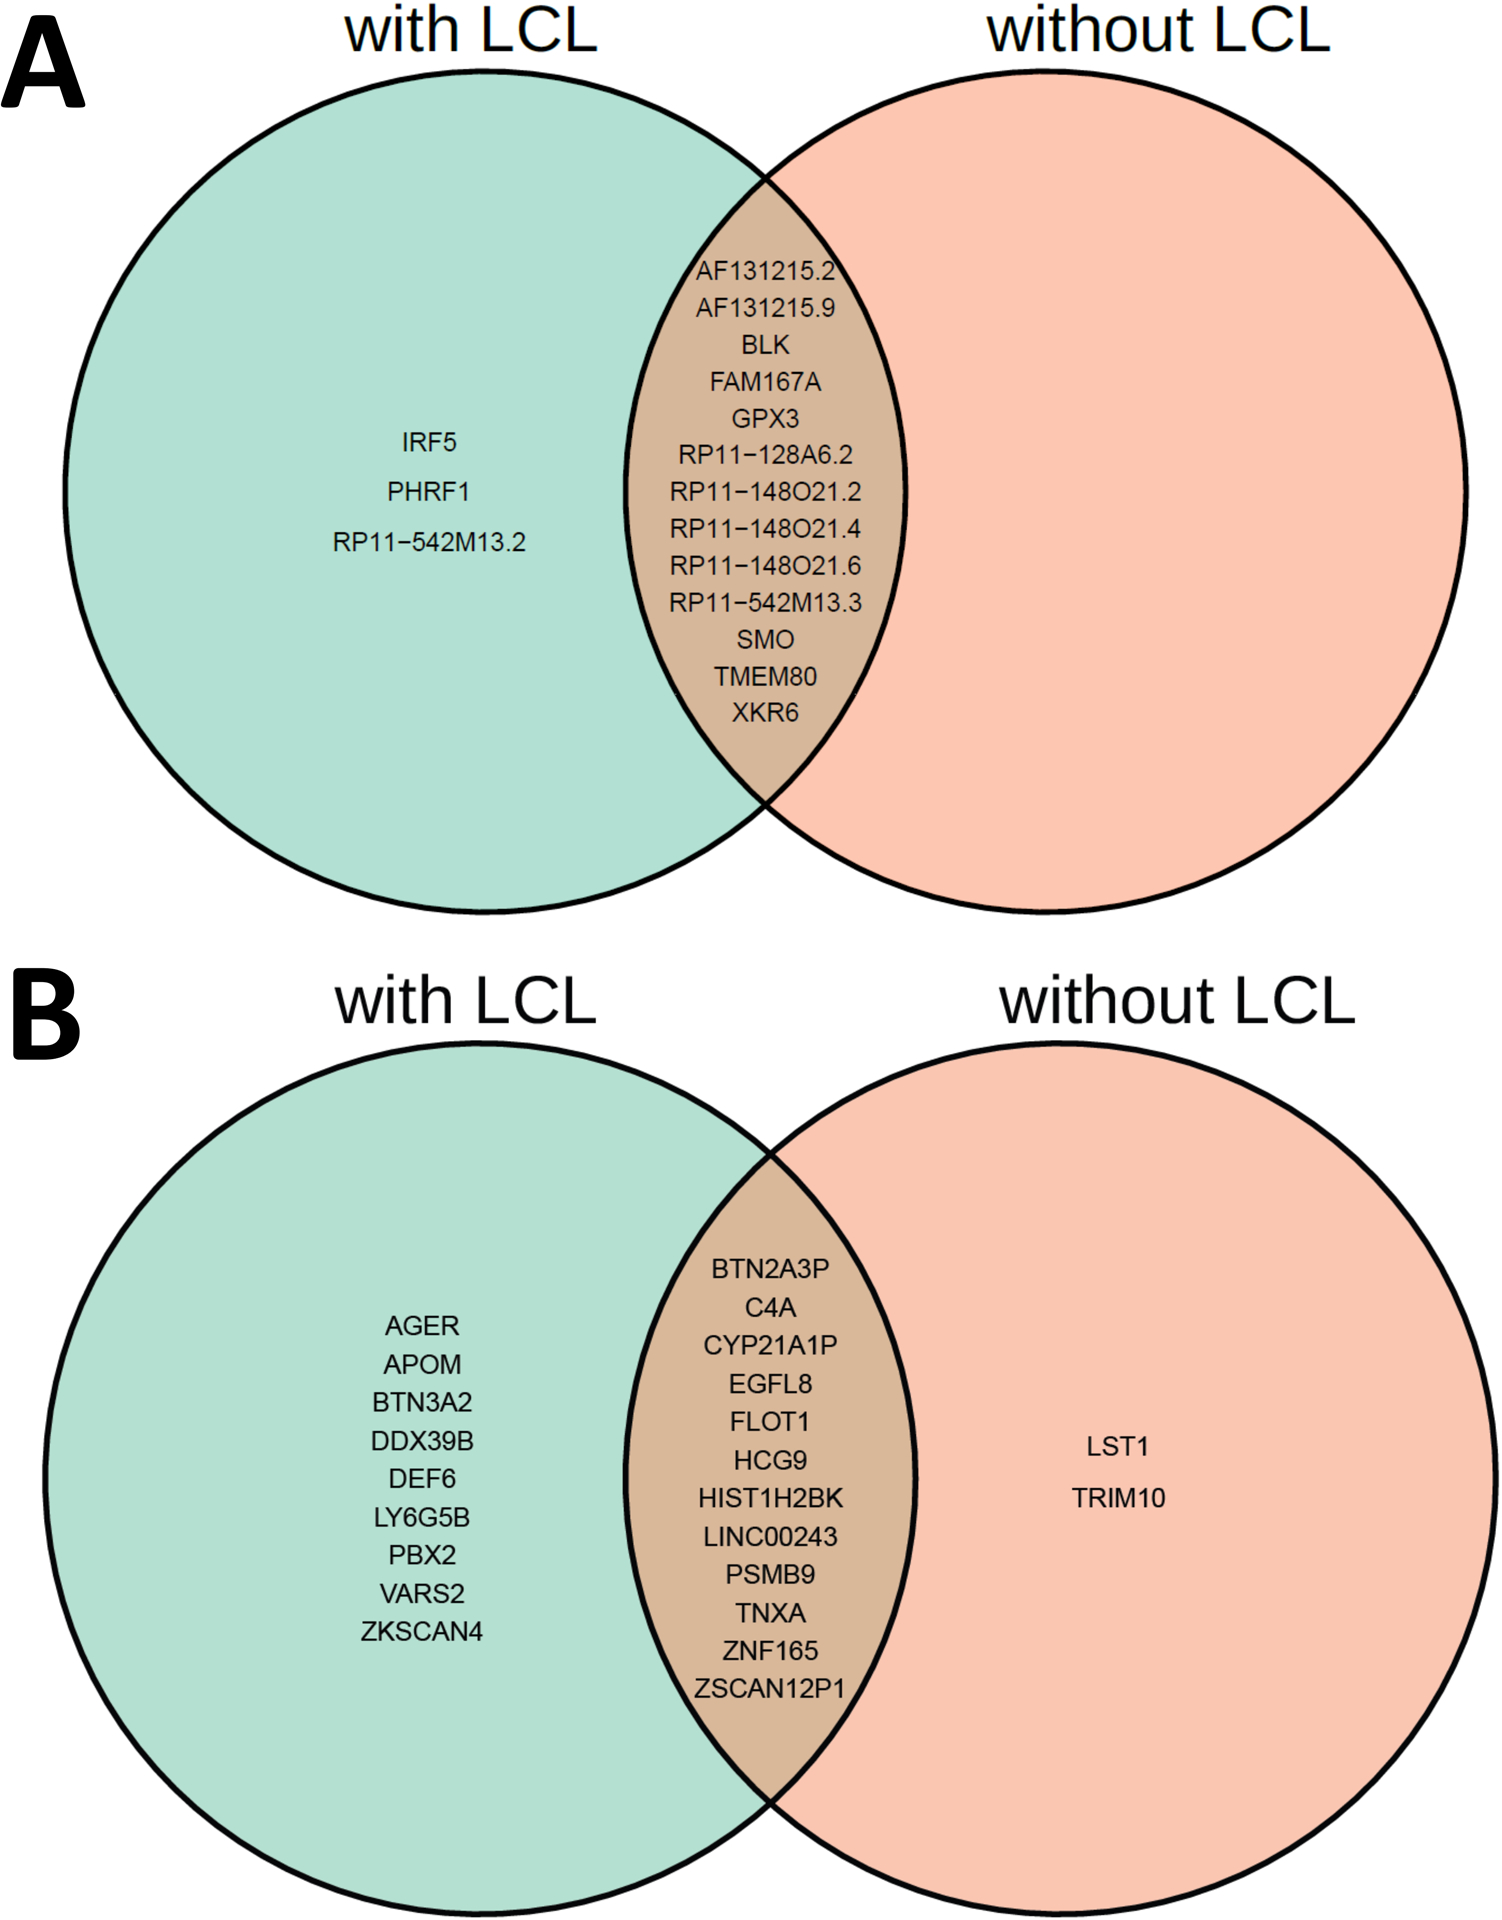
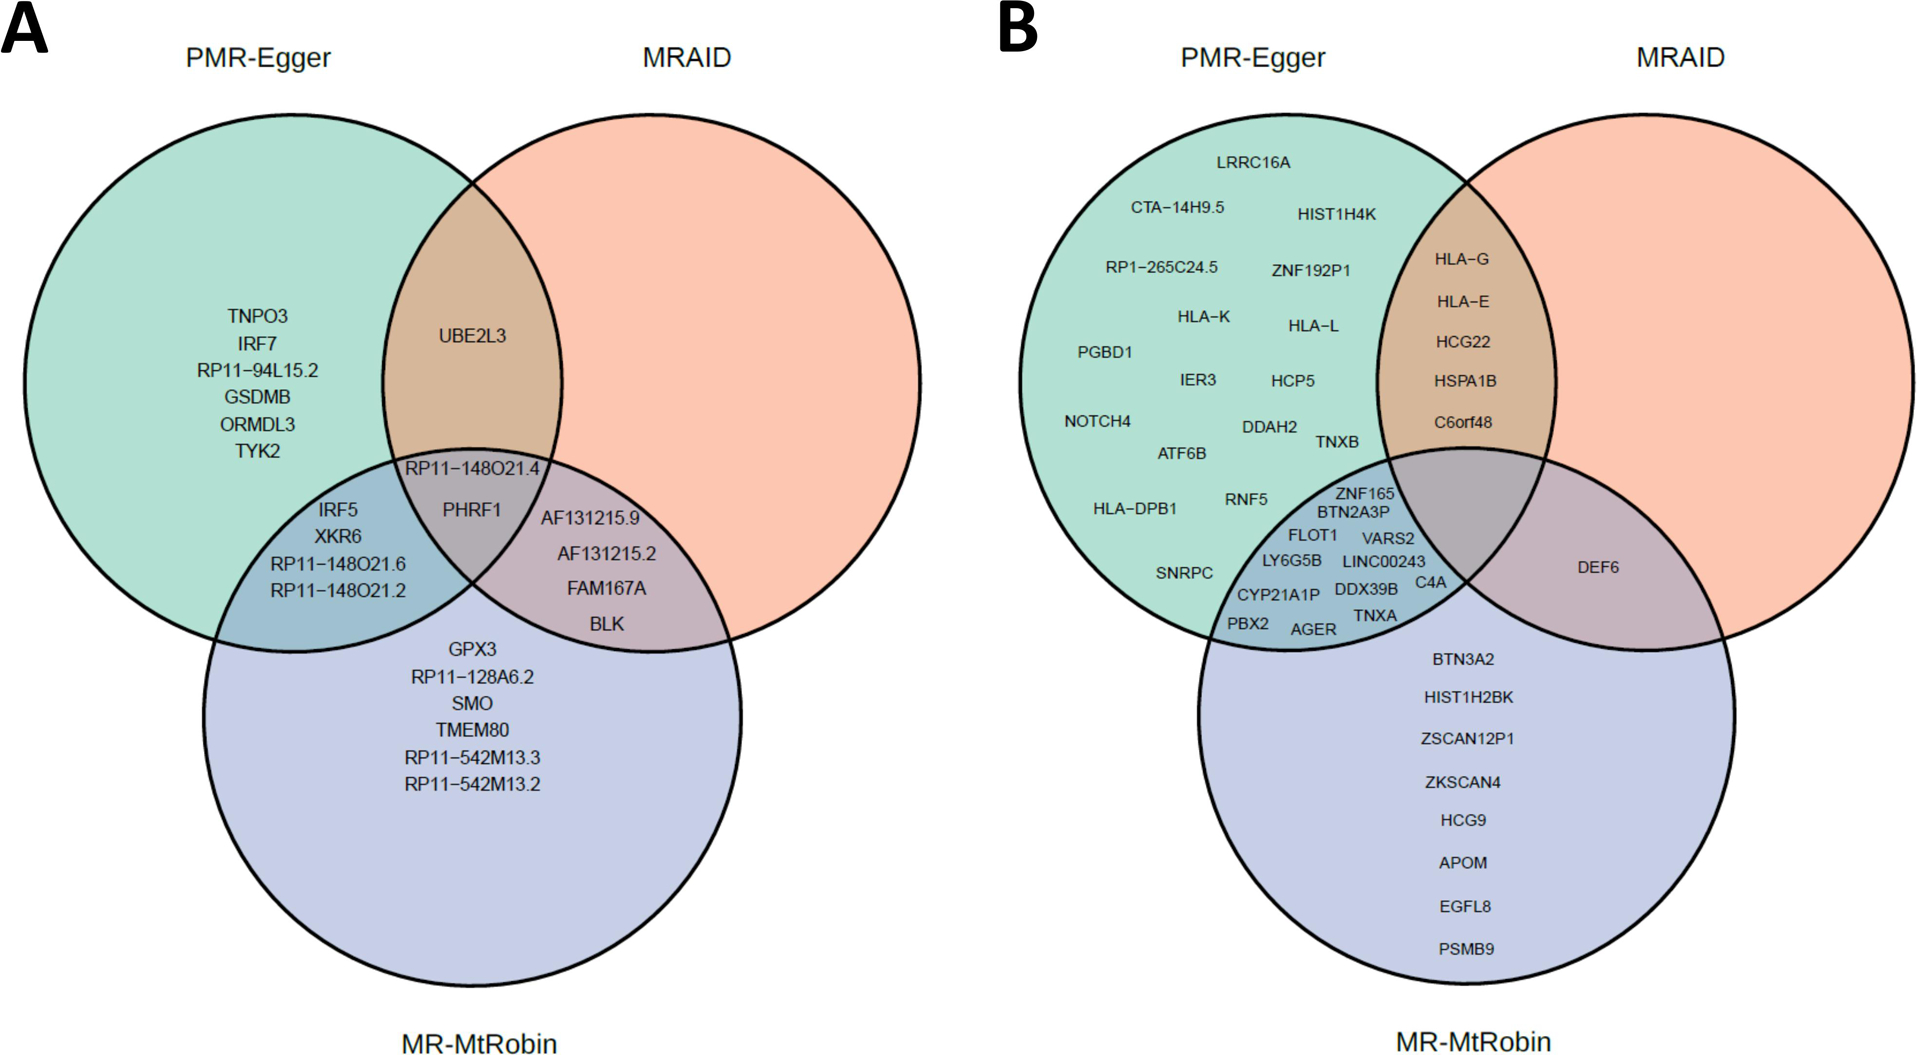
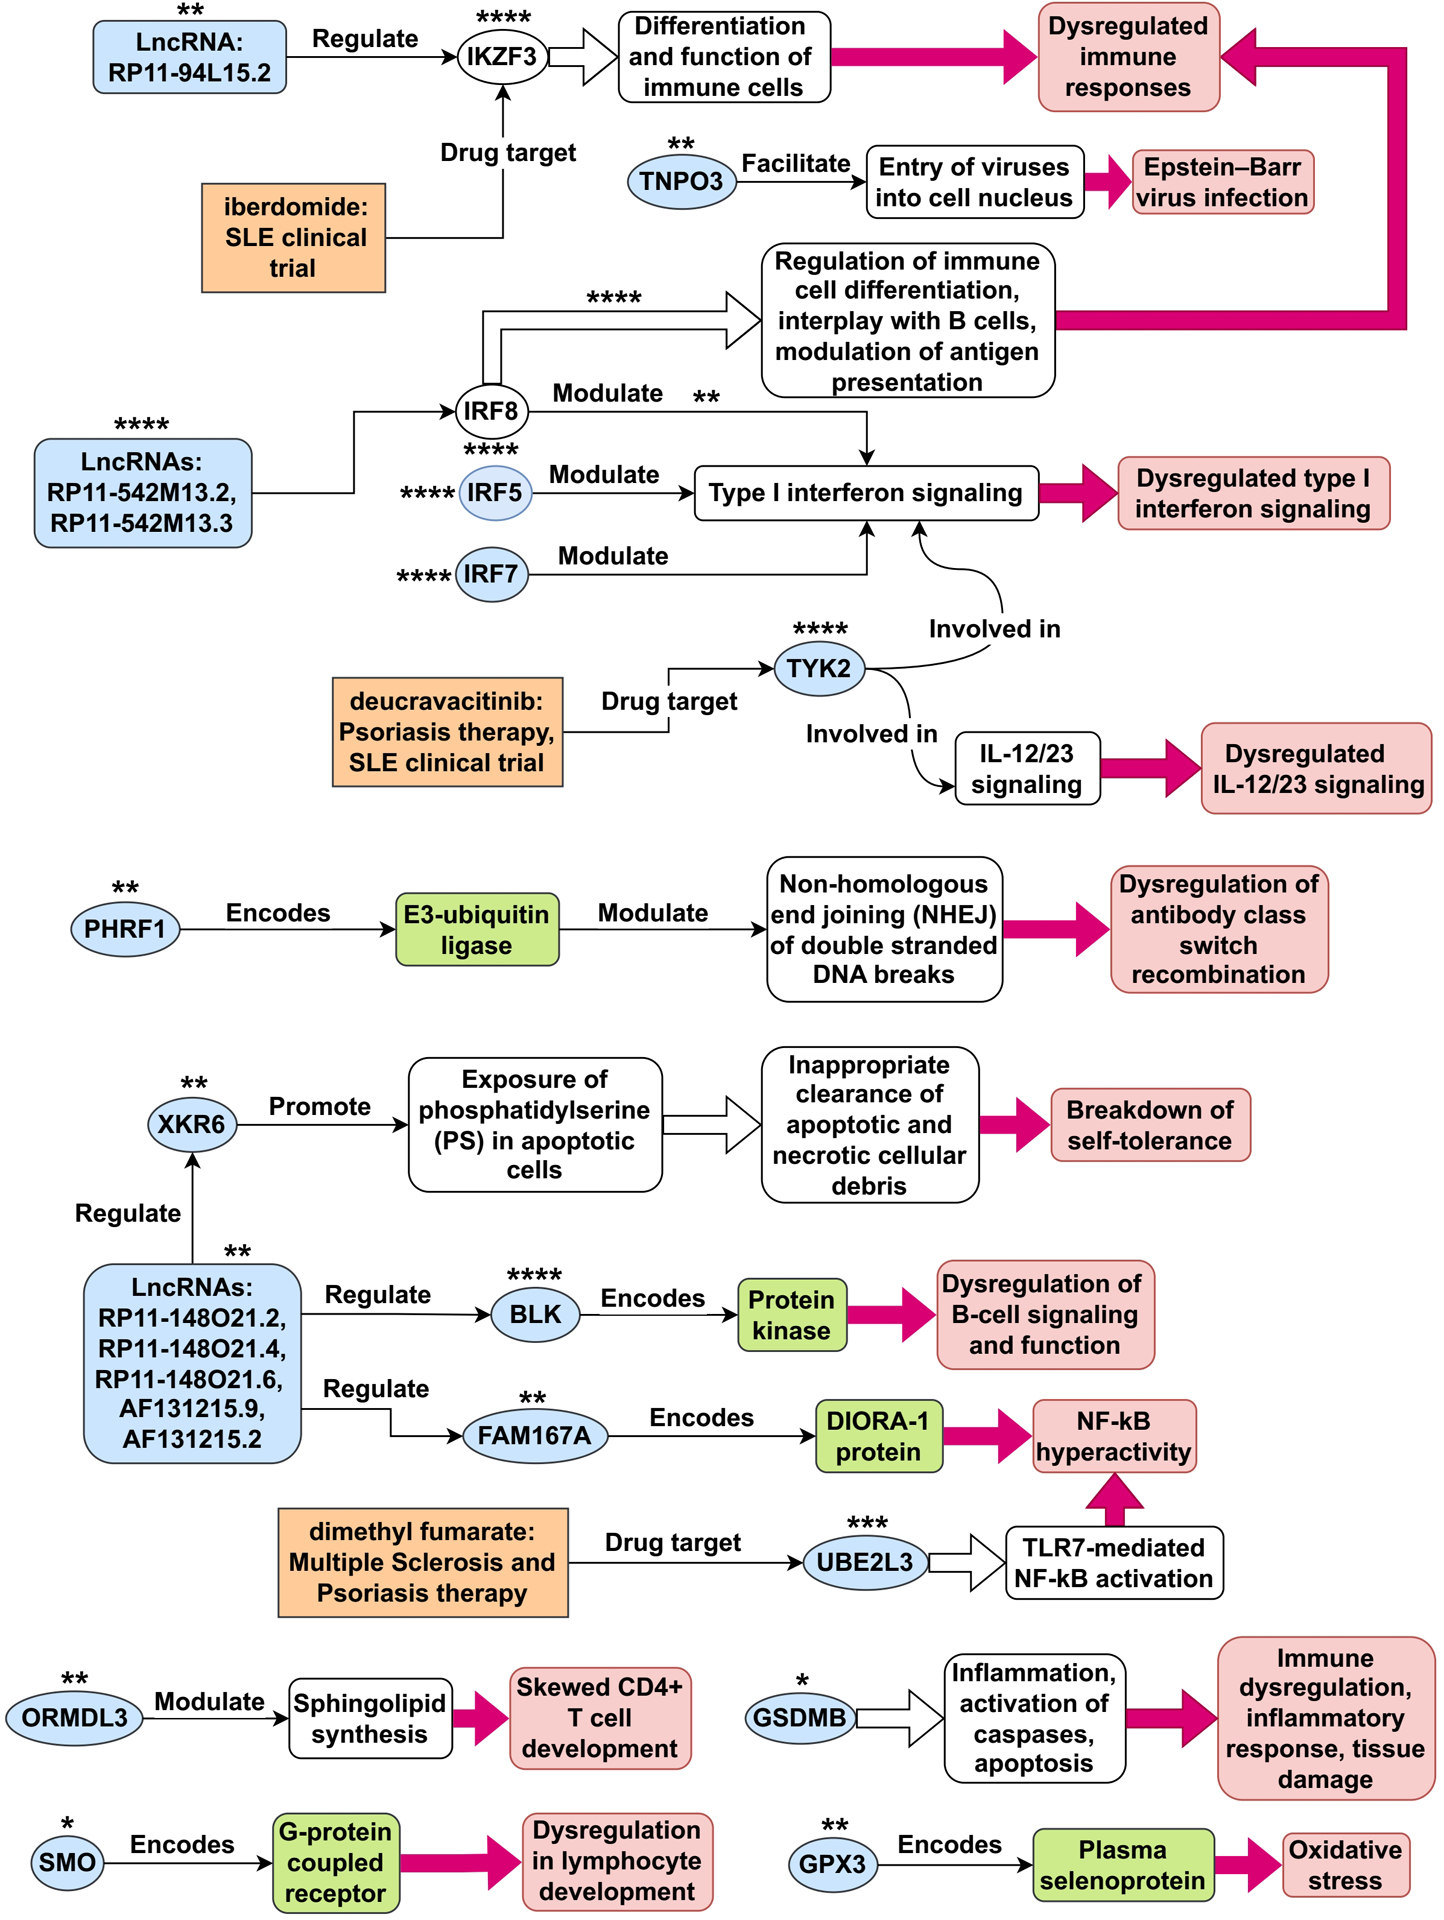
Results: The initial MR analysis identified 142 genes, including 43 outside of chromosome 6. Subsequently, applying the advanced MR methods reduced the number of genes with significant causal effects on SLE to 66. PMR-Egger, MRAID, and MR-MtRobin, respectively, identified 13, 7, and 16 non-chromosome 6 genes with significant causal effects. All methods identified expression of PHRF1 gene as causal for SLE. A comprehensive literature review was conducted to enhance understanding of the functional roles and mechanisms of the identified genes in SLE development.

Conclusions: The findings from the three MR methods exhibited overlapping genes with causal effects on SLE, demonstrating consistent results. However, each method also uncovered unique genes due to different modelling assumptions and technical factors, highlighting the complementary nature of the approaches. Importantly, MRAID demonstrated a reduced percentage of causal genes from the Major Histocompatibility complex (MHC) region on chromosome 6, indicating its potential in minimizing false positive findings. This study contributes to unraveling the mechanisms underlying SLE by employing advanced probabilistic MR methods to identify causal genes, thereby enhancing our understanding of SLE pathogenesis.

Keywords: GWAS; Mendelian Randomization (MR); PHRF1; causal inference; eQTL; gene expression; genetics; systemic lupus erythematosus (SLE).


Figures

FIGURE 1.
FIGURE 1.
A schematic of the classical Mendelian Randomization (MR) method. (A) A graphical model of classical MR. The directed acyclic graph represents the probabilistic dependencies of the random variables shown. The goal of the MR method is to estimate the causal effect α of Exposure X on the Outcome (trait Y), using marginal effect sizes from the Exposure and Outcome GWAS (see Materials and Methods for details). Horizontal pleiotropy (green dotted arrows) occurs when the genetic variant has an effect on Outcome/disease outside of its effect on the Exposure X. There are two types of horizontal pleiotropy: uncorrelated pleiotropy, where effects of genetic variants G on Y are uncorrelated with effects of G on X, and correlated pleiotropy, where effects of genetic variants G on Y (directed path G→C→Y) are correlated with effects of G on X (directed path G→C→X). (B) If the Instrumental Variable (IV) assumptions hold, and the linear relation between the variables in the model is assumed, MR method can unbiasedly estimate the causal effect size as the ratio of G-on-Y to G-on-X effect sizes. When one or more of the IV assumptions are violated, such as when correlated and/or uncorrelated horizontal pleiotropic effects are present, the naïve estimate α=β^y/β^x is biased. The second IV assumption, ‘G is marginally independent of C’, can be mathematically described as follows. Panel A’s graphical model corresponds a joint probability distribution P(G, C, X, Y) of four random variables. Summing over all possible outcomes of X and Y produces a marginal probability distribution of G and C: P(G, C) = ∑X,Y P(G, C, X, Y). If the marginal distribution factorizes as P(G, C) = P(G)P(C), then G and C are said to be marginally independent. Similarly, the third IV assumption, ‘G and Y are independent given X and C, can be understood as a factorization of the conditional probability distribution: P(G, Y|X, C) = P(G|X, C)P(Y|X, C).
FIGURE 2.
FIGURE 2.
Manhattan Plot of SMR-significant genes. Named are the 43 non-chromosome 6 and 3 chromosome 6 genes whose expression has statistically significant causal effect on SLE according to the single-SNP SMR method, which presupposes that the Instrumental Variable (IV) assumptions hold (see Figure 1B). The dotted horizontal line is at the nominal causal effect p-value threshold of 0.05/531 (Bonferroni correction for 531 multiple statistical tests). Only 3 important genes from chromosome 6 are labeled, and the rest are not labeled to avoid clutter. The genes’ order on the chromosome is maintained, but their location is not shown to scale for clarity.
FIGURE 3.
FIGURE 3.
A description of the PMR-Egger method. (A) A graphical representation of the statistical model. The model is used to estimate the causal effect α of gene expression X on the trait Y of interest, in the presence of the uncorrelated horizontal pleiotropic effect γ. Correlated pleiotropic effects are assumed to be absent. For each j = 1, …, p, the random variable βj represents the effect size of genetic variant (cis-SNP) Gj on the gene expression X and is assumed to follow the normal distribution with mean zero and the variance σβ2. These random variables are assumed to be independent of each other. (B) The matrix equations representing the mixed-effects statistical model from panel A. For example, the first equation states that the vector β^x of marginal effect sizes of p cis-SNPs on exposure variable X (gene expression) is equal to the matrix-product of matrix R (SNP-SNP genotype correlation matrix) and the vector β of effect sizes of the p cis-SNPs on exposure X, plus a noise vector. The matrix and vectors in the equations are emphasized in boldface. (C) A detailed description of some variables in the equations from the panel B. Column vectors of dimension p are represented as a transpose (‘T’) of row vectors. The noise terms εx and εy follow the multivariate normal distributions with mean zero and covariance matrix Rσx2 and Rσy2, respectively, where R is the SNP-SNP genotype correlation matrix.
FIGURE 4.
FIGURE 4.
A comparison of PMR-Egger and SMR causal effect sizes. A scatter plot depicting SLE causal effect sizes of non-chromosome 6 genes which are statistically significant according to the probabilistic MR method (PMR-Egger). The signs of the causal effect sizes estimated using two methods agree. The PMR-Egger method models the uncorrelated horizontal pleiotropic effects, but assumes that the correlated horizontal pleiotropy is absent.
FIGURE 5.
FIGURE 5.
A description of the MRAID method. (A) A graphical representation of the statistical model. The model is used to estimate the causal effect α of gene expression X on the trait Y of interest, in the presence of the uncorrelated and correlated horizontal pleiotropic effects. In this mixed-effects model, the variables α and ρ are fixed effects, and the other variables are random effects. (B) The random effect variables in the model follow mixture probability distributions. For instance, with the probability πβ, the random variable βj follows a normal distribution and is identically equal to zero with the probability 1 − πβ. In the latter case, the genetic variant Gj does not directly affect the gene expression X, but has a direct uncorrelated pleiotropic effect ηju on the outcome Y. With the probability 1 − πc, the random variable Zjc is equal to zero, which results in the vanishing correlated horizontal pleiotropy random variable ηjc. When Zjc=0, the effect size of genetic variant (cis-SNP) Gj on the gene expression X is non-zero and is equal to βj. (C) The matrix equations representing the mixed-effects statistical model from panel A. The equation for β^x is formally identical to the corresponding equation from the PMR-Egger method (see Figure 3B). In the linear equation for β^y, the first three terms on the right-hand side are of the form: matrix R times a vector random variable. Thus, the variables are a priori not distinguishable. However, thanks to assumptions on distributions of the random variables (see panels A and B), the variables are distinguishable and the method can infer the parameters of the probability distributions. (D) A heuristic derivation of mixed-model equations from panel C when all SNPs are in linkage equilibrium. In the latter case, SNPs are uncorrelated and the SNP-SNP genotype correlation matrix R becomes the identity matrix, and R can then be erased from the equations. The right-hand side of equation for β^x can be understood as follows. In the graph from panel A, there are two directed paths from Gj to X: GCX and GX. The value of β^x is the sum of the contributions from these two paths and the noise term. The value of the directed path GCX is the product of the values of the directed paths GC and CX. Similarly, the value of β^y is the sum of the contributions from the directed paths GCY, GCXY, GXY and GY, and the noise term. The equations in the general case of correlated SNPs can be understood as R-weighted contributions to marginal effect size of a SNP from the tagged SNPs which are in LD.
FIGURE 6.
FIGURE 6.
A comparison of MRAID and SMR causal effect sizes. A scatter plot depicting SLE causal effect sizes of non-chromosome 6 genes which are statistically significant according the MRAID method. The MRAID method models both uncorrelated and correlated horizontal pleiotropic effects. The signs of the causal effect sizes estimated using two methods agree.
FIGURE 7.
FIGURE 7.
A description of MR-MtRobin method. (A) An illustrative plot depicting a weighted linear regression of cell type-specific eQTL effect sizes β^x against the effect sizes β^y from the trait Y GWAS. Artificially generated data points for three SNPs in four cell types are shown. The error bars represent standard errors of effect sizes from the cell type-specific eQTL summary statistics data. The effect sizes of SNP-1 eQTL are statistically significant in four cell types, while those of SNP-2 and SNP-3 are significant in three cell types only. Each vertical cluster of data points corresponds to a single SNP. A blue line connecting the origin with a point in a vertical cluster for each SNP represents a statistical fit of the weighted linear regression model described in the panel B, with the estimated SNP-specific slope parameter equal to θ + θk for SNP-k. For each SNP, the data points with smaller eQTL effect size standard errors receive larger weights (the end points of the blue lines are closer to such data points). The red dotted line with the slope θ, which is the reciprocal 1/α of the X-on-Y causal effect size α, represents an overall linear relationship between β^x and β^y. (B) The mixed-effects linear model. In the linear relationship between cell type-specific eQTL effect sizes β^x and GWAS effect sizes β^y, θ is a fixed effect and θj are SNP-specific random effects. The noise term εjm in the equation is cell type specific and depends on the structure of SNP-SNP genotype correlations. Specifically, for the cell type m, the vector εm follows a multivariate normal distribution with mean zero and the covariance matrix whose elements are the products of eQTL standard errors in cell type m and SNP genotype correlation matrix elements.
FIGURE 8.
FIGURE 8.
MR-MtRobin weighted linear regression analysis for the causal effect of BLK gene expression on SLE. For a description of the model, see Figure 7 and Materials and Methods. A scatter plot of SLE GWAS versus cell type-specific eQTL effect sizes of cis-SNPs in the neighborhood of BLK gene. Each colored circle represents a SNP in a particular cell type (see color to cell type dictionary on the right), with the size of the circle being proportional to the weight 1/σ^jm2, where σ^jm is the standard error of the estimate for eQTL effect size of the SNP j in the cell type m (see Figure 7) – the more accurate the estimate is, the larger the weight is. The weights are largest for LCL eQTLs due to the larger sample size (n = 445) of the LCL eQTL study. The slope of the black line through origin represents the fixed effect θ of the model (see Figure 7).
FIGURE 9.
FIGURE 9.
A SNP-centric view of MR-MtRobin analysis for the causal effect of BLK gene expression on SLE. To ensure clarity, only a selection of the top GWAS SNPs is depicted.
FIGURE 10.
FIGURE 10.
A comparison of MR-MtRobin and SMR causal effect sizes. A scatter plot depicting SLE causal effect sizes of non-chromosome 6 genes which are statistically significant according the MR-MtRobin method applied to the DICE and LCL eQTL data. This method implicitly models both uncorrelated and correlated horizontal pleiotropic effects. The signs of the causal effect sizes estimated using two methods agree for all but four genes.
FIGURE 11.
FIGURE 11.
Reversal of causal effect direction estimates by MR-MtRobin due to cell type-specific eQTL effects and unbalanced eQTL sample sizes. MR-MtRobin weighted linear regression analysis for the causal effects of expressions of four genes on SLE. For a description of the model, see Figure 7 and Materials and Methods, and for a description of the scatter plots, see Figure 8 legend. The largest contribution to the causal effect size α estimate is from the LCL cell line (data points shown in red color) due to the larger sample size (n = 445) of the LCL eQTL data compared to the smaller sample sizes (n = 90) of eQTL data for other cell types. The slope of red line for each gene represents the reciprocal of causal effect size (1/α) estimate with LCL cell line data included in the MR-MtRobin analysis, while the blue dashed line shows the same with LCL data excluded from the analysis. (A) For PHRF1 gene, the data points for LCL (red circles) are aligned along the red line with a positive slope. The data points for other cell types are more consistent with the negative slope blue dashed line. The MR-MtRobin causal effect sizes of PHRF1 with and without LCL eQTL data included in the MR-MtRobin analysis are α = 3.5 and α = −0.5, respectively (see Supplementary Table S1). (B-D) Scatter plots for IRF5, GPX3 and RP11–542M13 genes, respectively.
FIGURE 12.
FIGURE 12.
Venn diagram comparison of statistically significant causal genes identified by MR-MtRobin method using two different sets of eQTL data: DICE + LCL (with LCL) and DICE alone (without LCL). (A) Genes from outside of chromosome 6. (B) Genes from chromosome 6.
FIGURE 13.
FIGURE 13.
Venn diagrams of statistically significant causal genes identified by MRAID, PMR-Egger and MR-MtRobin (the latter with DICE + LCL eQTL data) methods. (A) Genes from outside of chromosome 6. (B) Genes from chromosome 6.
FIGURE 14.
FIGURE 14.
Tentative SLE disease mechanisms for genes identified in this study. This figure illustrates potential disease mechanisms associated with systemic lupus erythematosus (SLE) genes. The light-blue shapes represent 21 of the 23 non-chromosome 6 genes identified as plausible causes in this study. Depending on the context within the figure, these shapes can also represent gene products, such as proteins and mRNAs. The unfilled ovals represent the SLE genes IKZF3 and IRF8, which were not identified in this study. The number of asterisks next to each gene shape indicates the overall level of confidence in the evidence supporting its disease mechanism, ranging from 1 star (*) for the least confident evidence to 4 stars (****) for the most confident evidence. For IRF8, there are two pathways associated with it, and the number of asterisks shown above each pathway represents the confidence level in the evidence supporting that particular pathway.

Similar articles

Cited by

References

    1. Afrasiabi A, Keane JT, Ong LTC, Alinejad-Rokny H, Fewings NL, Booth DR, Parnell GP, Swaminathan S, 2022. Genetic and transcriptomic analyses support a switch to lytic phase in Epstein Barr virus infection as an important driver in developing Systemic Lupus Erythematosus. J. Autoimmun 127, 102781. 10.1016/j.jaut.2021.102781 - DOI - PubMed
    1. Allman PH, Aban I, Long DM, Bridges SL, Srinivasasainagendra V, MacKenzie T, Cutter G, Tiwari HK, 2021. A novel Mendelian randomization method with binary risk factor and outcome. Genet. Epidemiol 45, 549–560. 10.1002/gepi.22387 - DOI - PubMed
    1. Arvanitis M, Tayeb K, Strober BJ, Battle A, 2022. Redefining tissue specificity of genetic regulation of gene expression in the presence of allelic heterogeneity. Am. J. Hum. Genet 109, 223–239. 10.1016/j.ajhg.2022.01.002 - DOI - PMC - PubMed
    1. Bentham J, Morris DL, Graham DSC, Pinder CL, Tombleson P, Behrens TW, Martín J, Fairfax BP, Knight JC, Chen L, Replogle J, Syvänen A-C, Rönnblom L, Graham RR, Wither JE, Rioux JD, Alarcón-Riquelme ME, Vyse TJ, 2015. Genetic association analyses implicate aberrant regulation of innate and adaptive immunity genes in the pathogenesis of systemic lupus erythematosus. Nat. Genet 47, 1457–1464. 10.1038/ng.3434 - DOI - PMC - PubMed
    1. Bhargava A, Lahaye X, Manel N, 2018. Let me in: Control of HIV nuclear entry at the nuclear envelope. Cytokine Growth Factor Rev. 40, 59–67. 10.1016/j.cytogfr.2018.02.006 - DOI - PubMed

LinkOut - more resources