. 2023 Oct;13(10):4202-4216.
doi: 10.1016/j.apsb.2023.08.002. Epub 2023 Aug 7.

Gut microbiota controls the development of chronic pancreatitis: A critical role of short-chain fatty acids-producing Gram-positive bacteria

Affiliations

Gut microbiota controls the development of chronic pancreatitis: A critical role of short-chain fatty acids-producing Gram-positive bacteria

Li-Long Pan et al. Acta Pharm Sin B. 2023 Oct.

Abstract

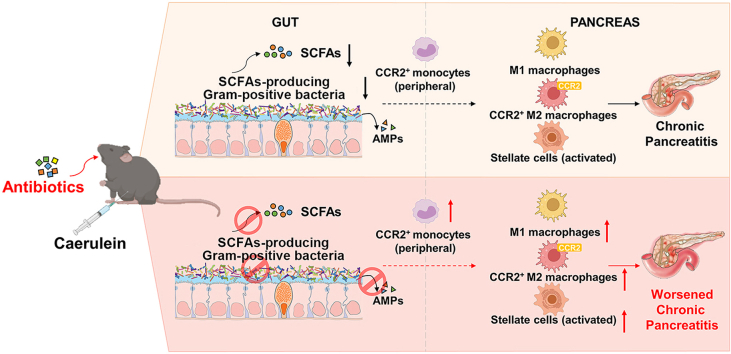
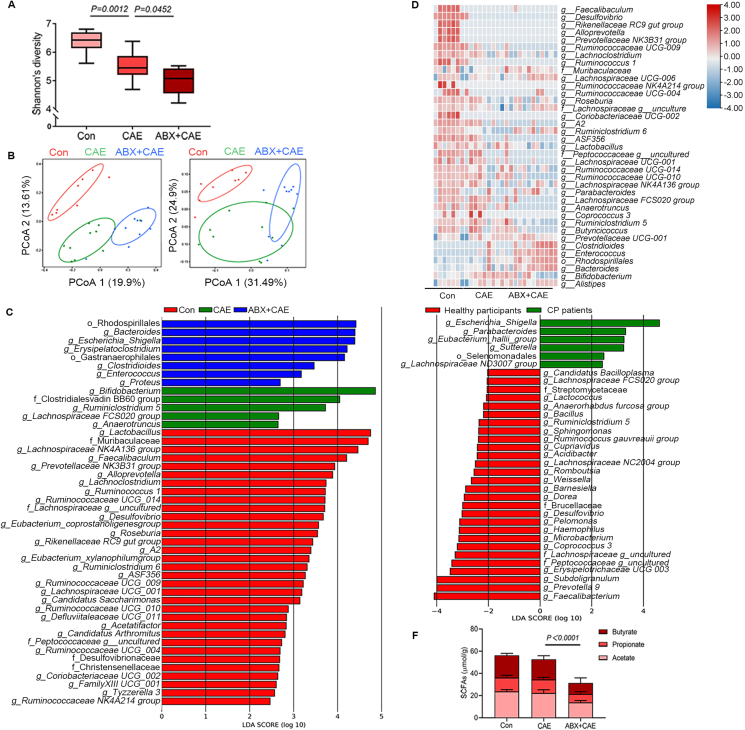
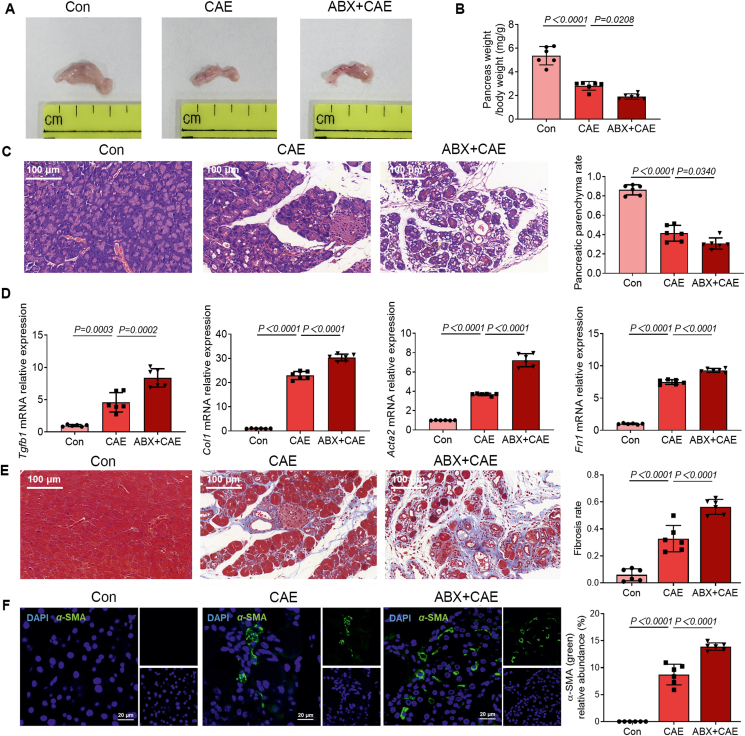
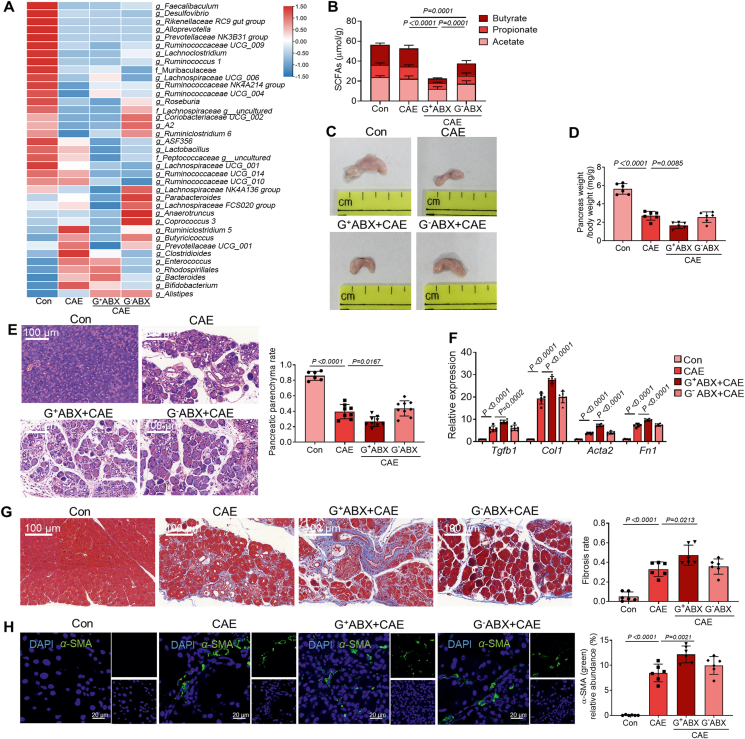
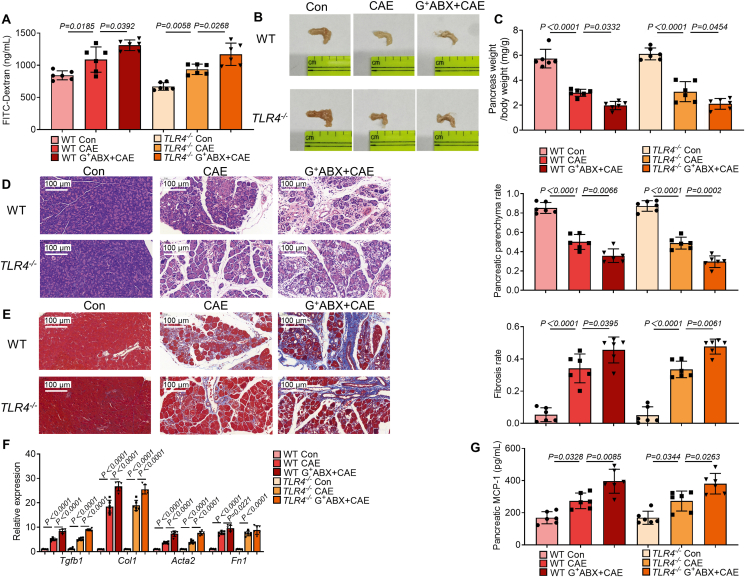
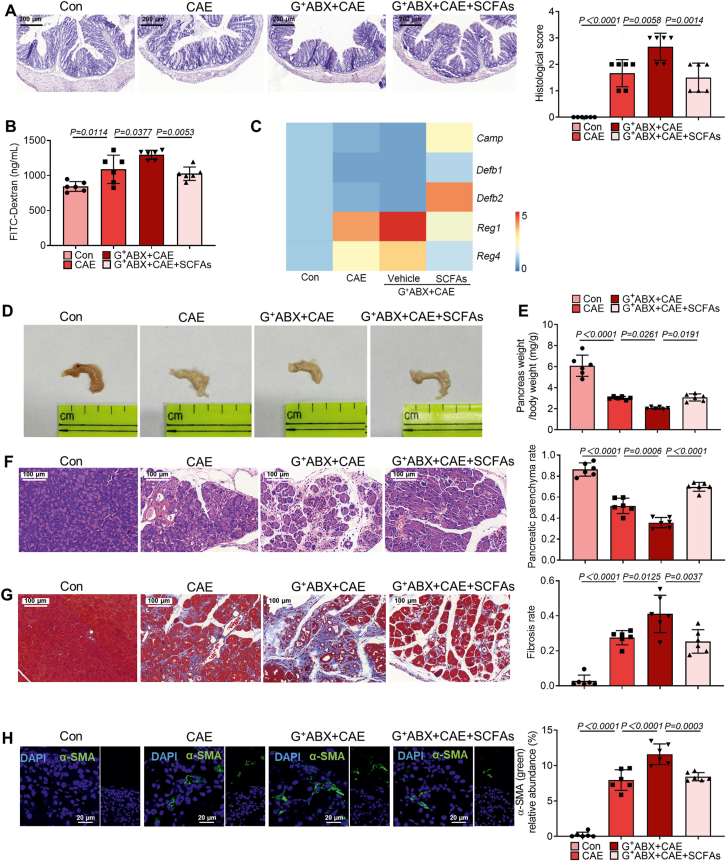
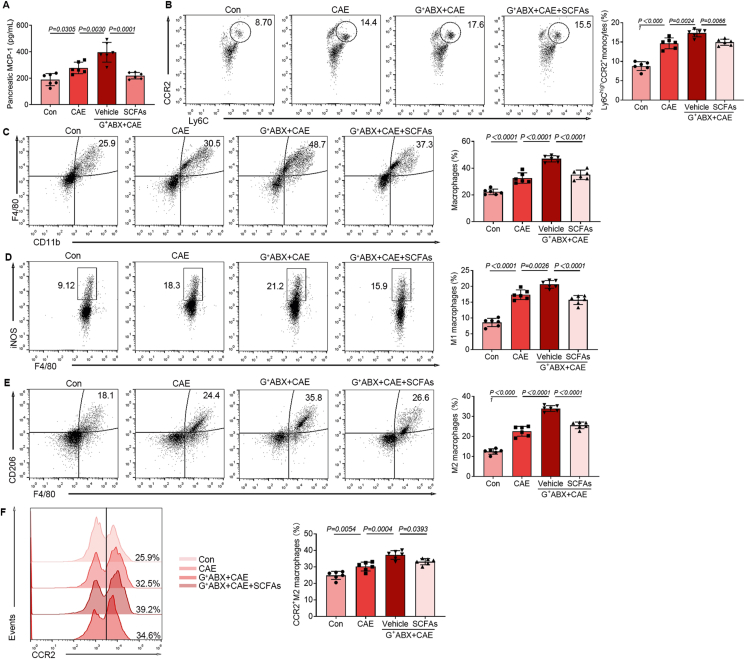
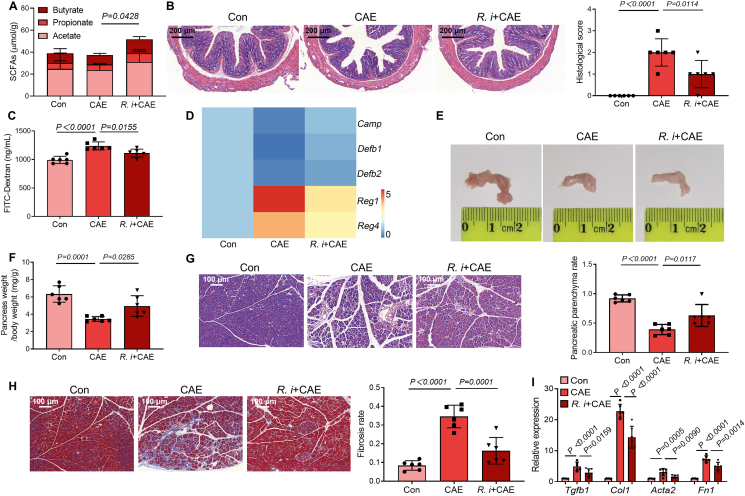
Chronic pancreatitis (CP) is a progressive and irreversible fibroinflammatory disorder, accompanied by pancreatic exocrine insufficiency and dysregulated gut microbiota. Recently, accumulating evidence has supported a correlation between gut dysbiosis and CP development. However, whether gut microbiota dysbiosis contributes to CP pathogenesis remains unclear. Herein, an experimental CP was induced by repeated high-dose caerulein injections. The broad-spectrum antibiotics (ABX) and ABX targeting Gram-positive (G+) or Gram-negative bacteria (G-) were applied to explore the specific roles of these bacteria. Gut dysbiosis was observed in both mice and in CP patients, which was accompanied by a sharply reduced abundance for short-chain fatty acids (SCFAs)-producers, especially G+ bacteria. Broad-spectrum ABX exacerbated the severity of CP, as evidenced by aggravated pancreatic fibrosis and gut dysbiosis, especially the depletion of SCFAs-producing G+ bacteria. Additionally, depletion of SCFAs-producing G+ bacteria rather than G- bacteria intensified CP progression independent of TLR4, which was attenuated by supplementation with exogenous SCFAs. Finally, SCFAs modulated pancreatic fibrosis through inhibition of macrophage infiltration and M2 phenotype switching. The study supports a critical role for SCFAs-producing G+ bacteria in CP. Therefore, modulation of dietary-derived SCFAs or G+ SCFAs-producing bacteria may be considered a novel interventive approach for the management of CP.

Keywords: Antibiotic exposure; Chronic pancreatitis; Gut microbiota; Macrophage responses; Pancreatic fibrogenesis; Roseburia intestinalis; Short-chain fatty acids-producing bacteria; Toll-like receptor 4.


Conflict of interest statement

The authors declare no conflicts of interest.

Figures

Image 1
Graphical abstract
Figure 1
Figure 1
A broad-spectrum antibiotic (ABX) cocktail intensifies gut dysbiosis and reduction of short-chain fatty acids (SCFAs)-producing bacteria in chronic pancreatitis (CP). (A) The diversity shown by Shannon's index (Con, n = 8; CAE, n = 10; ABX + CAE, n = 10). (B) Principal coordinates analysis comparing the microbiome composition in colon content of mice (Con, n = 8; CAE, n = 10; ABX + CAE, n = 10; left: unweighted, right: weighted). (C) The LEfSe analyses of microbiome composition (based on abundance) distribution of three groups of mice, histogram of the LDA scores reveals the most differentially abundant taxa among different treatments (Con, n = 8; CAE, n = 10; ABX + CAE, n = 10). (D) Heatmap representation of SCFAs-producing bacteria (based on absolute count) in three groups of mice (Con, n = 8; CAE, n = 10; ABX + CAE, n = 10). (E) The LEfSe analyses of microbiome composition distribution of healthy participants and CP patients (healthy participants, n = 69; CP patients, n = 71). (F) The levels of SCFAs (acetate, propionate and butyrate) in colon content (n = 6). Data (A) were representative and were the min to the max from three independent experiments. Data (F) are representative and were the mean ± standard deviation (SD) from three independent experiments. P values were calculated by one-way analysis of variance (ANOVA) followed by Tukey's post hoc test for multiple comparisons.
Figure 2
Figure 2
A ABX cocktail aggravates CP. (A) The representative macrographic images of the pancreas. (B) The ratio of pancreatic weight and body weight (n = 6). (C) The representative images and parenchyma rates of the pancreas by hematoxylin and eosin (H&E) staining (n = 6). Scale bar: 100 μm. (D) The fibrosis-associated gene (Tgfb1, Col1, Acta2 and Fn1) expression in the pancreas (n = 6). (E) The representative images and fibrosis rates of the pancreas by Masson's Trichrome staining (n = 6). Scale bar: 100 μm. (F) Localization and expression of α-smooth muscle actin (α-SMA) (green) in the pancreas by immunofluorescent staining (n = 6). Representative photomicrographs of individual and merged staining were shown. Nuclei were stained with 4′,6-diamidino-2-phenylindole (DAPI) (blue). Scale bar: 20 μm. Data (B–F) are representative and were the mean ± SD from three independent experiments. P values were calculated by one-way ANOVA followed by Tukey's post hoc test for multiple comparisons.
Figure 3
Figure 3
Depletion of Gram-positive bacteria causes decreased abundances of SCFAs-producing Gram-positive bacteria and intensifies CP. (A) Heatmap representation of SCFAs-producing bacteria in four groups of mice. (Con, n = 8; CAE, n = 10; G+ ABX+CAE, n = 10; G ABX + CAE, n = 10). (B) SCFA concentrations (acetate, propionate and butyrate) in colon content (n = 6). (C) The representative macrographic images of the pancreas. (D) The ratio of pancreatic weight and body weight (n = 6). (E) The representative images and parenchyma rates of the pancreas by H&E staining (n = 6). Scale bar: 100 μm. (F) The fibrosis-associated gene (Tgfb1, Col1, Acta2 and Fn1) expression in the pancreas (n = 6). (G) The representative images and fibrosis rates of the pancreas by Masson's Trichrome staining (n = 6). Scale bar: 100 μm. (H) Localization and expression of α-SMA (green) in the pancreas by immunofluorescent staining (n = 6). Representative photomicrographs of individual and merged staining were shown. Nuclei were stained with DAPI (blue). Scale bar: 20 μm. Data (B, D–H) were representative and were the mean ± SD from three independent experiments. P values were calculated by one-way ANOVA followed by Tukey's post hoc test for multiple comparisons.
Figure 4
Figure 4
Toll-like receptor 4 (TLR4) deficiency does not influence the severity of CP. (A) Intestinal permeability was assessed by measuring fluorescein isothiocyanate (FITC)-dextran (n = 6). (B) The representative macrographic images of the pancreas. (C) The ratio of pancreatic weight and body weight (n = 6). (D) The representative images and parenchyma rates of the pancreas by H&E staining (n = 6). Scale bar: 100 μm. (E) The representative images and fibrosis rates of the pancreas by Masson's Trichrome staining as indicated by collagen-rich scars (blue color) (n = 6). Scale bar: 100 μm. (F) The fibrosis-associated gene (Tgfb1, Col1, Acta2 and Fn1) expression in the pancreas (n = 6). (G) The monocyte chemoattractant protein-1 (MCP-1) levels in the pancreas (n = 6). Data (A, C–G) are representative and were the mean ± SD from three independent experiments. P values were calculated by one-way ANOVA followed by Tukey's post hoc test for multiple comparisons.
Figure 5
Figure 5
SCFAs mitigate the intensified effects of the depletion of Gram-positive bacteria on CP. (A) The representative images and histological scores of the colon by H&E staining (n = 6). Scale bar: 200 μm. (B) Intestinal permeability assessment by measuring FITC-dextran (n = 6). (C) The mRNA expression of antimicrobial peptides (Camp, Defb1, Defb2, Reg1 and Reg4, n = 6). (D, E) The representative macroscopic images of the pancreas (D) and the ratio of pancreatic weight and body weight (E) (n = 6). (F) The representative images and parenchyma rates of the pancreas by H&E staining (n = 6). Scale bar: 100 μm. (G) The representative images and fibrosis rates of the pancreas by Masson's Trichrome staining (n = 6). Scale bar: 100 μm. (H) Localization and expression of α-SMA (green) in the pancreas by immunofluorescent staining (n = 6). Representative photomicrographs of individual and merged staining were shown. Nuclei were stained with DAPI (blue). Scale bar: 20 μm. Data are representative and were the mean ± SD from three independent experiments. P values were calculated by one-way ANOVA followed by Tukey's post hoc test for multiple comparisons.
Figure 6
Figure 6
SCFAs alleviate monocyte recruitment and pancreatic macrophage deregulation in mice with CP. (A) The MCP-1 levels in the pancreas (n = 6). (B) The frequency of Ly6Chi C–C Motif chemokine receptor 2 (CCR2)+ monocytes among CD45+CD11b+ population (n = 6). (C) The frequency of CD11b+F4/80+ macrophages among CD45+ population (n = 6). (D) The frequency of inducible nitric oxide synthase (iNOS)+ M1 macrophages among CD45+CD11b+F4/80+ population (n = 6). (E) The frequency of F4/80+CD206+ M2 macrophages among CD45+CD11b+ population (n = 6). (F) The frequency of CCR2+ M2 macrophages among CD45+CD11b+ F4/80+CD206+ population (n = 6). Data (A) are representative and were the mean ± SD from three independent experiments. Data (B–F) were representative and were the median ± interquartile range from three independent experiments. P values were calculated by one-way ANOVA followed by Tukey's post hoc test for multiple comparisons.
Figure 7
Figure 7
Oral treatment with a specific G+ SCFAs-producer Roseburia intestinalis (R. intestinalis) attenuates the severity of CP. (A) The levels of SCFAs (acetate, propionate and butyrate) in colon content (n = 6). (B) The representative images and histological scores of the colon by H&E staining (n = 6). Scale bar: 200 μm. (C) Intestinal permeability assessment by measuring FITC-dextran (n = 6). (D) The mRNA expression of antimicrobial peptides (Camp, Defb1, Defb2, Reg1 and Reg4, n = 6). (E, F) The representative macroscopic images of the pancreas (E) and the ratio of pancreatic weight and body weight (F) (n = 6). (G) The representative images and parenchyma rates of the pancreas by H&E staining (n = 6). Scale bar: 100 μm. (H) The representative images and fibrosis rates of the pancreas by Masson's Trichrome staining (n = 6). Scale bar: 100 μm. (I) The mRNA expression of markers relevant to pancreatic fibrosis (n = 6). Data (A–D and F–I) are representative and were the mean ± SD from three independent experiments. P values were calculated by one-way ANOVA followed by Tukey's post hoc test for multiple comparisons.

References

    1. Beyer G., Habtezion A., Werner J., Lerch M.M., Mayerle J. Chronic pancreatitis. Lancet. 2020;396:499–512. - PubMed
    1. Kleeff J., Whitcomb D.C., Shimosegawa T., Esposito I., Lerch M.M., Gress T., et al. Chronic pancreatitis. Nat Rev Dis Prim. 2017;3 - PubMed
    1. Tamura K., Yu J., Hata T., Suenaga M., Shindo K., Abe T., et al. Mutations in the pancreatic secretory enzymes CPA1 and CPB1 are associated with pancreatic cancer. Proc Natl Acad Sci U S A. 2018;115:4767–4772. - PMC - PubMed
    1. Capurso G., Signoretti M., Archibugi L., Stigliano S., Fave G.D. Systematic review and meta-analysis: small intestinal bacterial overgrowth in chronic pancreatitis. United European Gastroenterol J. 2016;4:697–705. - PMC - PubMed
    1. Hm N.C., Bashir Y., Dobson M., Ryan B.M., Duggan S.N., Conlon K.C. The prevalence of small intestinal bacterial overgrowth in non-surgical patients with chronic pancreatitis and pancreatic exocrine insufficiency (PEI) Pancreatology. 2018;18:379–385. - PubMed

LinkOut - more resources