

Heat in Germany: Health risks and preventive measures
- PMID: 37799534
- PMCID: PMC10548487
- DOI: 10.25646/11651
Heat in Germany: Health risks and preventive measures
Abstract
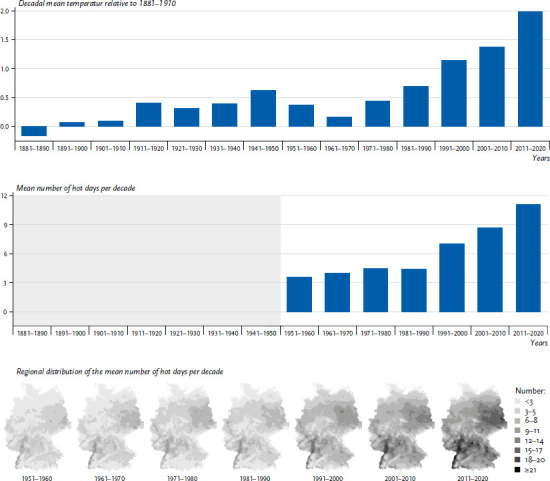
Background: Climate change has already led to a significant temperature increase in Germany. The average temperature in the past decade was approximately 2°C above the pre-industrial level and eight of the ten hottest summers since the beginning of systematic weather records in 1881 were recorded in the last 30 years.
Methods: Based on a selective literature search and authors' own results, the article summarises the current state of knowledge on heat and its health impacts for Germany, addresses adaptation measures, and gives an outlook on implementation and research questions.
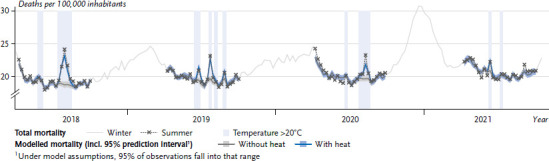
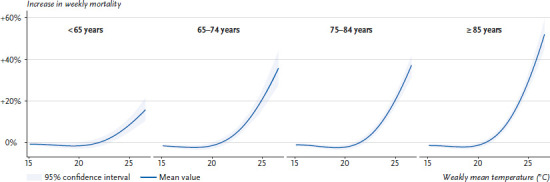
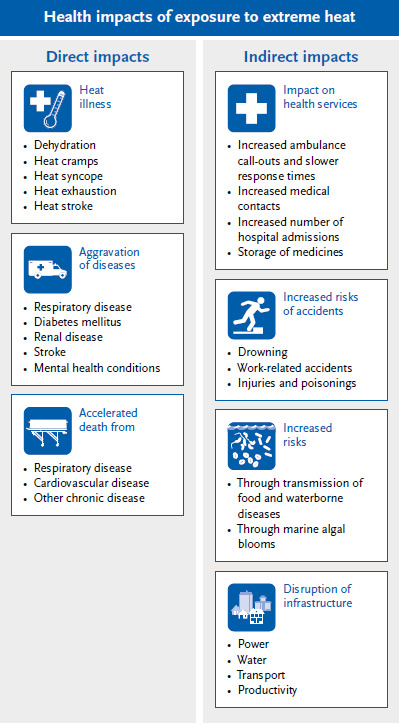
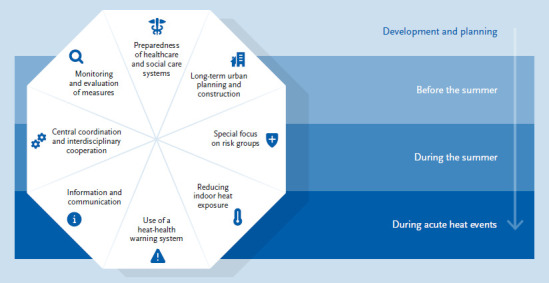
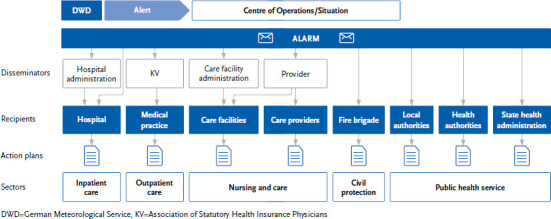
Results: Heat can aggravate pre-existing conditions such as diseases of the cardiovascular system, the respiratory tract, or the kidneys and trigger potentially harmful side effects for numerous medications. A significant increase in mortality is regularly observed during heat events. Previous approaches to mitigate the health impact of high temperatures include, for example, the heat alerts of the German Meteorological Service and recommendations for the preparation of heat-health action plans.
Conclusions: Evidence on health impacts of heat and awareness of the need for heat-related health protection have grown in recent years, but there is still a need for further action and research.
Keywords: HEALTH PROTECTION; HEAT EVENTS; HEAT-HEALTH ACTION PLAN; MORBIDITY; MORTALITY; PREVENTION; VULNERABILITY.
© Robert Koch Institute. All rights reserved unless explicitly granted.
Conflict of interest statement
Conflicts of interest The authors declared no conflicts of interest.
Figures
Similar articles
-
[Relevance of Heat Health Actions Plans for Preventive Public Health in Germany].Gesundheitswesen. 2018 Apr;80(4):e34-e43. doi: 10.1055/s-0043-107874. Epub 2017 Jun 7. Gesundheitswesen. 2018. PMID: 28591871 German.
-
Heat Extremes, Public Health Impacts, and Adaptation Policy in Germany.Int J Environ Res Public Health. 2020 Oct 27;17(21):7862. doi: 10.3390/ijerph17217862. Int J Environ Res Public Health. 2020. PMID: 33121004 Free PMC article.
-
[Health protection against heat extremes in Germany: What has been done in federal states and municipalities?].Bundesgesundheitsblatt Gesundheitsforschung Gesundheitsschutz. 2020 Aug;63(8):1013-1019. doi: 10.1007/s00103-020-03189-6. Bundesgesundheitsblatt Gesundheitsforschung Gesundheitsschutz. 2020. PMID: 32632725 Review. German.
-
An open source web application for the surveillance and prevention of the impacts on public health of extreme meteorological events: the SUPREME system.Int J Health Geogr. 2011 May 25;10:39. doi: 10.1186/1476-072X-10-39. Int J Health Geogr. 2011. PMID: 21612652 Free PMC article.
-
Heat exposure and cardiovascular health outcomes: a systematic review and meta-analysis.Lancet Planet Health. 2022 Jun;6(6):e484-e495. doi: 10.1016/S2542-5196(22)00117-6. Lancet Planet Health. 2022. PMID: 35709806
Cited by
-
Climate change and health equity: A public health perspective on climate justice.J Health Monit. 2023 Nov 29;8(Suppl 6):3-35. doi: 10.25646/11772. eCollection 2023 Nov. J Health Monit. 2023. PMID: 38105794 Free PMC article.
-
The role of the public health service in the implementation of heat health action plans for climate change adaptation in Germany: A qualitative study.Health Res Policy Syst. 2024 Dec 5;22(1):161. doi: 10.1186/s12961-024-01231-6. Health Res Policy Syst. 2024. PMID: 39639289 Free PMC article.
-
Climate change and public health in Germany - A synthesis of options for action from the German status report on climate change and health 2023.J Health Monit. 2023 Nov 29;8(Suppl 6):57-85. doi: 10.25646/11774. eCollection 2023 Nov. J Health Monit. 2023. PMID: 38105793 Free PMC article.
-
[Health and climate change-what is the potential of real-world data?].Bundesgesundheitsblatt Gesundheitsforschung Gesundheitsschutz. 2024 Feb;67(2):155-163. doi: 10.1007/s00103-023-03828-8. Epub 2024 Jan 19. Bundesgesundheitsblatt Gesundheitsforschung Gesundheitsschutz. 2024. PMID: 38240844 Free PMC article. Review. German.
-
Climate change and public health in Germany - An introduction to the German status report on climate change and health 2023.J Health Monit. 2023 Jun 1;8(Suppl 3):6-32. doi: 10.25646/11400. eCollection 2023 Jun. J Health Monit. 2023. PMID: 37342432 Free PMC article.
References
-
- Butsch C, Beckers LM, Nilson E, et al. . (2023) Health impacts of extreme weather events – Cascading risks in a changing climate. J Health Monit 8(S4):33–56. www.rki.de/jhealthmonit-en (As at 06.09.2023) - PMC - PubMed
-
- Masson-Delmotte V, Zhai P, Pirani A, et al. . (Eds) (2021) Climate change 2021: The physical science basis. Contribution of working group I to the sixth assessment report of the Intergovernmental Panel on Climate Change (IPCC). IPCC, Cambridge. www.ipcc.ch/report/ar6/wg1/chapter/chapter-6 (As at 20.06.2023)
-
- Russo S, Sillmann J, Fischer EM. (2015) Top ten European heatwaves since 1950 and their occurrence in the coming decades. Environ Res Lett 10(12):124003
-
- Becker FN, Fink AH, Bissolli P, et al. . (2022) Towards a more comprehensive assessment of the intensity of historical European heat waves (1979–2019). Atmos Sci Lett 23:e1120
LinkOut - more resources
Full Text Sources
Miscellaneous