. 2023 Sep 20:14:1236315.
doi: 10.3389/fpls.2023.1236315. eCollection 2023.

Full-length transcriptome analysis revealed that 2,4-dichlorophenoxyacetic acid promoted in vitro bulblet initiation in lily by affecting carbohydrate metabolism and auxin signaling

Affiliations

Full-length transcriptome analysis revealed that 2,4-dichlorophenoxyacetic acid promoted in vitro bulblet initiation in lily by affecting carbohydrate metabolism and auxin signaling

Cong Gao et al. Front Plant Sci. .

Abstract

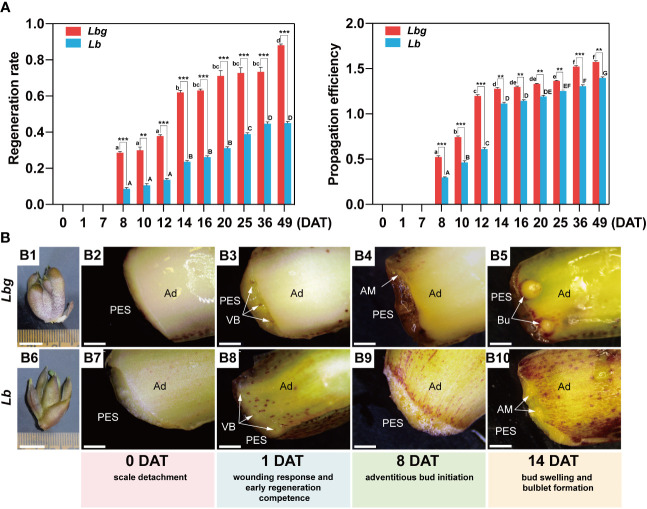
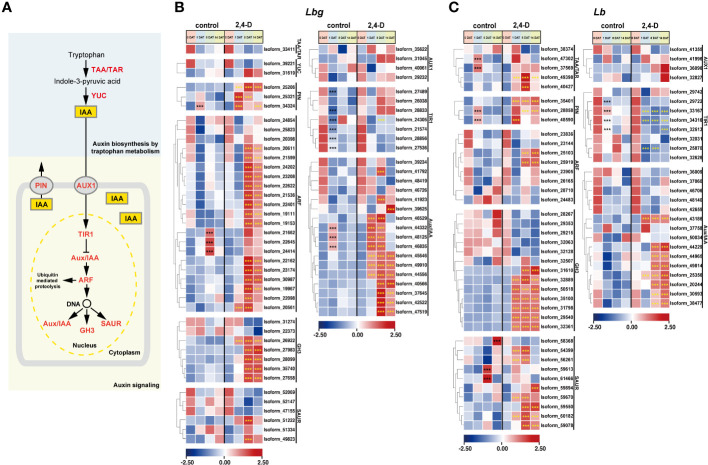
Bulblet initiation, including adventitious bud initiation and bulblet formation, is a crucial process for lily and other bulbous flowers that are commercially propagated by vegetative means. Here, by a hybrid strategy combining Pacific Biosciences (PacBio) full-length sequencing and Illumina RNA sequencing (RNA-seq), high-quality transcripts of L. brownii (Lb) and its variety, L. brownii var. giganteum (Lbg), during in vitro bulblet initiation were obtained. A total of 53,576 and 65,050 high-quality non-redundant full-length transcripts of Lbg and Lb were generated, respectively. Morphological observation showed that Lbg possessed a stronger capacity to generate bulblets in vitro than Lb, and 1 mg L-1 2,4-dichlorophenoxyacetic acid (2,4-D) significantly increased bulblet regeneration rate in two lilies. Screening of differentially expressed transcripts (DETs) between different stages and Mfuzz analysis showed 0 DAT to 1 DAT was the crucial stage with the most complex transcriptional change, with carbohydrate metabolism pathway was significantly enriched. In addition, 6,218 and 8,965 DETs were screened between the 2,4-D-treated group and the control group in Lbg and Lb, respectively. 2,4-D application had evident effects on the expression of genes involved in auxin signaling pathway, such as TIRs, ARFs, Aux/IAAs, GH3s and SAURs. Then, we compared the expression profiles of crucial genes of carbohydrate metabolism between different stages and different treatments. SUSs, SUTs, TPSs, AGPLs, GBSSs and SSs showed significant responses during bulblet initiation. The expression of CWINs, SUTs and SWEETs were significantly upregulated by 2,4-D in two lilies. In addition, 2,4-D increased the expression of starch degradation genes (AMYs and BAMs) and inhibited starch synthesis genes (AGPLs, GBSSs and SSs). SBEs were significantly upregulated in Lbg but not in Lb. Significant co-expression was showed between genes involved in carbohydrate metabolism and auxin signaling, together with transcription factors such as bHLHs, MYBs, ERFs and C3Hs. This study indicates the coordinate regulation of bulblet initiation by carbohydrate metabolism and auxin signaling, serving as a basis for further studies on the molecular mechanism of bulblet initiation in lily and other bulbous flowers.

Keywords: Lilium; auxin signaling; full-length sequencing; starch synthesis and degradation; sucrose unloading.


Conflict of interest statement

The authors declare that the research was conducted in the absence of any commercial or financial relationships that could be construed as a potential conflict of interest.

Figures

Figure 1
Figure 1
Morphological observation during in vitro bulblet initiation in Lbg and Lb. (A) Regeneration rate and propagation efficiency during in vitro bulblet initiation. Regeneration rate, number of scales that produced adventitious buds/total number of scales. Propagation efficiency, total number of produced buds/total number of scales. Lowercase and uppercase letters represent significant differences (p < 0.001) for relevant parameters within Lbg and Lb, respectively. Asterisks indicate significant differences for relevant parameters between Lbg and Lb (**Differences significant at p < 0.01; ***Differences significant at p < 0.001). Representative data were supported by three biological replicates containing 120 repeats each. (B) In vitro bulb of which scales were used for bulblet induction (B1, B6) and key stages during bulblet initiation in Lbg (B2-B5) and Lb (B7-B10). PES, proximal end of scale; Ad, adaxial side of scale; VB, vascular bundle; AM, adventitious meristem; Bu, bulblet. The white arrows represent vascular bundles (B3 and B4), adventitious meristems (B4 and B10) or bulblets (B9). Bars, 1 cm (B1, B6) and 1 mm (B2-B5, B7-B10).
Figure 2
Figure 2
Reference transcripts generation of lily samples. (A) Workflow of lily sample sequencing. (B) Distribution of the length of reference transcripts. (C) Functional annotation of reference transcripts by Pfam, KEGG, GO and Nr databases. (D) Principal component analysis (PCA) plot of the samples. T1 and T2 represent samples of the control group and 2,4-D-treated group, respectively. D0, D1, D8 and D14 represent samples of 0 DAT, 1 DAT, 8 DAT and 14 DAT, respectively. The letters (a-c) represent three biological replicates.
Figure 3
Figure 3
Stage-specific DETs screening and Mfuzz analysis of reference transcripts. (A, B) Number of DETs (|log2-fold changes| ≥ 2) identified between different stages in Lbg (A) and Lb (B). (C, D) Stage-specific DETs were classified into eight clusters of Lbg (C) and ten clusters of Lb (D) through Mfuzz analysis. (E, F) Bubble charts of KEGG pathway enrichment analysis of each cluster in Lbg (E) and Lb (F).
Figure 4
Figure 4
2,4-D-related DETs screening between the control group and 1 mg L-1 2,4-D-treated group of reference transcripts. (A) Regeneration rate of the control group and 2,4-D-treated group during in vitro bulblet initiation. Regeneration rate = number of scales that produced adventitious buds/total number of scales. ***Differences significant at p < 0.001. (B) Number of DETs (|log2-fold changes| ≥ 2) identified between the control group and 2,4-D-treated group. (C) Bubble charts of KEGG pathway enrichment analysis of 2,4-D-related DETs.
Figure 5
Figure 5
Expression patterns of stage-specific and 2,4-D related DETs involved in pathways of auxin biosynthesis and signaling. (A) Pathway of indole-3-acetic acid (IAA) biosynthesis and signaling. TAA, tryptophan aminotransferase; TAR, tryptophan aminotransferase related; YUC, YUC family; PIN, PIN-formed protein family; AUX1, AUX1/LAX symporters; TIR1, transporter inhibitor response 1, Aux/IAA, indole-3-acetic acid inducible; ARF, auxin response factor; GH3, GH3 family; SAUR, small auxin upregulated RNA. (B, C) Expression patterns of DETs involved in auxin biosynthesis and signaling in Lbg (B) and Lb (C). ***Differences significant at p < 0.001. The black asterisk represents a significant difference compared to 0 DAT in the control group. The yellow asterisk represents a significant difference in the 2,4-D-treated group compared to the control group at the same stage.
Figure 6
Figure 6
Expression patterns of stage-specific and 2,4-D related DETs involved in sucrose and starch metabolism pathway. (A) Sucrose and starch metabolism pathway. SE/CC, sieve element/companion cell complex; PD, plasmodesma; Suc, sucrose; Glu, glucose; Fru, fructose; Tre, trehalose; Mal, maltose; UDP-Glu, UDP-glucose; F6P, fructose-6-phosphate; G6P, glucose-6-phosphate; G1P, glucose-1-phosphate; ADP-Glu, ADP-Glucose; SWEET, SWEET sucrose-efflux transporter family; SUT, sucrose transporter; SUS, sucrose synthase; CWIN, cell wall invertase; VIN, vacuolar invertase; INH, invertase inhibitor; CIN, cytoplasmic invertase; TPP, trehalose 6-phosphate phosphatase; TPS, trehalose 6-phosphate synthase; AGPL/AGPS, large/small subunit of ADP-glucose pyrophosphorylase (AGPase); GBSS, granule-bound starch synthase; SS, starch synthase; SBE; starch branching enzyme; DBE, starch debranching enzyme; AMY, amylase, BAM, β-amylase. (B, C) Expression patterns of DETs involved in sucrose and starch metabolism in Lbg (B) and Lb (C). ***Differences significant at p < 0.001. The black asterisk represents a significant difference compared to 0 DAT in the control group. The yellow asterisk represents a significant difference in the 2,4-D-treated group compared to the control group at the same stage.
Figure 7
Figure 7
(A) TF families identified from the stage-specific DETs. (B) TF families identified from the 2,4-D-related DETs. The TF families in (A) and (B) rank according to the number of differentially expressed TFs they contained. (C) Express patterns of differentially expressed TFs belonging to MYB, bHLH, ERF, GRAS and C3H families in Lbg. (D) Express patterns of differentially expressed TFs belonging to MYB, bHLH, WRKY, C3H and ERF families in Lb. (E, F) Correlation analysis of DETs involved in auxin signaling and carbohydrate metabolism, and differentially expressed TFs in Lbg (E) and Lb (F). The correlation analysis was conducted with Pearson’s two-tailed test. DETs with significant correlations (|r| ≥ 0.8. r, Pearson correlation coefficient) were linked. stering analysis of reference transcripts of Lbg (A) and Lb (B).

Similar articles

Cited by

References

    1. Bakhshaie M., Khosravi S., Azadi P., Bagheri H., van Tuyl J. M. (2016). Biotechnological advances in lilium . Plant Cell Rep. 35 (9), 1799–1826. doi: 10.1007/s00299-016-2017-8 - DOI - PubMed
    1. Bourque J. E., Miller J. C., Park W. D. (1987). Use of an in vitro tuberization system to study tuber protein gene expression. In Vitro Cell. Dev. Biol. 23 (5), 381–386. doi: 10.1007/BF02620996 - DOI - PubMed
    1. Cantalapiedra C. P., Hernández-Plaza A., Letunic I., Bork P., Huerta-Cepas J. (2021). EggNOG-mapper v2: Functional Annotation, Orthology Assignments, and Domain Prediction at the Metagenomic Scale. Mol. Biol. Evol. 38 (12), 5825–5829. doi: 10.1093/molbev/msab293 - DOI - PMC - PubMed
    1. Chapman E. J., Estelle M. (2009). Mechanism of auxin-regulated gene expression in plants. Annu. Rev. Genet. 43 (1), 265–285. doi: 10.1146/annurev-genet-102108-134148 - DOI - PubMed
    1. Chen T., Zhang H., Liu Y., Liu Y. X. (2021). EVenn: Easy to create repeatable and editable Venn diagrams and Venn networks online. J. Genet. Genomics 48 (9), 863–866. doi: 10.1016/j.jgg.2021.07.007 - DOI - PubMed

LinkOut - more resources