

Comparison of click-capable oxaliplatin and cisplatin derivatives to better understand Pt(ii)-induced nucleolar stress
- PMID: 37799581
- PMCID: PMC10549245
- DOI: 10.1039/d3cb00055a
Comparison of click-capable oxaliplatin and cisplatin derivatives to better understand Pt(ii)-induced nucleolar stress
Abstract
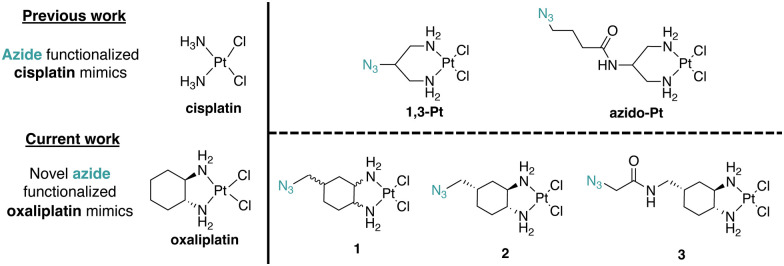
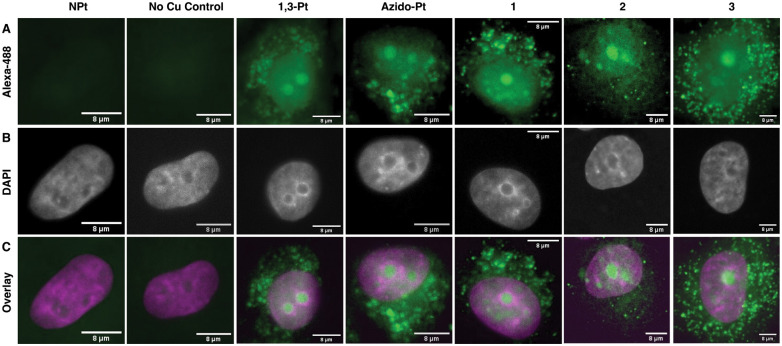
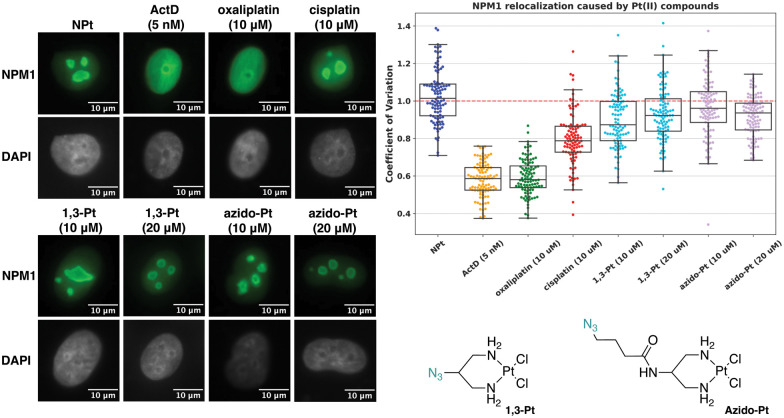
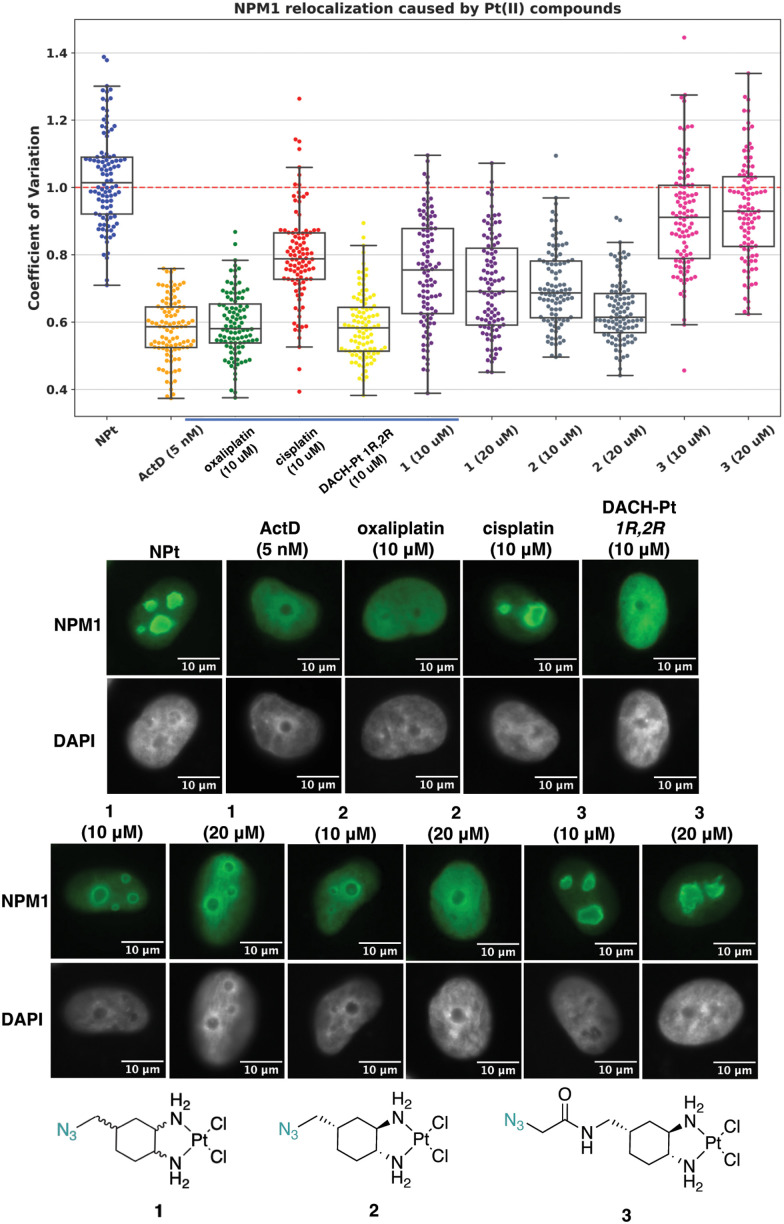
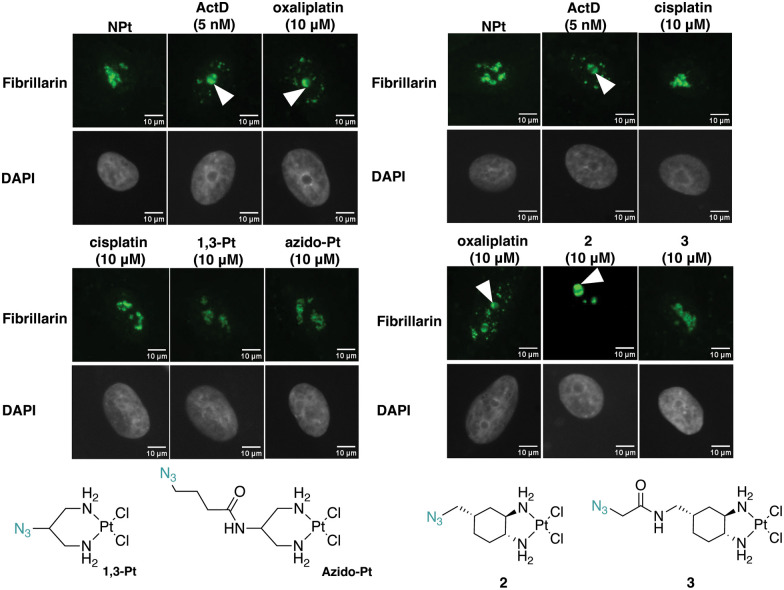
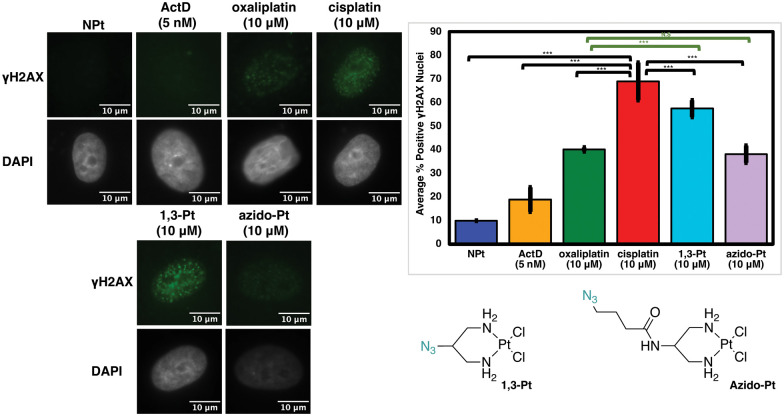
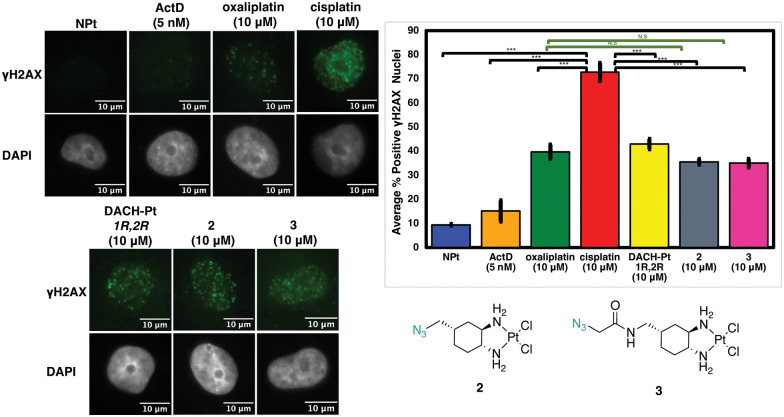
Pt(ii) chemotherapeutic complexes have been used as predominant anticancer drugs for nearly fifty years. Currently there are three FDA-approved chemotherapeutic Pt(ii) complexes: cisplatin, carboplatin, and oxaliplatin. Until recently, it was believed that all three complexes induced cellular apoptosis through the DNA damage response pathway. Studies within the last decade, however, suggest that oxaliplatin may instead induce cell death through a unique nucleolar stress pathway. Pt(ii)-induced nucleolar stress is not well understood and further investigation of this pathway may provide both basic knowledge about nucleolar stress as well as insight for more tunable Pt(ii) chemotherapeutics. Through a previous structure-function analysis, it was determined that nucleolar stress induction is highly sensitive to modifications at the 4-position of the 1,2-diaminocyclohexane (DACH) ring of oxaliplatin. Specifically, more flexible and less rigid substituents (methyl, ethyl, propyl) induce nucleolar stress, while more rigid and bulkier substituents (isopropyl, acetamide) do not. These findings suggest that a click-capable functional group can be installed at the 4-position of the DACH ring while still inducing nucleolar stress. Herein, we report novel click-capable azide-modified oxaliplatin mimics that cause nucleolar stress. Through NPM1 relocalization, fibrillarin redistribution, and γH2AX studies, key differences have been identified between previously studied click-capable cisplatin mimics and these novel click-capable oxaliplatin mimics. These complexes provide new tools to identify cellular targets and localization through post-treatment Cu-catalyzed azide-alkyne cycloaddition and may help to better understand Pt(ii)-induced nucleolar stress. To our knowledge, these are the first reported oxaliplatin mimics to include an azide handle, and cis-[(1R,2R,4S) 4-methylazido-1,2-cyclohexanediamine]dichlorido platinum(ii) is the first azide-functionalized oxaliplatin derivative to induce nucleolar stress.
This journal is © The Royal Society of Chemistry.
Conflict of interest statement
There are no conflicts to declare.
Figures
Similar articles
-
Click-Capable Phenanthriplatin Derivatives as Tools to Study Pt(II)-Induced Nucleolar Stress.ACS Chem Biol. 2024 Apr 19;19(4):875-885. doi: 10.1021/acschembio.3c00607. Epub 2024 Mar 14. ACS Chem Biol. 2024. PMID: 38483263 Free PMC article.
-
Influence of Ring Modifications on Nucleolar Stress Caused by Oxaliplatin-Like Compounds.Chembiochem. 2022 Jul 19;23(14):e202200130. doi: 10.1002/cbic.202200130. Epub 2022 Jun 7. Chembiochem. 2022. PMID: 35475312
-
Time-Dependent Studies of Oxaliplatin and Other Nucleolar Stress-Inducing Pt(II) Derivatives.ACS Chem Biol. 2022 Aug 19;17(8):2262-2271. doi: 10.1021/acschembio.2c00399. Epub 2022 Aug 2. ACS Chem Biol. 2022. PMID: 35917257
-
Advancements in the Use of Platinum Complexes as Anticancer Agents.Anticancer Agents Med Chem. 2022;22(5):821-835. doi: 10.2174/1871520621666210805150705. Anticancer Agents Med Chem. 2022. PMID: 34353272 Review.
-
Will the Interactions of Some Platinum (II)-Based Drugs with B-Vitamins Reduce Their Therapeutic Effect in Cancer Patients? Comparison of Chemotherapeutic Agents such as Cisplatin, Carboplatin and Oxaliplatin-A Review.Int J Mol Sci. 2023 Jan 12;24(2):1548. doi: 10.3390/ijms24021548. Int J Mol Sci. 2023. PMID: 36675064 Free PMC article. Review.
Cited by
-
Inhibition of nucleolar transcription by oxaliplatin involves ATM/ATR kinase signaling.Cell Chem Biol. 2023 Aug 17;30(8):906-919.e4. doi: 10.1016/j.chembiol.2023.06.010. Epub 2023 Jul 10. Cell Chem Biol. 2023. PMID: 37433295 Free PMC article.
-
Multi-Pathway Study for Oxaliplatin Resistance Reduction.Curr Issues Mol Biol. 2025 Mar 4;47(3):172. doi: 10.3390/cimb47030172. Curr Issues Mol Biol. 2025. PMID: 40136426 Free PMC article. Review.
-
Functions of the native NPM1 protein and its leukemic mutant.Leukemia. 2025 Feb;39(2):276-290. doi: 10.1038/s41375-024-02476-4. Epub 2024 Dec 17. Leukemia. 2025. PMID: 39690184 Review.
-
The unique Pt(II)-induced nucleolar stress response and its deviation from DNA damage response pathways.J Biol Chem. 2024 Nov;300(11):107858. doi: 10.1016/j.jbc.2024.107858. Epub 2024 Oct 5. J Biol Chem. 2024. PMID: 39374783 Free PMC article.
-
Click-Capable Phenanthriplatin Derivatives as Tools to Study Pt(II)-Induced Nucleolar Stress.ACS Chem Biol. 2024 Apr 19;19(4):875-885. doi: 10.1021/acschembio.3c00607. Epub 2024 Mar 14. ACS Chem Biol. 2024. PMID: 38483263 Free PMC article.
References
-
- Kauffman G. B. Platinum Met. Rev. 2010;54:250–256. doi: 10.1595/147106710X534326. - DOI
LinkOut - more resources
Full Text Sources