

Widefield wavefront sensor for multidirectional peripheral retinal scanning
- PMID: 37799675
- PMCID: PMC10549753
- DOI: 10.1364/BOE.491412
Widefield wavefront sensor for multidirectional peripheral retinal scanning
Abstract
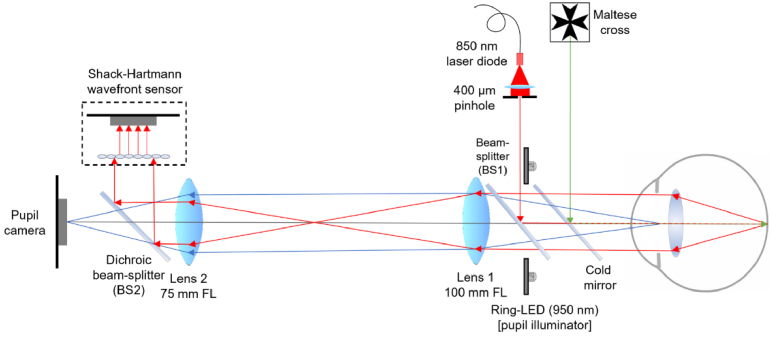
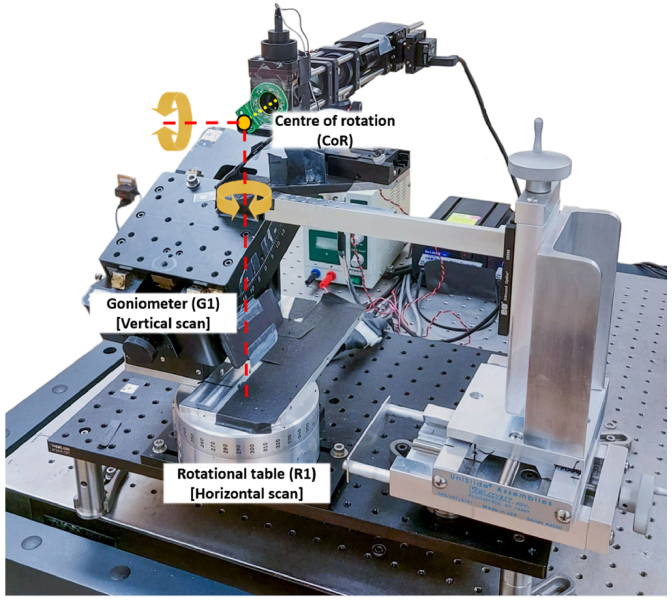
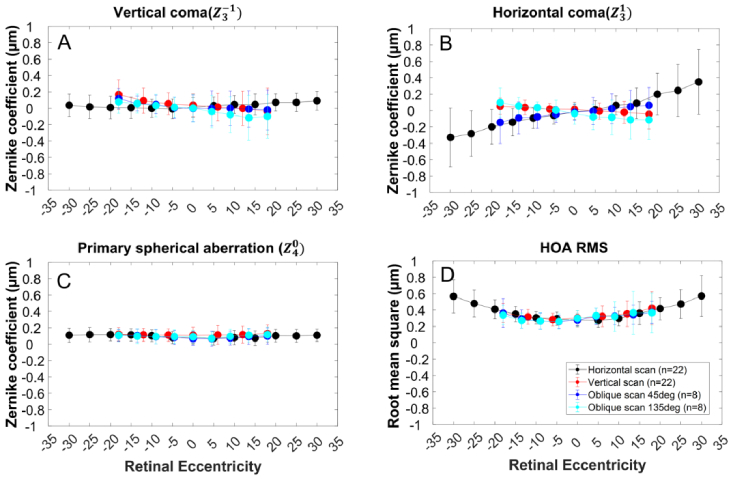
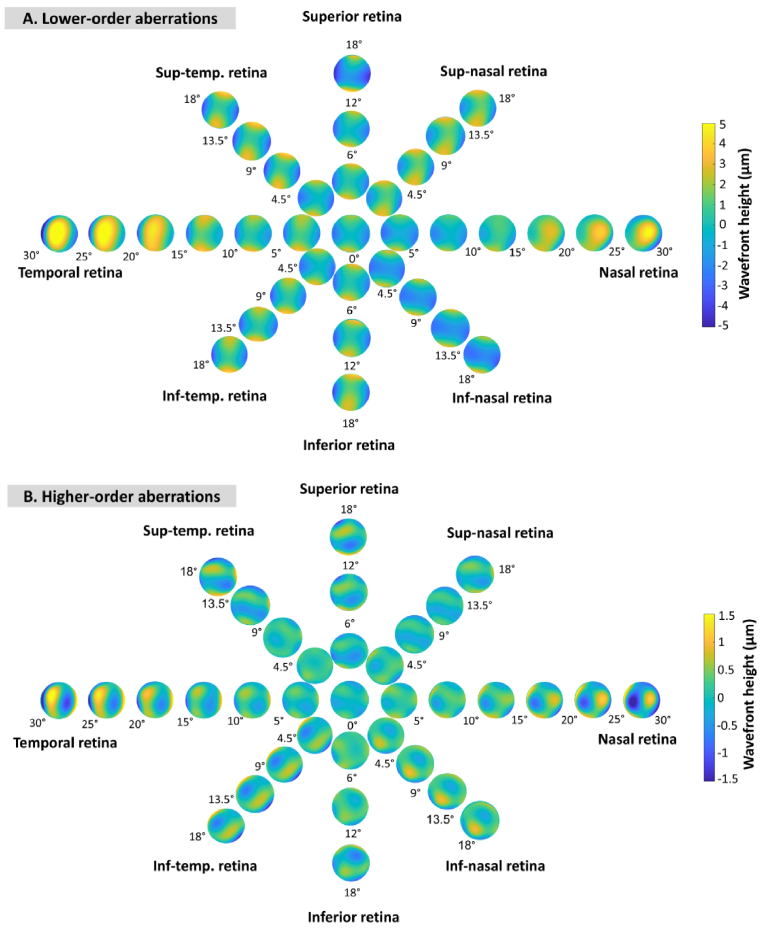
The quantitative evaluation of peripheral ocular optics is essential in both myopia research and the investigation of visual performance in people with normal and compromised central vision. We have developed a widefield scanning wavefront sensor (WSWS) capable of multidirectional scanning while maintaining natural central fixation at the primary gaze. This Shack-Hartmann-based WSWS scans along any retinal meridian by using a unique scanning method that involves the concurrent operation of a motorized rotary stage (horizontal scan) and a goniometer (vertical scan). To showcase the capability of the WSWS, we tested scanning along four meridians including a 60° horizontal, 36° vertical, and two 36° diagonal scans, each completed within a time frame of 5 seconds.
© 2023 Optica Publishing Group under the terms of the Optica Open Access Publishing Agreement.
Conflict of interest statement
The authors declare no conflicts of interest.
Figures
Similar articles
-
Differences in retinal shape between East Asian and Caucasian eyes.Ophthalmic Physiol Opt. 2017 May;37(3):275-283. doi: 10.1111/opo.12359. Epub 2017 Mar 29. Ophthalmic Physiol Opt. 2017. PMID: 28370187
-
Asymmetric Peripheral Refraction Profile in Myopes along the Horizontal Meridian.Optom Vis Sci. 2022 Apr 1;99(4):350-357. doi: 10.1097/OPX.0000000000001890. Optom Vis Sci. 2022. PMID: 35383734
-
Effect of Correcting Peripheral Refractive Errors on Retinal Sensitivity in Younger and Older Healthy Adults.Optom Vis Sci. 2023 Apr 1;100(4):248-254. doi: 10.1097/OPX.0000000000002005. Epub 2023 Feb 27. Optom Vis Sci. 2023. PMID: 37098138 Free PMC article.
-
[Quantitative assessment of quality of vision].Nippon Ganka Gakkai Zasshi. 2004 Dec;108(12):770-807; discussion 808. Nippon Ganka Gakkai Zasshi. 2004. PMID: 15656087 Review. Japanese.
-
Advanced Optical Wavefront Technologies to Improve Patient Quality of Vision and Meet Clinical Requests.Polymers (Basel). 2022 Dec 5;14(23):5321. doi: 10.3390/polym14235321. Polymers (Basel). 2022. PMID: 36501713 Free PMC article. Review.
Cited by
-
Ultra-wide-angle peripheral refraction using a laser-scanning instrument.Biomed Opt Express. 2024 Oct 24;15(11):6486-6498. doi: 10.1364/BOE.540051. eCollection 2024 Nov 1. Biomed Opt Express. 2024. PMID: 39553882 Free PMC article.
-
Quantifying monochromatic and polychromatic optical blur anisotropy in the periphery of myopes and emmetropes using a radial asymmetry metric.Front Med (Lausanne). 2025 Feb 10;12:1496210. doi: 10.3389/fmed.2025.1496210. eCollection 2025. Front Med (Lausanne). 2025. PMID: 39995693 Free PMC article.
-
Chromatic cues for the sign of defocus in the peripheral retina.Biomed Opt Express. 2024 Aug 8;15(9):5098-5114. doi: 10.1364/BOE.537268. eCollection 2024 Sep 1. Biomed Opt Express. 2024. PMID: 39296412 Free PMC article.
-
Asymmetries in foveal vision.bioRxiv [Preprint]. 2024 Dec 21:2024.12.20.629715. doi: 10.1101/2024.12.20.629715. bioRxiv. 2024. Update in: J Neurosci. 2025 Jul 22:e0055252025. doi: 10.1523/JNEUROSCI.0055-25.2025. PMID: 39763996 Free PMC article. Updated. Preprint.
-
Wide-field optical eye models for emmetropic and myopic eyes.J Vis. 2024 Jul 2;24(7):9. doi: 10.1167/jov.24.7.9. J Vis. 2024. PMID: 38995108 Free PMC article.
References
-
- Rudnicka A. R., Kapetanakis V. V., Wathern A. K., Logan N. S., Gilmartin B., Whincup P. H., Cook D. G., Owen C. G., “Global variations and time trends in the prevalence of childhood myopia, a systematic review and quantitative meta-analysis: Implications for aetiology and early prevention,” Br. J. Ophthalmol. 100(7), 882–890 (2016).10.1136/bjophthalmol-2015-307724 - DOI - PMC - PubMed
Grants and funding
LinkOut - more resources
Full Text Sources