. 2023 Oct 3;10(5):054302.
doi: 10.1063/4.0000197. eCollection 2023 Sep.

Isotope effects in dynamics of water isotopologues induced by core ionization at an x-ray free-electron laser

Affiliations

Isotope effects in dynamics of water isotopologues induced by core ionization at an x-ray free-electron laser

R Guillemin et al. Struct Dyn. .

Abstract

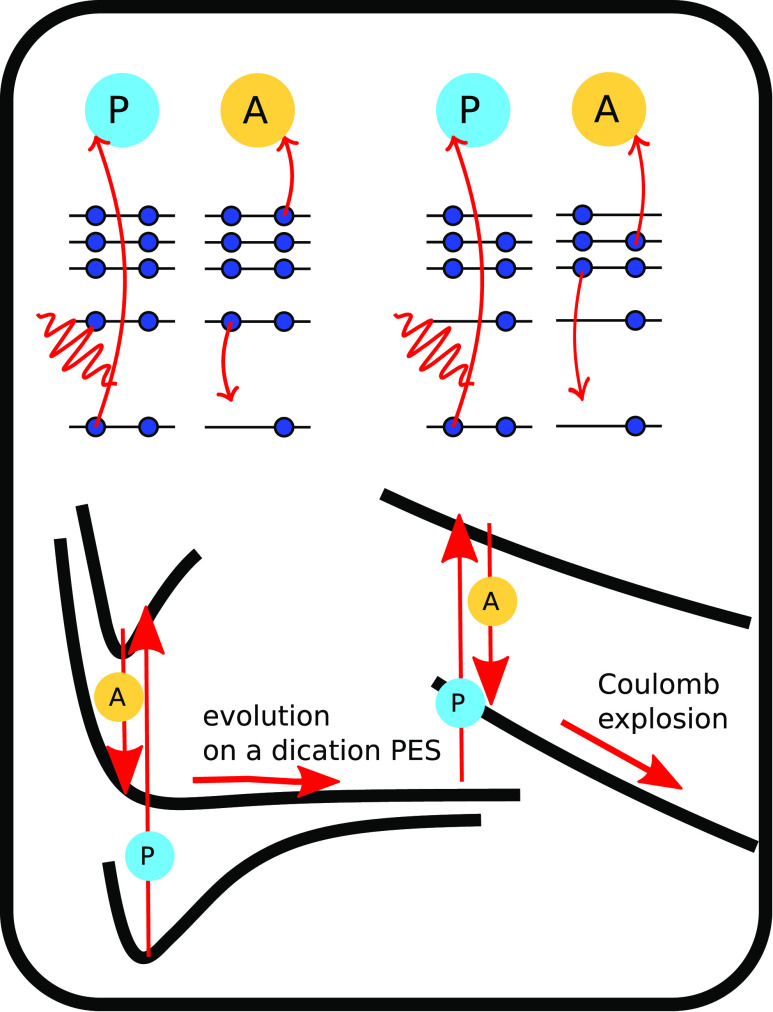
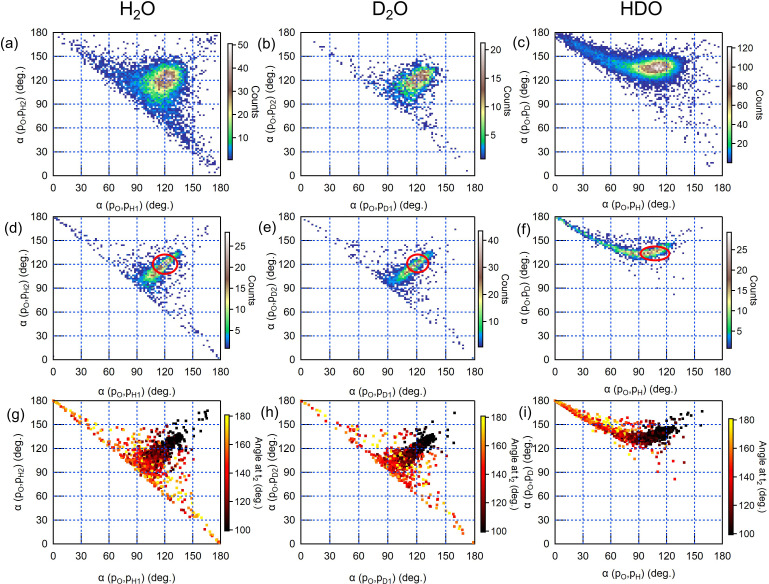
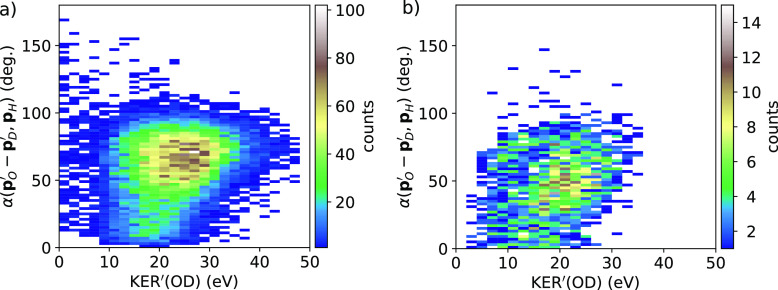
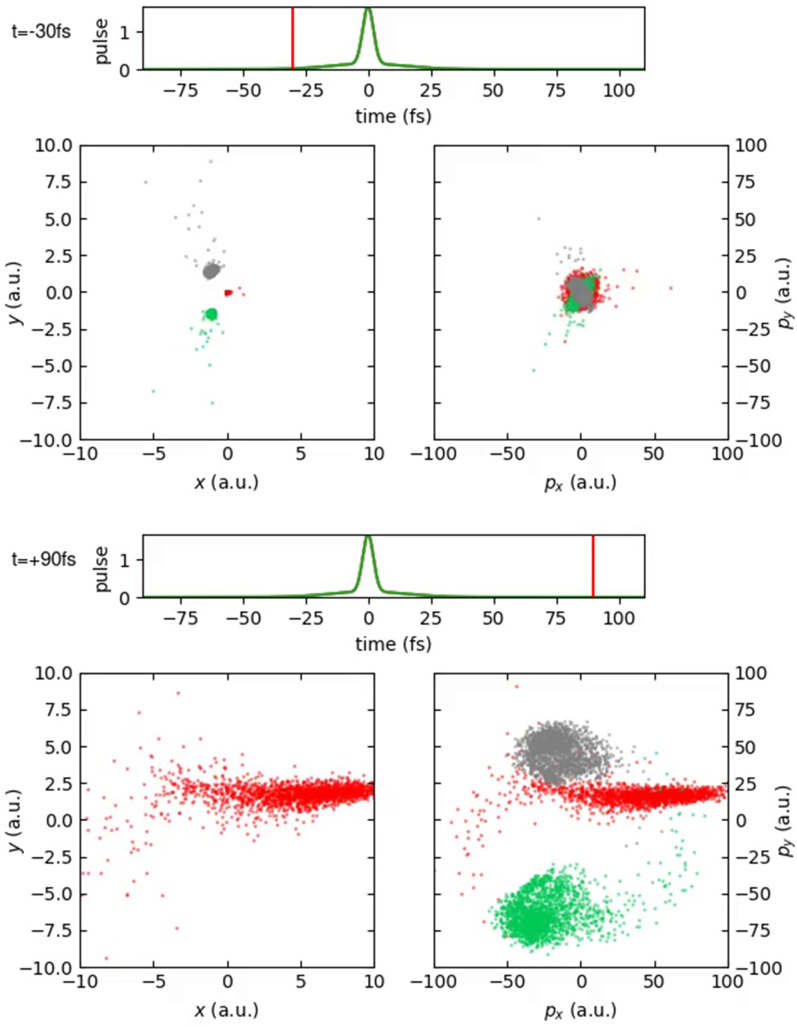
Dynamical response of water exposed to x-rays is of utmost importance in a wealth of science areas. We exposed isolated water isotopologues to short x-ray pulses from a free-electron laser and detected momenta of all produced ions in coincidence. By combining experimental results and theoretical modeling, we identify significant structural dynamics with characteristic isotope effects in H2O2+, D2O2+, and HDO2+, such as asymmetric bond elongation and bond-angle opening, leading to two-body or three-body fragmentation on a timescale of a few femtoseconds. A method to disentangle the sequences of events taking place upon the consecutive absorption of two x-ray photons is described. The obtained deep look into structural properties and dynamics of dissociating water isotopologues provides essential insights into the underlying mechanisms.


Conflict of interest statement

The authors have no conflicts to disclose.

Figures

FIG. 1.
FIG. 1.
Top: photoionization and Auger–Meitner decay patterns induced by the consecutive absorption of two photons. Bottom: sketched evolution of the system on the different potential energy surfaces leading eventually to Coulomb explosion.
FIG. 2.
FIG. 2.
Newton diagrams (experiment, top and theory, bottom) of the ion momenta for O2+ and two H+ (D+) ions for H2O (left column), D2O (middle column), and HDO (right column), detected in coincidence. The oxygen momentum defines the x axis. In the theoretical plots, the red ovals mark the momentum values expected for an instantaneous Coulomb explosion from the neutral ground-state configuration.
FIG. 3.
FIG. 3.
Scatter plots showing the angles of the final proton (deuteron) momenta with respect to the final oxygen momentum for H2O (left column), D2O (middle column), and HDO (right column). In each column, the top panel is the experiment, the middle panel is the simulation, and the bottom panel is the simulation where the color code represents the angles at the time of the second photoionization. The red ovals in the simulation panels indicate the value ranges for the event of a Coulomb explosion from the neutral ground-state configuration.
FIG. 4.
FIG. 4.
Scatter plots showing the magnitudes of the final proton/deuteron momenta for H2O (left column), D2O (middle column), and HDO (right column). In each column, the top panel is the experiment, the middle panel is the simulation, and the bottom panel is the simulation where the structural asymmetry at the time of the second photoionization is reflected by a color code. Asymmetry for H2O and D2O is defined as 2dOX1dOX2/dOX1+dOX2, where X stands for H and D, respectively. For HDO, asymmetry is given by 2(dOHdOD)/(dOH+dOD). Thus, positive asymmetry indicates a breakup into OD+ + H+, whereas negative asymmetry indicates a breakup into OH+ + D+. The red ovals in the simulation panels indicate the value ranges for the event of a Coulomb explosion from the neutral ground-state configuration. The dashed lines in panels (c), (f), and (i) have a slope of 1.37 (see the text).
FIG. 5.
FIG. 5.
Angle between the momenta of the hypothesized OD3+ intermediate and H+ fragments vs intermediate KER for OD3+ in HDO (see equations in the text). Left: experiment. Right: theory.
FIG. 6.
FIG. 6.
Native-frame plots for O2+/D+. The momentum vector of the H+ fragment is oriented along the horizontal axis. (a) and (b) Total momenta, experiment and theory; (c) and (d) corresponding plots, but gated on ranges of high and low KER. Here, low KER means KER < 30 eV, high KER means KER > 60 eV; (e)–(g) three different model scenarios (simulations) (see the text for details).
FIG. 7.
FIG. 7.
Position and momentum space coordinates in recoil frame for the ensemble of HDO molecules as a function of time. Left panels show position, and right panels show momentum space in the molecular plane. Gray points show the positions and momenta of hydrogen atoms, green dots show the positions and momenta of the deuterium atoms, and red dots show the positions and momenta of the oxygen atoms. The two horizontal “time” plots show the current time, and the green curve depicts the pulse envelope. Multimedia available online.
FIG. 8.
FIG. 8.
Position and momentum space coordinates in molecular frame for the ensemble of HDO molecules as a function of time. Left panels show position, and right panels show momentum space in the molecular plane. Gray dots show the positions and momenta of the hydrogen atoms, green dots show the positions and momenta of the deuterium atoms, and red dots show the positions and momenta of the oxygen atoms. The two horizontal time plots show the current time, and the green curve depicts the pulse envelope. Multimedia available online.
FIG. 9.
FIG. 9.
Selected trajectory with dissociation along bonds. White color denotes the hydrogen atom, green color the deuterium atom. The oxygen atom is depicted in red, pink, and orange colors, where the change in color denotes the timings of the two consecutive photon absorptions, namely, red: no photoabsorption, orange: absorption of the first photon, pink: absorption of the second photon. Multimedia available online.
FIG. 10.
FIG. 10.
Selected trajectory with large unbending motion along the bonds. White color denotes the hydrogen atom, green color the deuterium atom. The oxygen atom is depicted in red, pink, and orange colors, where the change in color denotes the timings of the two consecutive photon absorptions, namely, red: no photoabsorption, orange: absorption of the first photon, pink: absorption of the second photon. Multimedia available online.
FIG. 11.
FIG. 11.
Selected trajectory with strongly asymmetric fragmentation. White color denotes the hydrogen atom, green color the deuterium atom. The oxygen atom is depicted in red, pink, and orange colors, where the change in color denotes the timings of the two consecutive photon absorptions, namely, red: no photoabsorption, orange: absorption of the first photon, and pink: absorption of the second photon. Multimedia available online.

Similar articles

References

    1. Boudaïffa B., Cloutier P., Hunting D., Huels M. A., and Sanche L., “ Resonant formation of DNA strand breaks by low-energy (3 to 20 eV) electrons,” Science 287, 1658 (2000).10.1126/science.287.5458.1658 - DOI - PubMed
    1. Baumann M., Krause M., Overgaard J., Debus J., Bentzen S. M., Daartz J., Richter C., Zips D., and Bortfeld T., “ Radiation oncology in the era of precision medicine,” Nat. Rev. Cancer 16, 234 (2016).10.1038/nrc.2016.18 - DOI - PubMed
    1. Draganić I. G., “ Radiolysis of water: A look at its origin and occurrence in the Nature,” Radiat. Phys. Chem. 72, 181 (2005).10.1016/j.radphyschem.2004.09.012 - DOI
    1. Sankari A., Stråhlman C., Sankari R., Partanen L., Laksman J., Kettunen J. A., Galván I. F., Lindh R., Malmqvist P.-Å., and Sorensen S. L., “ Non-radiative decay and fragmentation in water molecules after 1a−1 1 4a1 excitation and core ionization studied by electron-energy- resolved electron-ion coincidence spectroscopy,” J. Chem. Phys. 152, 074302 (2020).10.1063/1.5141414 - DOI - PubMed
    1. Piancastelli M. N., Hempelmann A., Heiser F., Gessner O., Rüdel A., and Becker U., “ Resonant photofragmentation of water at the oxygen K edge by high-resolution ion-yield spectroscopy,” Phys. Rev. A 59, 300 (1999).10.1103/PhysRevA.59.300 - DOI