

Development and evaluation of nanobody tracers for noninvasive nuclear imaging of the immune-checkpoint TIGIT
- PMID: 37799715
- PMCID: PMC10548220
- DOI: 10.3389/fimmu.2023.1268900
Development and evaluation of nanobody tracers for noninvasive nuclear imaging of the immune-checkpoint TIGIT
Abstract
Introduction: T cell Ig and ITIM domain receptor (TIGIT) is a next-generation immune checkpoint predominantly expressed on activated T cells and NK cells, exhibiting an unfavorable prognostic association with various malignancies. Despite the emergence of multiple TIGIT-blocking agents entering clinical trials, only a fraction of patients responded positively to anti-TIGIT therapy. Consequently, an urgent demand arises for noninvasive techniques to quantify and monitor TIGIT expression, facilitating patient stratification and enhancing therapeutic outcomes. Small antigen binding moieties such as nanobodies, are promising candidates for such tracer development.
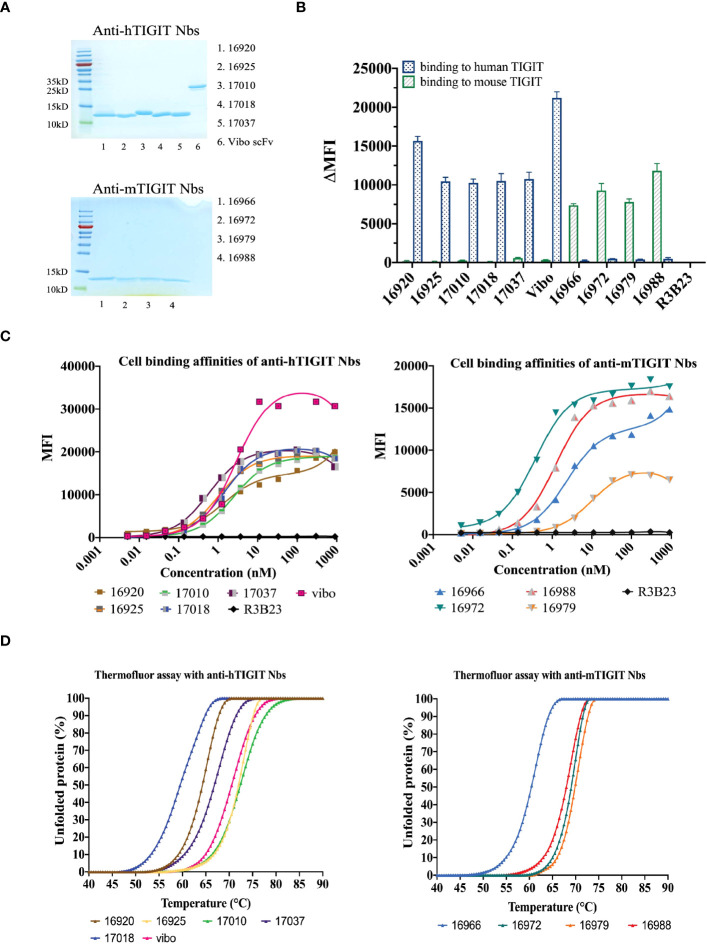
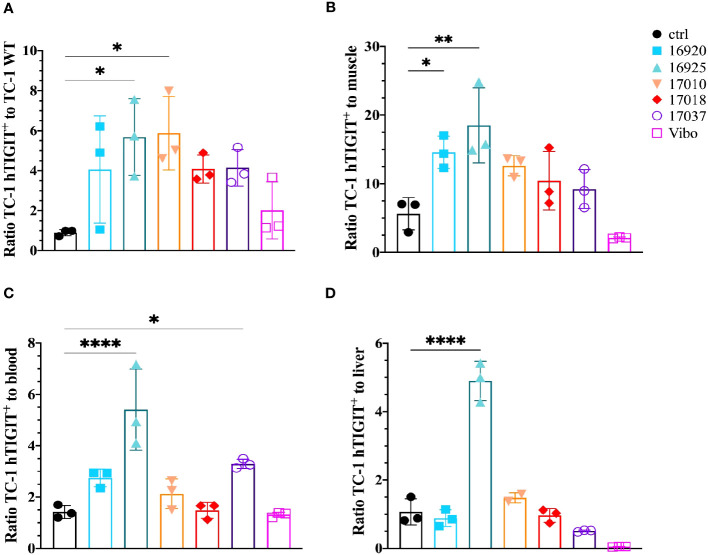
Methods: We generated a panel of anti-human or anti-mouse TIGIT nanobodies from immunized llamas. In addition, we designed a single-chain variable fragment derived from the clinically tested monoclonal antibody Vibostolimab targeting TIGIT, and assessed its performance alongside the nanobodies. In vitro characterization studies were performed, including binding ability and affinity to cell expressed or recombinant TIGIT. After Technetium-99m labeling, the nanobodies and the single-chain variable fragment were evaluated in vivo for their ability to detect TIGIT expression using SPECT/CT imaging, followed by ex vivo biodistribution analysis.
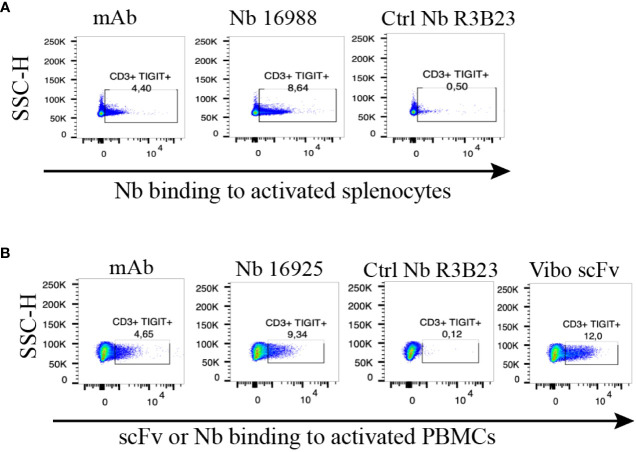
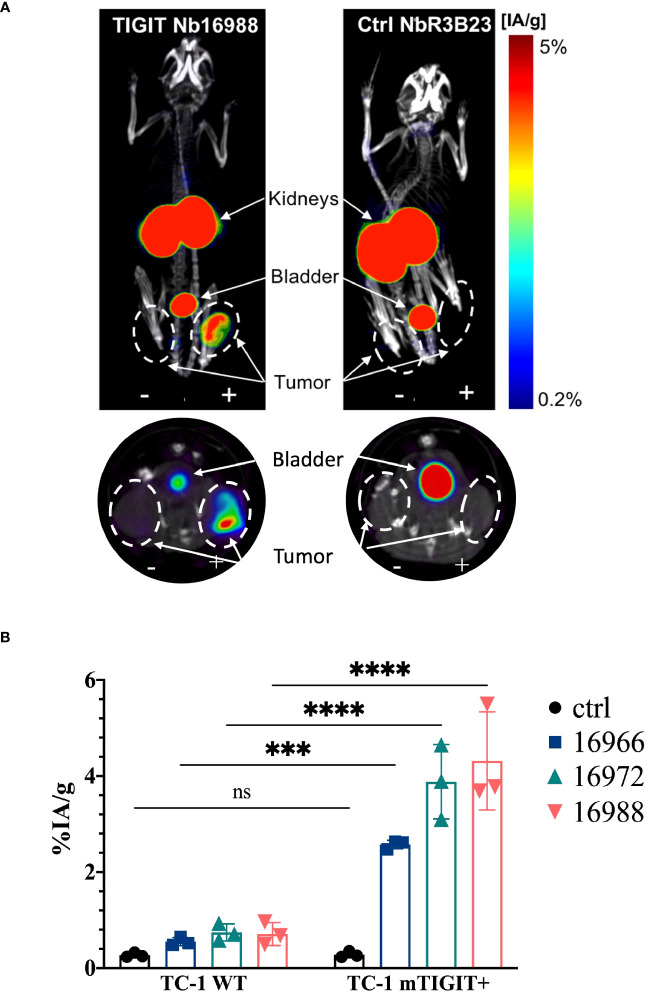
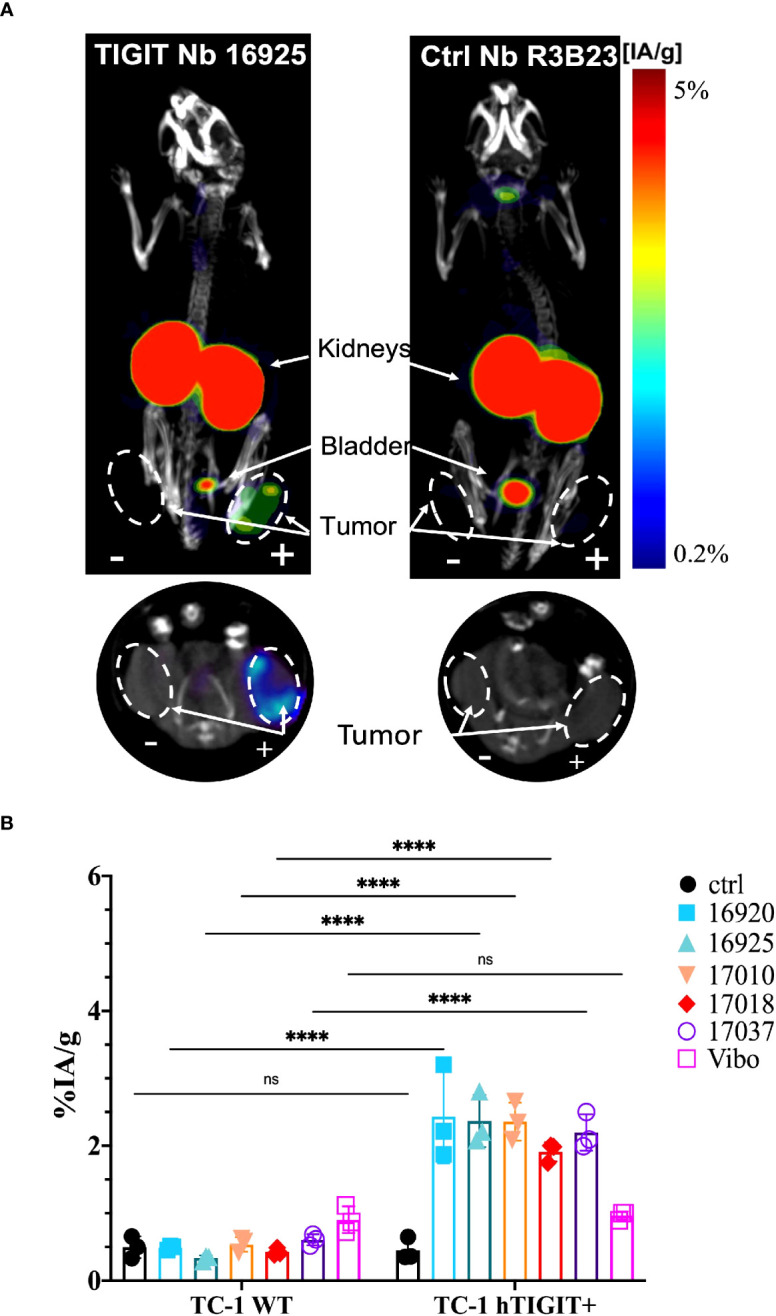
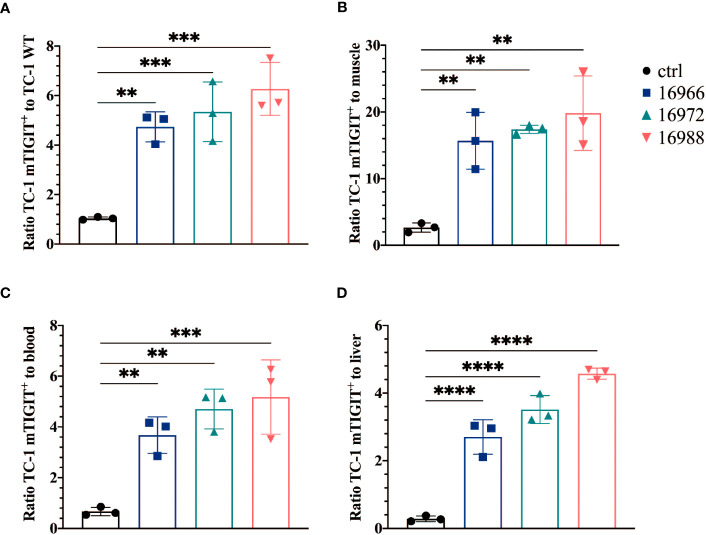
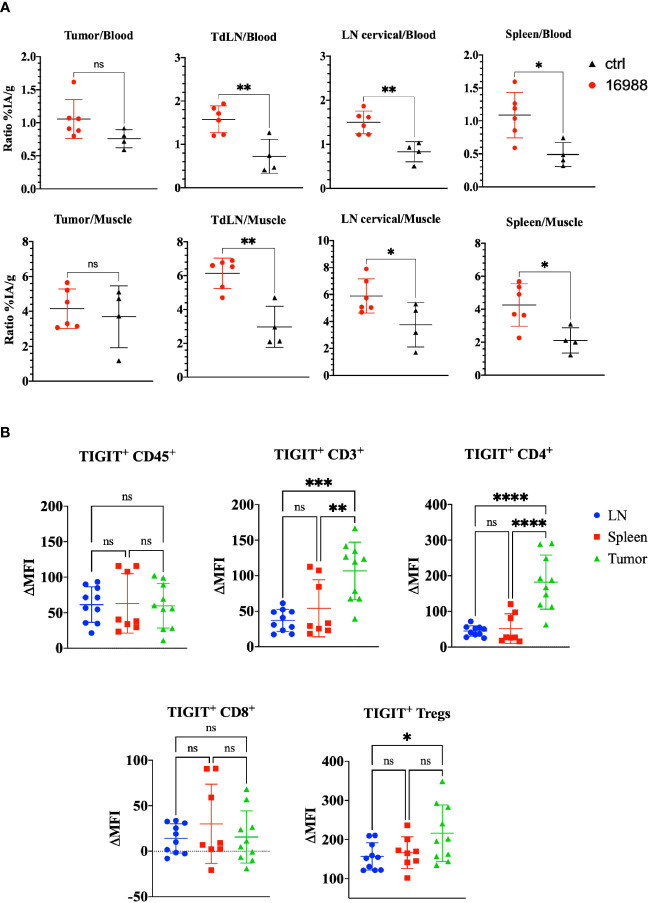
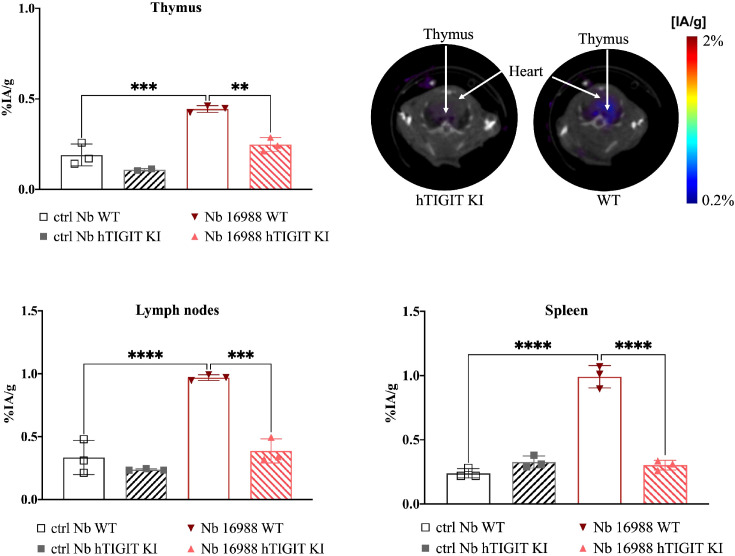
Results: Nine nanobodies were selected for binding to recombinant and cell expressed TIGIT with low sub-nanomolar affinities and are thermostable. A six-fold higher uptake in TIGIT-overexpressing tumor was demonstrated one hour post- injection with Technetium-99m labeled nanobodies compared to an irrelevant control nanobody. Though the single-chain variable fragment exhibited superior binding to TIGIT-expressing peripheral blood mononuclear cells in vitro, its in vivo behavior yielded lower tumor-to-background ratios at one hour post- injection, indicating that nanobodies are better suited for in vivo imaging than the single-chain variable fragment. Despite the good affinity, high specificity and on-target uptake in mice in this setting, imaging of TIGIT expression on tumor- infiltrating lymphocytes within MC38 tumors remained elusive. This is likely due to the low expression levels of TIGIT in this model.
Discussion: The excellent affinity, high specificity and rapid on-target uptake in mice bearing TIGIT- overexpressing tumors showed the promising diagnostic potential of nanobodies to noninvasively image high TIGIT expression within the tumor. These findings hold promise for clinical translation to aid patient selection and improve therapy response.
Keywords: TIGIT; immune checkpoint (ICP); nanobodies; noninvasive diagnosis; nuclear imaging; tracer development.
Copyright © 2023 Zeven, De Groof, Ceuppens, Awad, Ertveldt, de Mey, Meeus, Raes, Breckpot and Devoogdt.
Conflict of interest statement
GR and ND are founders and shareholders in Abscint NV/SA. GR, ND and KB hold patents related to Nanobody imaging and therapy. The remaining authors declare that the research was conducted in the absence of any commercial or financial relationships that could be construed as a potential conflict of interest. The author(s) declared that they were editorial board members of Frontiers, at the time of submission. This had no impact on the peer review process and the final decision.
Figures
Similar articles
-
Noninvasive Imaging of the Immune Checkpoint LAG-3 Using Nanobodies, from Development to Pre-Clinical Use.Biomolecules. 2019 Sep 29;9(10):548. doi: 10.3390/biom9100548. Biomolecules. 2019. PMID: 31569553 Free PMC article.
-
Generation and characterization of nanobodies targeting PSMA for molecular imaging of prostate cancer.Contrast Media Mol Imaging. 2014 May-Jun;9(3):211-20. doi: 10.1002/cmmi.1558. Contrast Media Mol Imaging. 2014. PMID: 24700748
-
Comparison of the biodistribution and tumor targeting of two 99mTc-labeled anti-EGFR nanobodies in mice, using pinhole SPECT/micro-CT.J Nucl Med. 2008 May;49(5):788-95. doi: 10.2967/jnumed.107.048538. Epub 2008 Apr 15. J Nucl Med. 2008. PMID: 18413403
-
[99mTc]Epidermal growth factor receptor–specific nanobody.2008 Apr 22 [updated 2008 May 13]. In: Molecular Imaging and Contrast Agent Database (MICAD) [Internet]. Bethesda (MD): National Center for Biotechnology Information (US); 2004–2013. 2008 Apr 22 [updated 2008 May 13]. In: Molecular Imaging and Contrast Agent Database (MICAD) [Internet]. Bethesda (MD): National Center for Biotechnology Information (US); 2004–2013. PMID: 20641885 Free Books & Documents. Review.
-
T-cell immunoglobulin and ITIM domain, as a potential immune checkpoint target for immunotherapy of colorectal cancer.IUBMB Life. 2021 May;73(5):726-738. doi: 10.1002/iub.2461. Epub 2021 Mar 30. IUBMB Life. 2021. PMID: 33686787 Review.
Cited by
-
Preclinical evaluation of antigen-sensitive B7-H3-targeting nanobody-based CAR-T cells in glioblastoma cautions for on-target, off-tumor toxicity.J Immunother Cancer. 2024 Nov 19;12(11):e009110. doi: 10.1136/jitc-2024-009110. J Immunother Cancer. 2024. PMID: 39562005 Free PMC article.
-
Optimizing antibody PET imaging: a comparative preclinical analysis of nanobody and minibody-like PET tracers.Eur J Nucl Med Mol Imaging. 2025 Aug;52(10):3833-3845. doi: 10.1007/s00259-025-07205-2. Epub 2025 Mar 31. Eur J Nucl Med Mol Imaging. 2025. PMID: 40159541 Free PMC article.
-
Discovery of nanobodies: a comprehensive review of their applications and potential over the past five years.J Nanobiotechnology. 2024 Oct 26;22(1):661. doi: 10.1186/s12951-024-02900-y. J Nanobiotechnology. 2024. PMID: 39455963 Free PMC article. Review.
-
Nanobodies as innovative immune checkpoint modulators: advancing cancer immunotherapy.Med Oncol. 2024 Dec 24;42(1):36. doi: 10.1007/s12032-024-02588-y. Med Oncol. 2024. PMID: 39719469 Review.
-
Specific imaging of CD8 + T-Cell dynamics with a nanobody radiotracer against human CD8β.Eur J Nucl Med Mol Imaging. 2024 Dec;52(1):193-207. doi: 10.1007/s00259-024-06896-3. Epub 2024 Sep 2. Eur J Nucl Med Mol Imaging. 2024. PMID: 39218831 Free PMC article.
References
Publication types
MeSH terms
Substances
LinkOut - more resources
Full Text Sources
Medical