. 2023 Sep 20:14:1225759.
doi: 10.3389/fphar.2023.1225759. eCollection 2023.

A spatially specified systems pharmacology therapy for axonal recovery after injury

Affiliations

A spatially specified systems pharmacology therapy for axonal recovery after injury

Mustafa M Siddiq et al. Front Pharmacol. .

Abstract

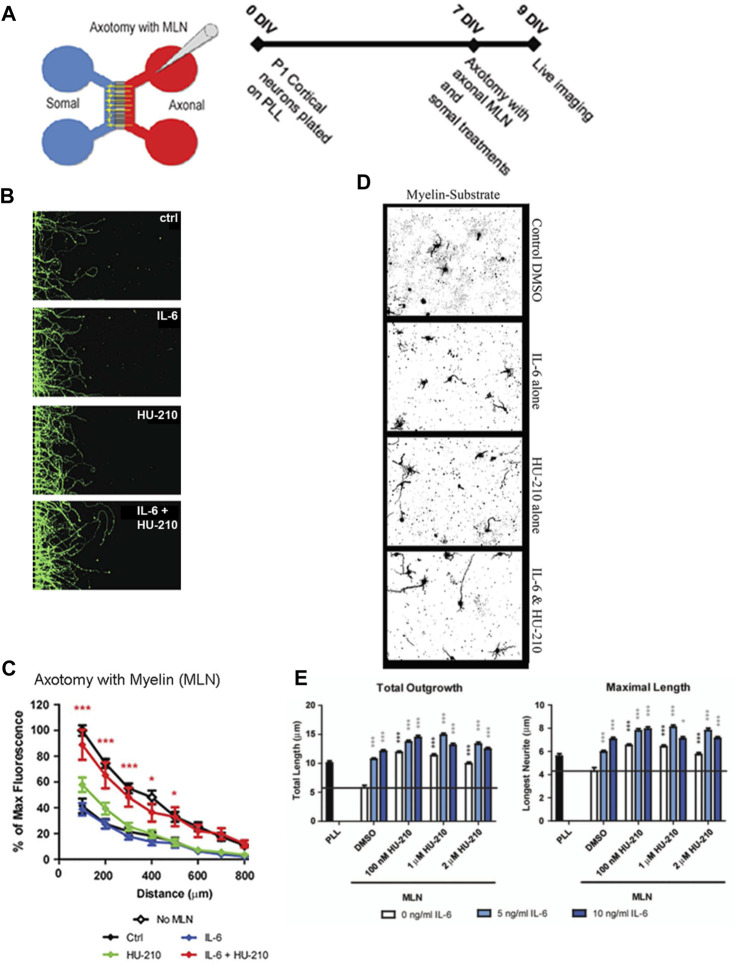
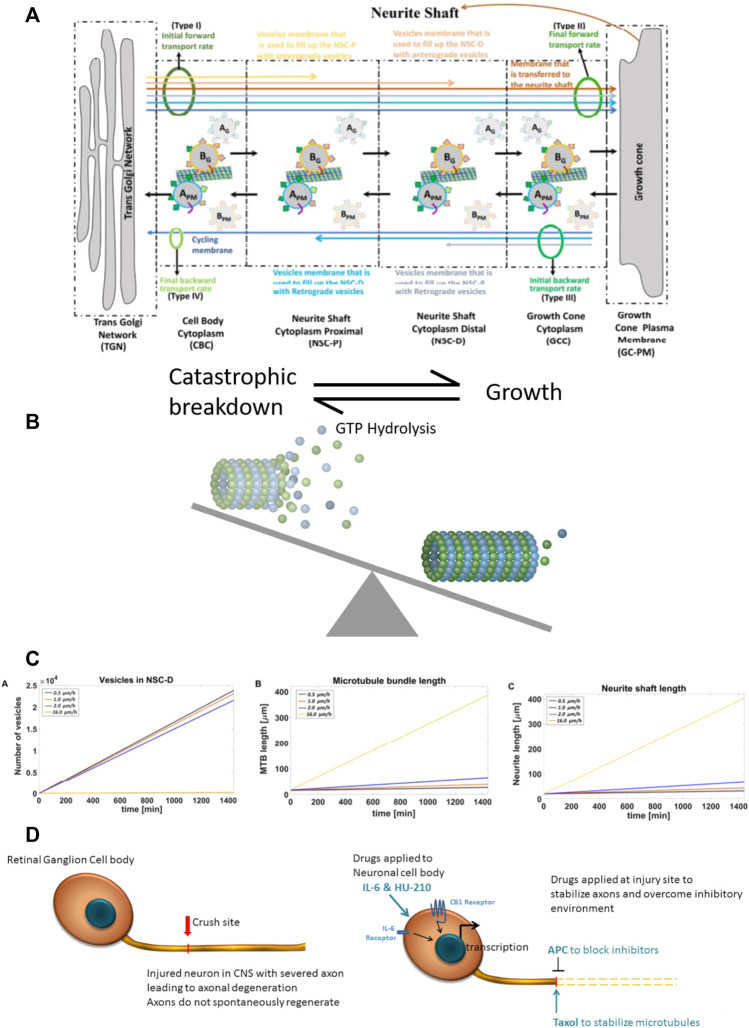
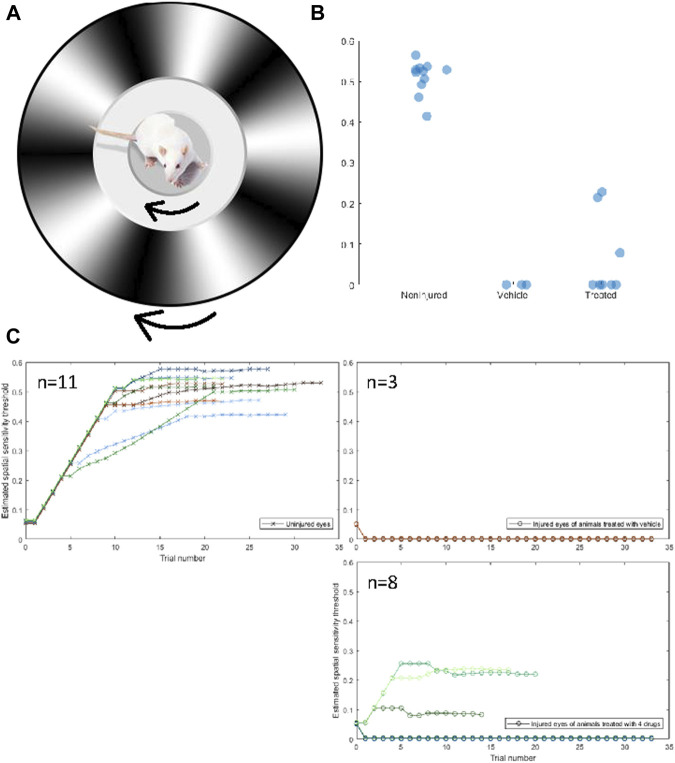
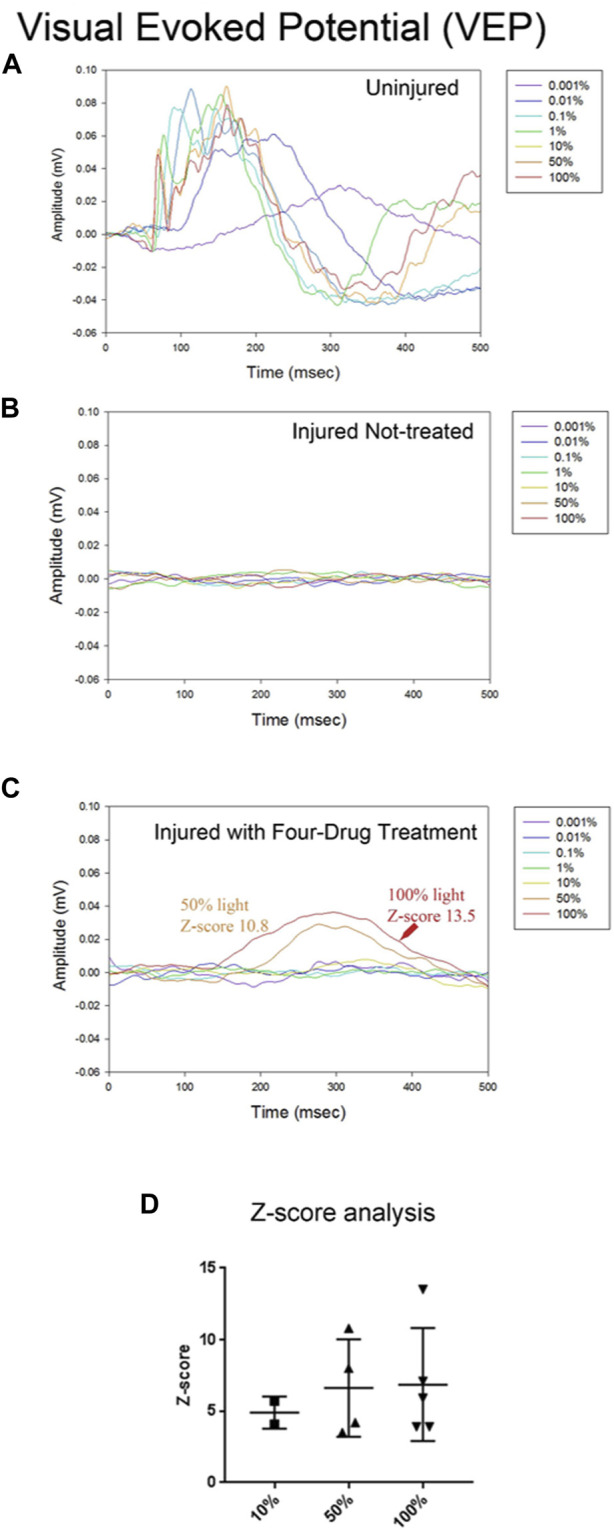
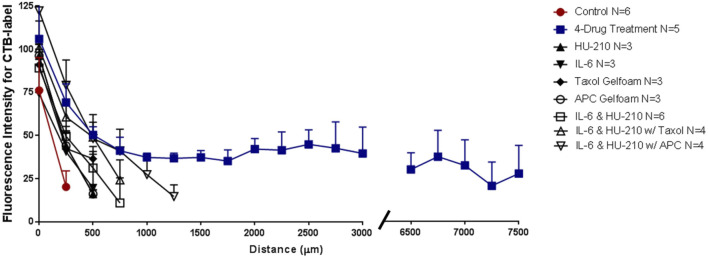
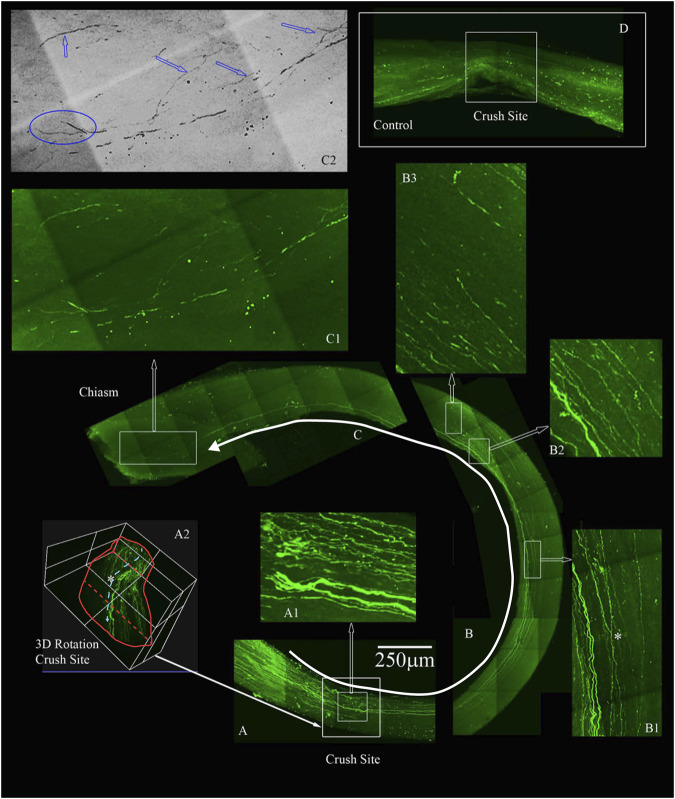
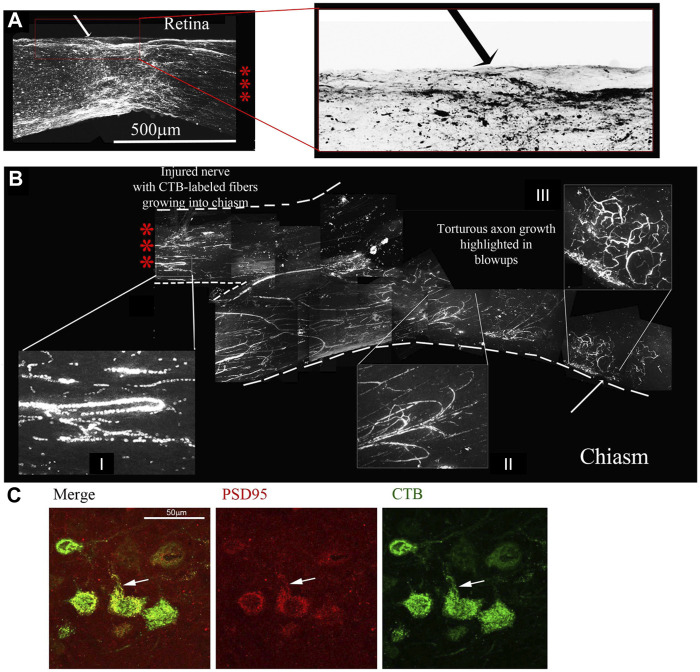
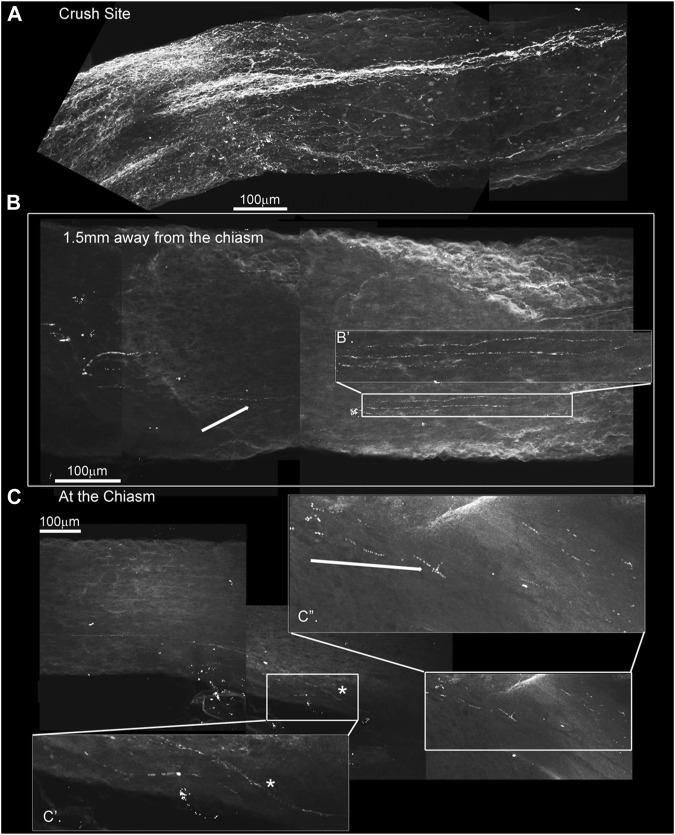
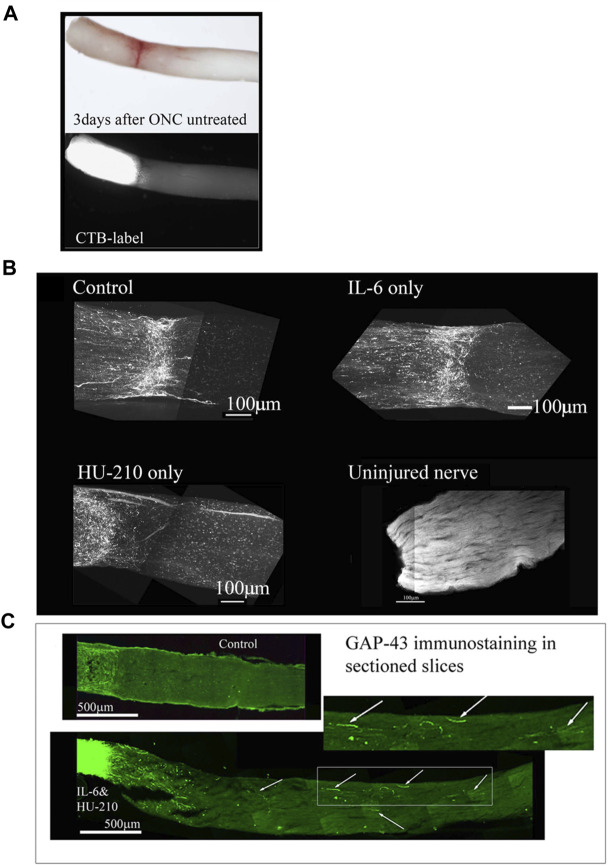
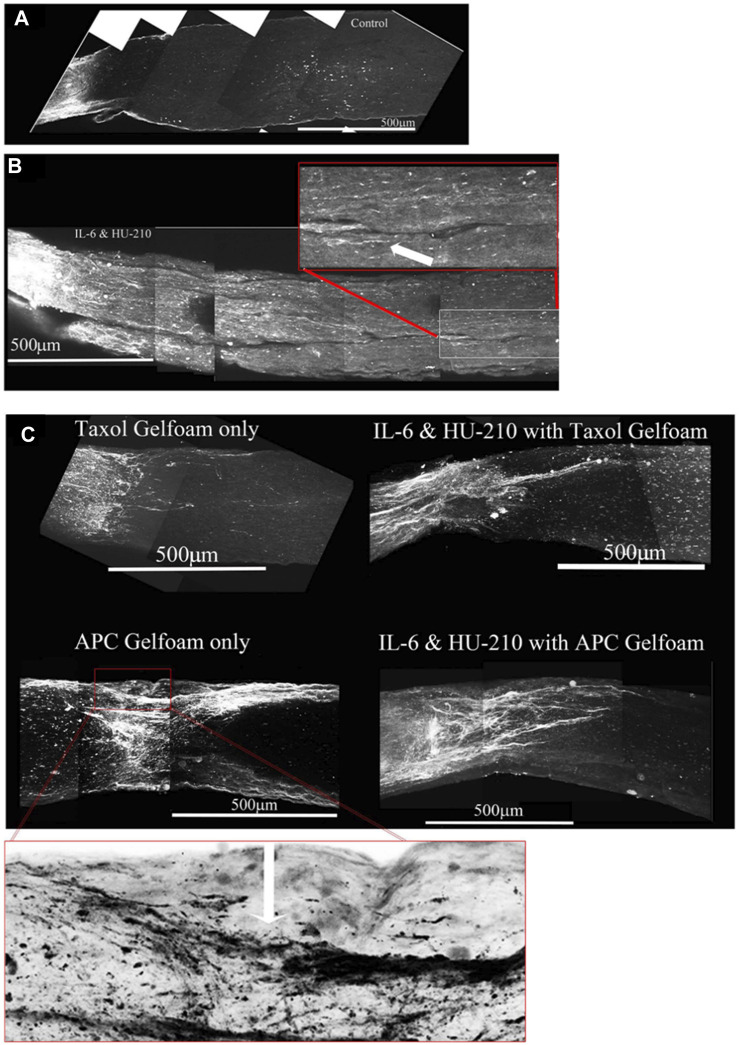
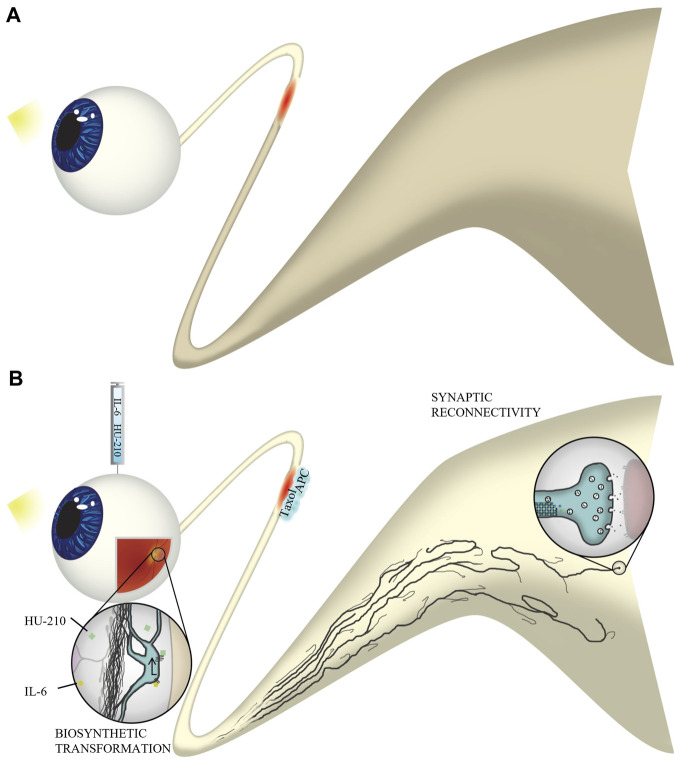
There are no known drugs or drug combinations that promote substantial central nervous system axonal regeneration after injury. We used systems pharmacology approaches to model pathways underlying axonal growth and identify a four-drug combination that regulates multiple subcellular processes in the cell body and axons using the optic nerve crush model in rats. We intravitreally injected agonists HU-210 (cannabinoid receptor-1) and IL-6 (interleukin 6 receptor) to stimulate retinal ganglion cells for axonal growth. We applied, in gel foam at the site of nerve injury, Taxol to stabilize growing microtubules, and activated protein C to clear the debris field since computational models predicted that this drug combination regulating two subcellular processes at the growth cone produces synergistic growth. Physiologically, drug treatment restored or preserved pattern electroretinograms and some of the animals had detectable visual evoked potentials in the brain and behavioral optokinetic responses. Morphology experiments show that the four-drug combination protects axons or promotes axonal regrowth to the optic chiasm and beyond. We conclude that spatially targeted drug treatment is therapeutically relevant and can restore limited functional recovery.

Keywords: electrophysiology; electroretinogram; iDISCO; microfluidic chambers; retinal ganglion cell.


Conflict of interest statement

The authors declare that the research was conducted in the absence of any commercial or financial relationships that could be construed as a potential conflict of interest.

Figures

FIGURE 1
FIGURE 1
Somal treatment with IL-6 and HU-210 promotes neurite outgrowth on myelin. (A) Schematic representation of the microfluidic chamber. (B) Neurons were cultured in chambers on PLL for 7 days in vitro (DIV), and axotomy was performed. The axonal compartment was then filled with 20 μg/mL solution of myelin (MLN). 10 ng/mL IL-6 and/or 200 nM HU-210 treatments were applied to the somal compartment of each respective chamber. The neurons were imaged live after 48 h using Calcein AM. Representative confocal images of neurons following axotomy and treatment. (C) Neurite outgrowth was quantified by measuring the total fluorescence at multiple cross-sections of the image. The zero point on the x-axis represents the right edge of microgrooves. All data points were normalized to the first point of “No MLN” as 100 percent. Statistical differences were calculated from four independent experiments using two-way ANOVA. Asterisks show significance compared to Ctrl treatment at a given distance; *, p < 0.05; ***, p < 0.001. (D) P1 cortical neurons were plated on myelin–coated slides and treated with IL-6 and/or HU-210 over a range of concentrations. The neurons were fixed after 24 h and labeled for β-III-tubulin. Representative images of neurons plated on myelin (MLN) substrate treated from top to bottom, with either DMSO, IL-6, HU-210 or IL-6&HU-210 labeled with β-III-tubulin show treatment with IL-6 and HU-210 together promotes neurite outgrowth in an inhibitory environment in a dose-dependent manner. (E) Total outgrowth of neurites and neurons’ longest neurite were quantified using two-way ANOVA. Asterisks show significance compared to DMSO alone (black bar); *, p < 0.05; ***, p < 0.001.
FIGURE 2
FIGURE 2
Computational model of neurite outgrowth. (A) Schematic representation of the model used to generate an analytical solution for predicting kinetic parameters of neurite outgrowth. The model distinguishes four different membrane types (I-IV, green ovals) from TGN to the growth cone. Initial (I) and final (II) anterograde membrane transport rates refer to budding and fusion rates at the TGN and GC, respectively. Initial (III) and final (IV) retrograde membrane transport rates represent endocytosis and fusion rates at the GC and TGN, respectively. Budded vesicles at the TGN can be distinguished by their destination: the yellow arrow represents anterograde vesicle loss in the NSC-P compartment; light brown arrow, anterograde vesicle loss in the NSC-D; brown arrow, fusion with the GC membrane and addition to the neurite shaft; light gray arrow, retrograde vesicle loss in the NSC-D; light blue arrow, retrograde vesicle loss in the NSC-P; and dark blue arrow, recycling membrane from the GC-PM to the TGN. Anterograde moving vesicle BG moves forward while anterograde moving vesicle AG back fuses with the TGN because coat protein A SNAREs have a higher affinity with TGN SNAREs. Likewise, endocytosed vesicle BPM back fuses with the GC-PM because coat protein B SNAREs have a higher affinity for GC SNAREs. (B) Dynamic microtubules have a stochastic profile, which changes as they undergo catastrophic disassembly by hydrolysis of GTP bound tubulins at the tip. Taxol present at the injury site reduces GTP hydrolysis, leading to elongation of the dynamic microtubule bundle and conversion to stable microtubules. Here, the balance between catastrophic breakdown and growth is shifted towards growth by the presence of Taxol. (C) The calculated values for the vesicle levels in the NSC-D compartment under various drug conditions and corresponding rates of microtubule elongation and neurite shaft length. The profile of the plots indicate that the synergistic effects of the four-drug combination can be explained parsimoniously by the action of APC, which, by removing the extracellular inhibitory environment, allows for vesicle movement from the NSC-D to the GC-PM. Enhanced microtubule elongation due to Taxol-dependent stabilization of dynamic microtubules allows for the observed overall growth rate of the axon. (D) Cartoon schematic for spatial systems reason for combinational therapy to promote CNS axonal regeneration. Drugs are applied to both the injury site (APC and Taxol) and directly to the RGC cell bodies (IL-6 and HU-210), indicating a spatially resolved approach to applying drugs is required to promote robust axonal regeneration.
FIGURE 3
FIGURE 3
Four-drug combination partially restores visual function compared to injured optic nerves treated with vehicle only. (A) The Optokinetic response is measured by placing a rat on an elevated platform and presented a virtual environment showing a drifting sinusoidal wave with specific spatial and temporal frequencies. The rat unconsciously tracks the drifting pattern, with clockwise tracking dependent on the left (uninjured) eye and counterclockwise tracking dependent on the right (injured) eye. The spatial frequency of the drifting pattern increases with consecutive identifiable tracking and decreases if no tracking is observed. The spatial sensitivity threshold is the maximum spatial frequency at which tracking is observed. (B) The uninjured eyes of rats had a mean (±std) spatial sensitivity threshold of 0.506 ± 0.042 cpd. The threshold of injured eyes of treated rats was 0.065 ± 0.100 cpd, and the threshold of injured eyes of nontreated rats was 0 ± 0 cpd. Three out of eight treated rats displayed a threshold above 0 cpd in their injured eye, whereas none of the nontreated rats displayed a threshold above 0 cpd. A one-sided independent t-test was conducted to determine if the thresholds of treated rats were significantly different from untreated rats. The difference was not significant (p = 0.544), but the distribution of thresholds of treated rats was determined to be significantly more than 0 with a variance equal to that of the uninjured eye (z = 4.391†). Both groups are significantly lower than the noninjured eye (p < 0.05*) (C) Spatial frequency as a function of trials for the uninjured (CW, crosses) and injured (CCW, circles) of untreated rats (left) and treated rats (right).
FIGURE 4
FIGURE 4
The four-drug combination enhances VEP responses compared to injured optic nerves treated with vehicle only. Visual evoked potential (VEPs) from the brain were simultaneously recorded with the fERGs. In the uninjured eye (A) the VEP was slow for the dimmest flash, peaking around 300 ms, and had fast onset with multiple wave components and compound action potentials for the brightest flashes. Injured eyes with no treatment (B) have no detectable VEP activity. The VEP in several treated animals (C) exhibited a slow waveform in response to the highest intensities of light (50% and 100%), suggesting that some axons regenerated all the way to the brain. Z-score values for 50% and 100% are shown in the figure, indicating they are significantly different from the noise. (D) Summary of the Z-scores calculated for the five animals with four-drug treatment that showed VEP signals at some intensity. Of the five animals tested at 10%, 2/5 met the criterion to be above a Z-score of 3; all 4 tested at 50%, showed a response; and all 5 tested at 100% showed a response. The one animal not tested at 50% showed VEPs at 10% and 100%.
FIGURE 5
FIGURE 5
Four-drug combination in the rat ONC model promotes axonal regeneration to the chiasm. Length of axons in the injured nerve were quantified by the fluorescent intensity of the CTB label for animals treated with vehicle, individual drugs, IL-6 and HU-210 combined, both combined with Taxol or combined with APC, or all four drugs together. CTB labelling showed that long axons only grew in the presence of all four drugs. Representative images of CTB-labeled axons are found in Figures 6, 7.
FIGURE 6
FIGURE 6
Four-drug treatment promotes robust axonal regeneration in the rat ONC model as detected by AAV8-GFP labeling. We labeled the regenerating axons with AAV8-GFP injected intra-vitreally to the RGC cell bodies 2 weeks prior to euthanizing. The optic nerves are immunolabeled by iDISCO with anti-GFP and then chemically cleared. (A) Crush site of the nerve of displaying regenerating fibers expressing GFP. The inner box is magnified in A1, displaying tortured growing axons in the center of the nerve (inner box with traced white arrow). A2, is a 3D rendering of the nerve at the crush site (outer white box in A shown by filled white arrow) that is rotated on its axis to emphasize regenerating axons are not growing on the edges but more in the center of the nerve (see asterisk). (B) Continuation of the nerve displaying GFP expressing axons that are growing in the center of the nerve and even crossing over in B1 (see asterisk). B2 and B3 are magnified regions with GFP labeled axons over 4 mm away from the crush site. (C) We detect GFP labeled axons growing into the chiasm of the nerve and the end of the chiasm, we have a magnified region in C1. The image in C1 was converted to grayscale and then inverted in C2, to emphasize the tortured growth into the chiasm as demarcated by the blue arrows and the bifurcation (blue circle in C2) of the axons growing into the chiasm. (D) An example of an adult rat that only received vehicle controls. No GFP labeled axons are displayed past the crush site. All images are taken on an Olympus Multiphoton microscope with a 25X water immersion lens. The images in A1, B1-3 and C1 are taken at 25x with a 1.5x Zoom. Micrometer of 250 microns is shown in (A).
FIGURE 7
FIGURE 7
Four-drug treatment promotes robust axonal regeneration in the rat ONC model as detected by CTB-labelling. CTB labelling revealed a torturous pattern of growth from the site of the optic nerve crush (A) to the chiasm (B) of the same animal 7 days post CTB labelling. The three red asterisks between the retina with the crush site (A) to the chiasm (B) represent the same nerve without 6 mm of the nerve between, from 0.5 mm from the crush site to the chiasm. The red box is enlarged of the crush site in A and inverted to reveal the crushed regenerating axons. I and II display random processes and bifurcation of axons, a result of growth without guidance cues. III displays torturous axon growth further into the optic chiasm. (C) Regenerating axons reach the brain. Brain sections were immunostained for CTB, revealing CTB labeled neurons and fibers in the superior colliculus. CTB (green) and PSD95 (red) colocalize (yellow) in neurons in the superior colliculus, as highlighted by the white arrows.
FIGURE 8
FIGURE 8
GAP-43 immunostaining using the iDISCO method to stain and chemically clear the entire optic nerve that was crushed and 4-drug treated reveals GAP-43 staining in the chiasm. ONC with 4-drug treatment and i-DISCO GAP-43 staining reveals the crush site with regenerating fibers (A). Approximately 6 mms away from the crush, near the chiasm we also detect GAP-43 positive axons (B) the blowup displays several of these GAP-43+ axons. We even detect fibers in the chiasm (C) as revealed by the blowups in C’ and C”.
FIGURE 9
FIGURE 9
Individual drugs promote limited axonal regeneration. We visualized the whole nerve with CTB labelling using a Multiphoton microscope. (A) Control animals injected with 2.5 μL 0.5% DMSO, have few labeled axons crossing a short distance (less than 0.2 mm from the crush site), this was consistent for IL-6 (5 mg/mL) and HU-210 (300 μM) evaluated individually as well, where no significant axonal regeneration was detected past the crush site. Uninjured nerve with CTB labeling and 3-DISCO clearing shows the abundance of axons in the rat optic nerve. (B) Untreated crushed optic nerve was labeled with CTB immediately after injury and 3 days after crush we viewed the nerve under the light microscope (top image), and the CTB-label under fluorescence, showing no spared fibers (bottom image). (C) Fischer adult rats had unilateral ONC performed followed by intravitreal injections of either 0.5% DMSO for vehicle control (top) or the combination of IL-6 (5 mg/mL) and HU-210 (300 μM, bottom). Intravitreal injections were repeated on day 3 post-crush. After 3 weeks the nerves were removed, sectioned and immunolabeled with GAP-43. Controls had clear crush sites, but no GAP-43 labeled axons crossing the crush site, while IL-6 and HU-210 had regenerating axons nearly 3 mm away as indicated by arrows.
FIGURE 10
FIGURE 10
Addition of Taxol and/or APC promotes longer axonal regeneration. (A) CTB-labeled regenerating axons within the whole nerve were detected after applying the 3-DISCO clearing technique. Control animals had clear crush sites with few fibers crossing 3 weeks after injury. (B) However, with IL-6 and HU-210 treatment we could detect CTB-labeled axons within the nerve bundle shown, above the boxed panel is a magnified region demarcated by the red box, showing the extent of regenerating axons over 2 mm away from the crush site, as pointed out by the white arrows. (C) Taxol applied in gelfoam alone had promoted limited axonal regeneration. Adding Taxol gelfoam with IL-6 and HU-210 injections resulted in more robust growth, but still less than 1 mm from the crush site. APC gelfoam alone also promoted modest axonal regeneration from the crush site. Slightly more robust growth is detected when we combine IL-6 and HU-210 with APC gelfoam. The CTB-labeled axons are growing towards the edge where the APC-gelfoam was applied. In the enhanced and inverted image of APC gelfoam demarcated by the red box, we show the crush site that was treated with APC-gelfoam over the injury site. The white arrow in the inverted image of the original emphasizes the crushed fibers that are regenerating, as determined by CTB-labeling.
FIGURE 11
FIGURE 11
Experimental overview. (A) Without four-drug intervention, axons do not regenerate through the injured optic nerve. Natural stimulation with light does not result in visual activity in the brain. (B) Following optic nerve crush, we injected IL-6 and HU-210 into the vitreous and applied Taxol and APC in gelfoam at the injury site. IL-6 and HU-210 promoted oncogenic transformation at the cell body of retinal ganglion cells through activation of the STAT3 transcription pathway. Taxol stabilizes dynamic microtubules at the injury site, which works synergistically with APC, which clears the inhibitory environment and allows for fusion of membrane vesicles with the growth cone plasma membrane, to promote axon elongation. Axons regenerate to the optic chiasm and even make synaptic connections with the superior colliculus. Thus, natural stimulation with light results in function visual activity in our optic nerve crush model of axonal regeneration.

References

    1. Alushin G. M., Lander G. C., Kellogg E. H., Zhang R., Baker D., Nogales E. (2014). High-resolution microtubule structures reveal the structural transitions in αβ-tubulin upon GTP hydrolysis. Cell 157, 1117–1129. 10.1016/j.cell.2014.03.053 - DOI - PMC - PubMed
    1. Ashique S., Sirohi E., Kumar S., Rihan M., Mishra N., Bhatt S., et al. (2023). Aducanumab in alzheimer's disease: A critical update. Curr. Med. Chem. 31. 10.2174/0929867331666230727103553 - DOI - PubMed
    1. Bei F., Lee H. H. C., Liu X., Gunner G., Jin H., Ma L., et al. (2016). Restoration of visual function by enhancing conduction in regenerated axons. Cell 164, 219–232. 10.1016/j.cell.2015.11.036 - DOI - PMC - PubMed
    1. Bromberg K. D., Maayan A., Neves S. R., Iyengar R. (2008). Design Logic of a cannabinoid receptor signaling network that triggers neurite outgrowth. Science 320, 903–909. 10.1126/science.1152662 - DOI - PMC - PubMed
    1. Buchli A. D., Schwab M. E. (2005). Inhibition of Nogo: a key strategy to increase regeneration, plasticity and functional recovery of the lesioned central nervous system. Ann. Med. 37, 556–567. 10.1080/07853890500407520 - DOI - PubMed

LinkOut - more resources