. 2023 Oct 27;133(10):810-825.
doi: 10.1161/CIRCRESAHA.123.323200. Epub 2023 Oct 6.

Myocardial Recovery in Recent Onset Dilated Cardiomyopathy: Role of CDCP1 and Cardiac Fibrosis

Affiliations

Myocardial Recovery in Recent Onset Dilated Cardiomyopathy: Role of CDCP1 and Cardiac Fibrosis

Duan Liu et al. Circ Res. .

Abstract

Background: Dilated cardiomyopathy (DCM) is a major cause of heart failure and carries a high mortality rate. Myocardial recovery in DCM-related heart failure patients is highly variable, with some patients having little or no response to standard drug therapy. A genome-wide association study may agnostically identify biomarkers and provide novel insight into the biology of myocardial recovery in DCM.

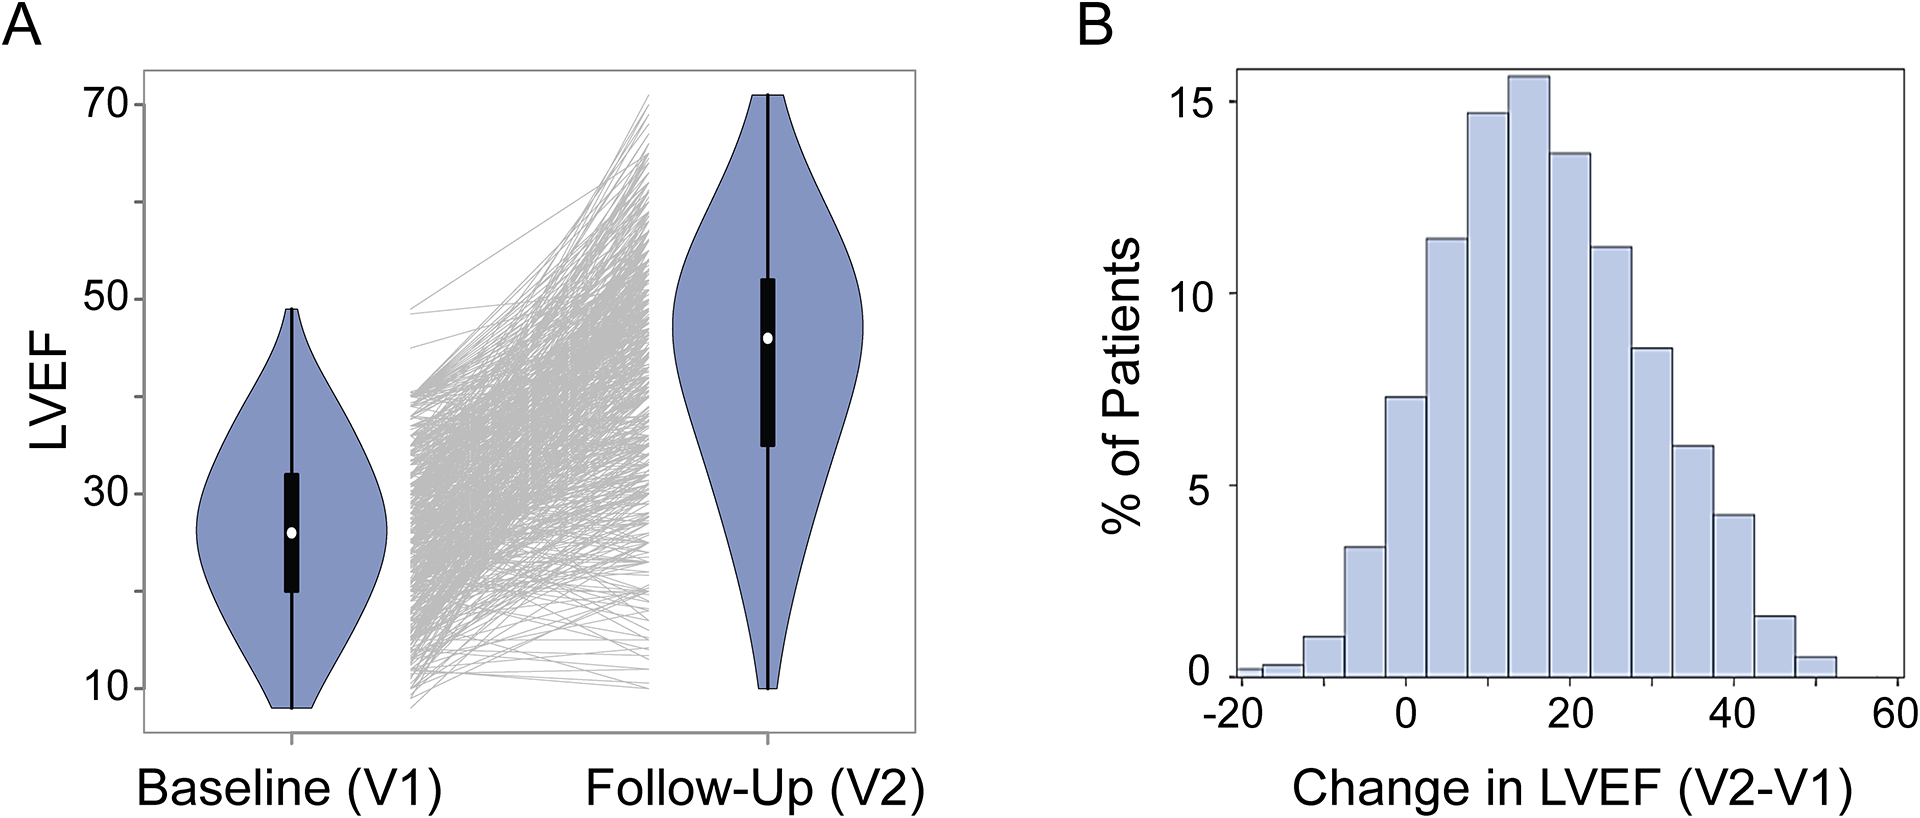
Methods: A genome-wide association study for change in left ventricular ejection fraction was performed in 686 White subjects with recent-onset DCM who received standard pharmacotherapy. Genome-wide association study signals were subsequently functionally validated and studied in relevant cellular models to understand molecular mechanisms that may have contributed to the change in left ventricular ejection fraction.

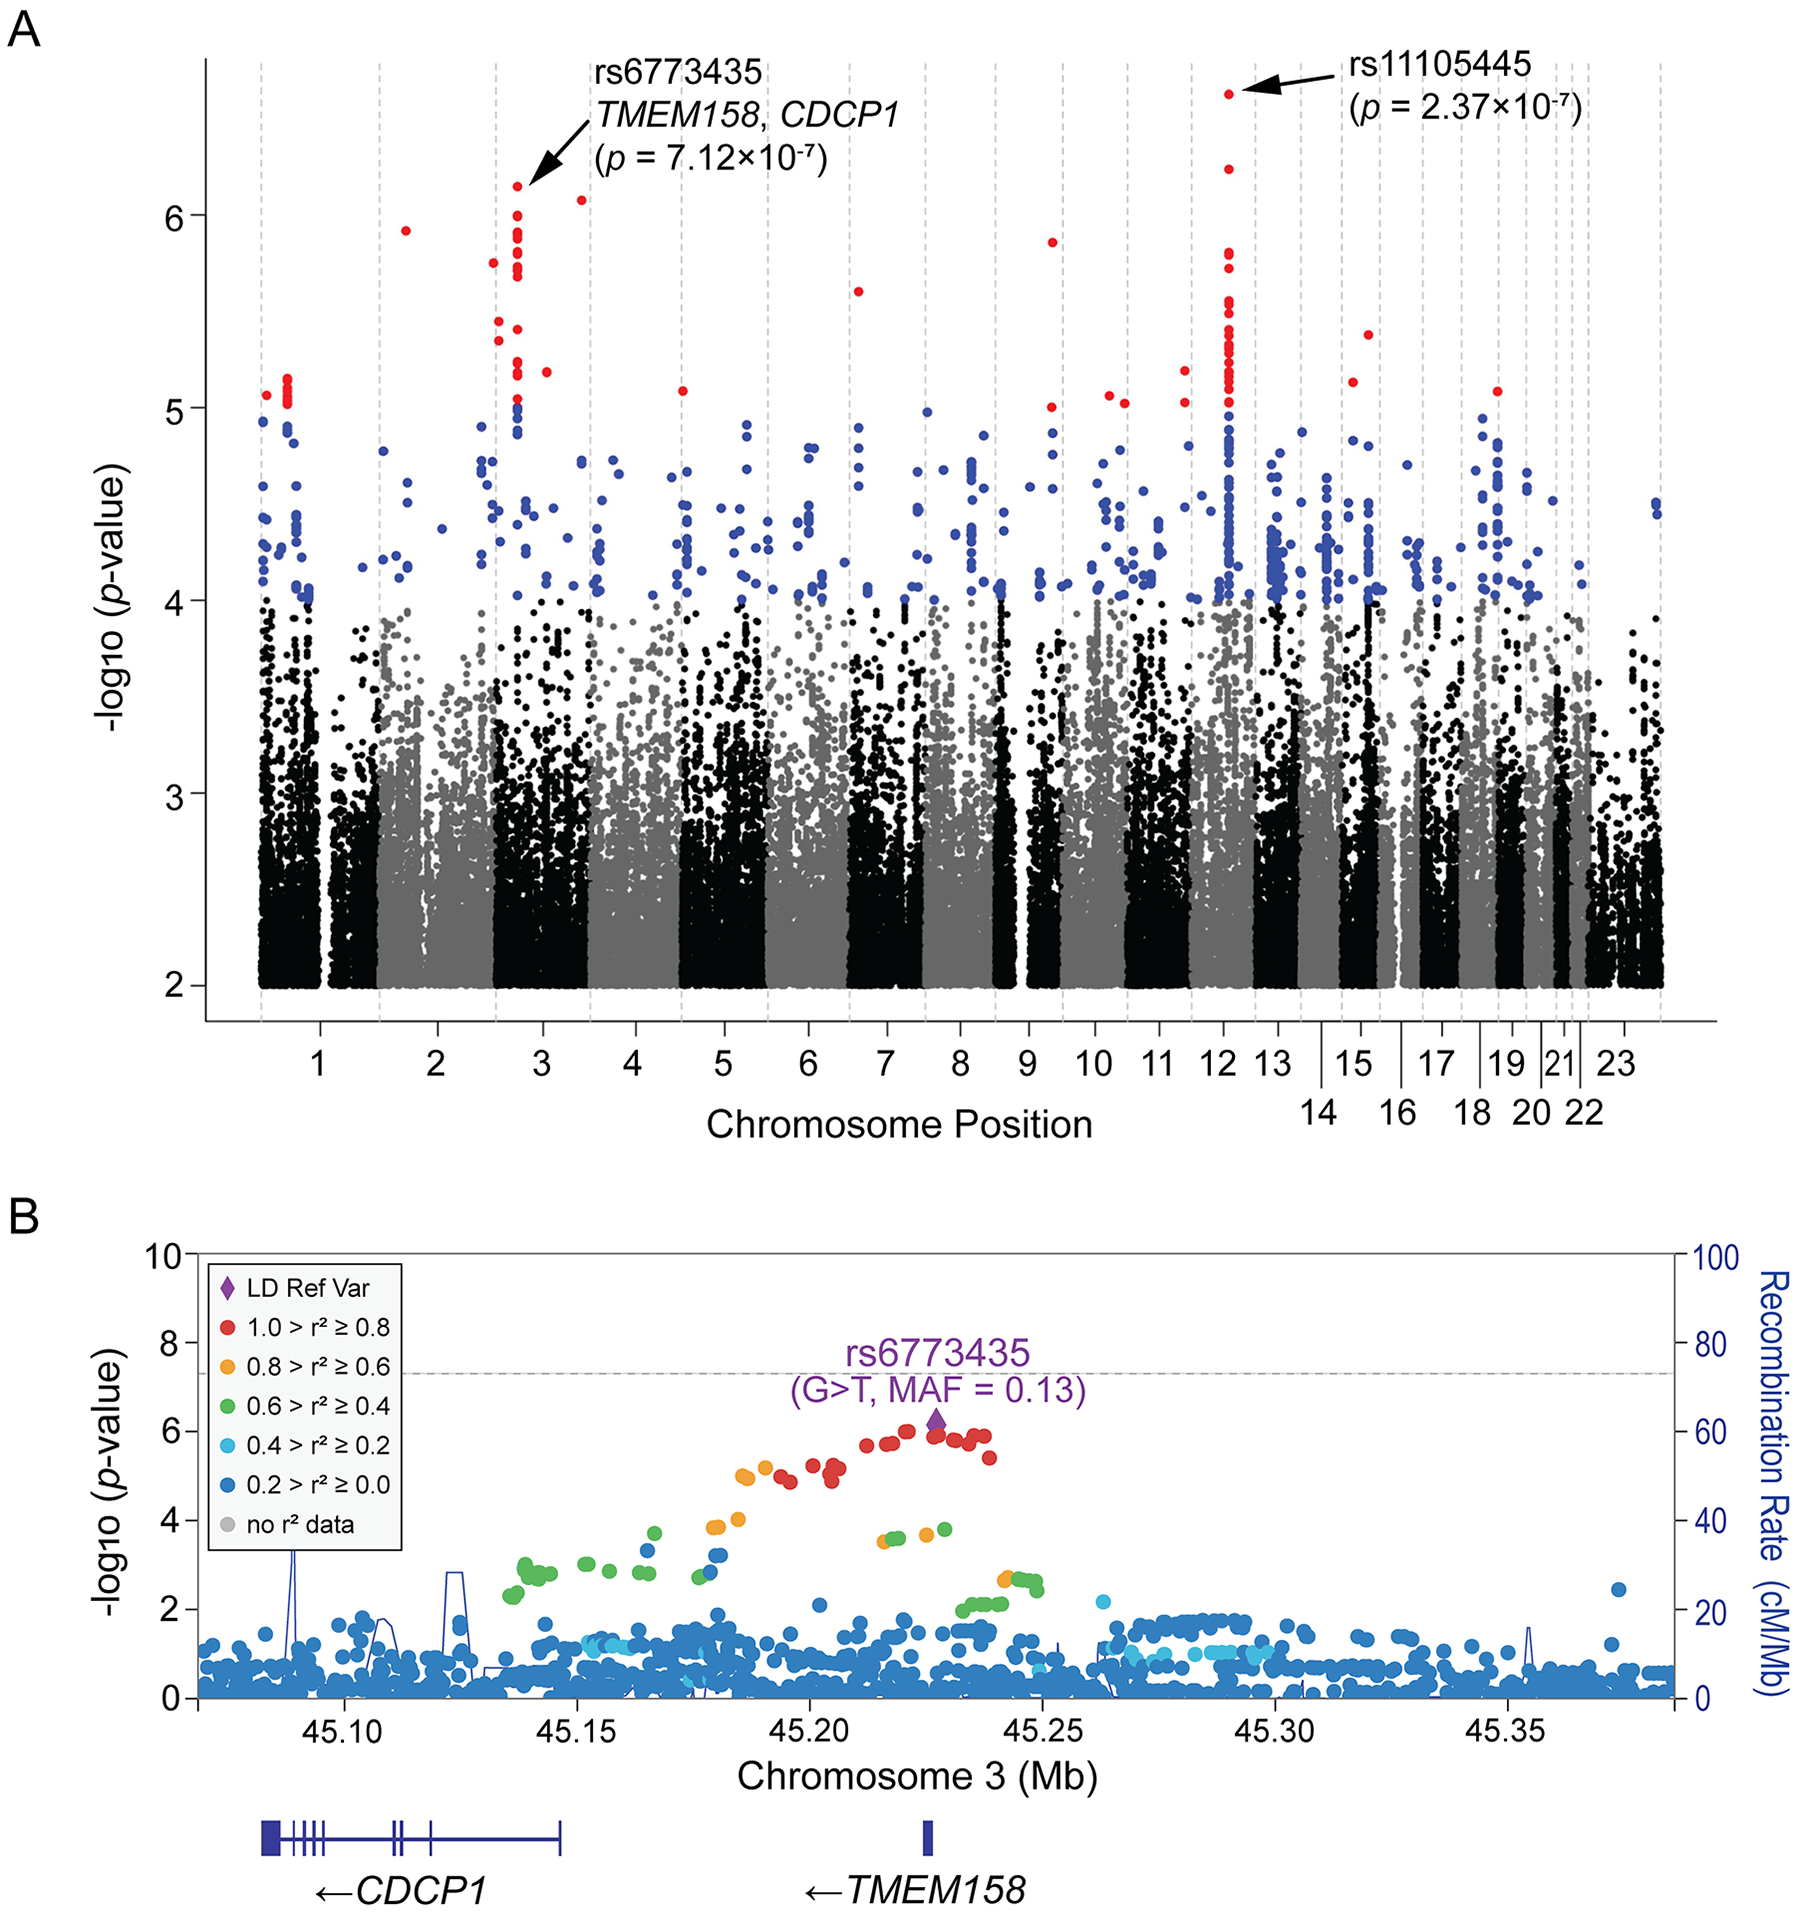
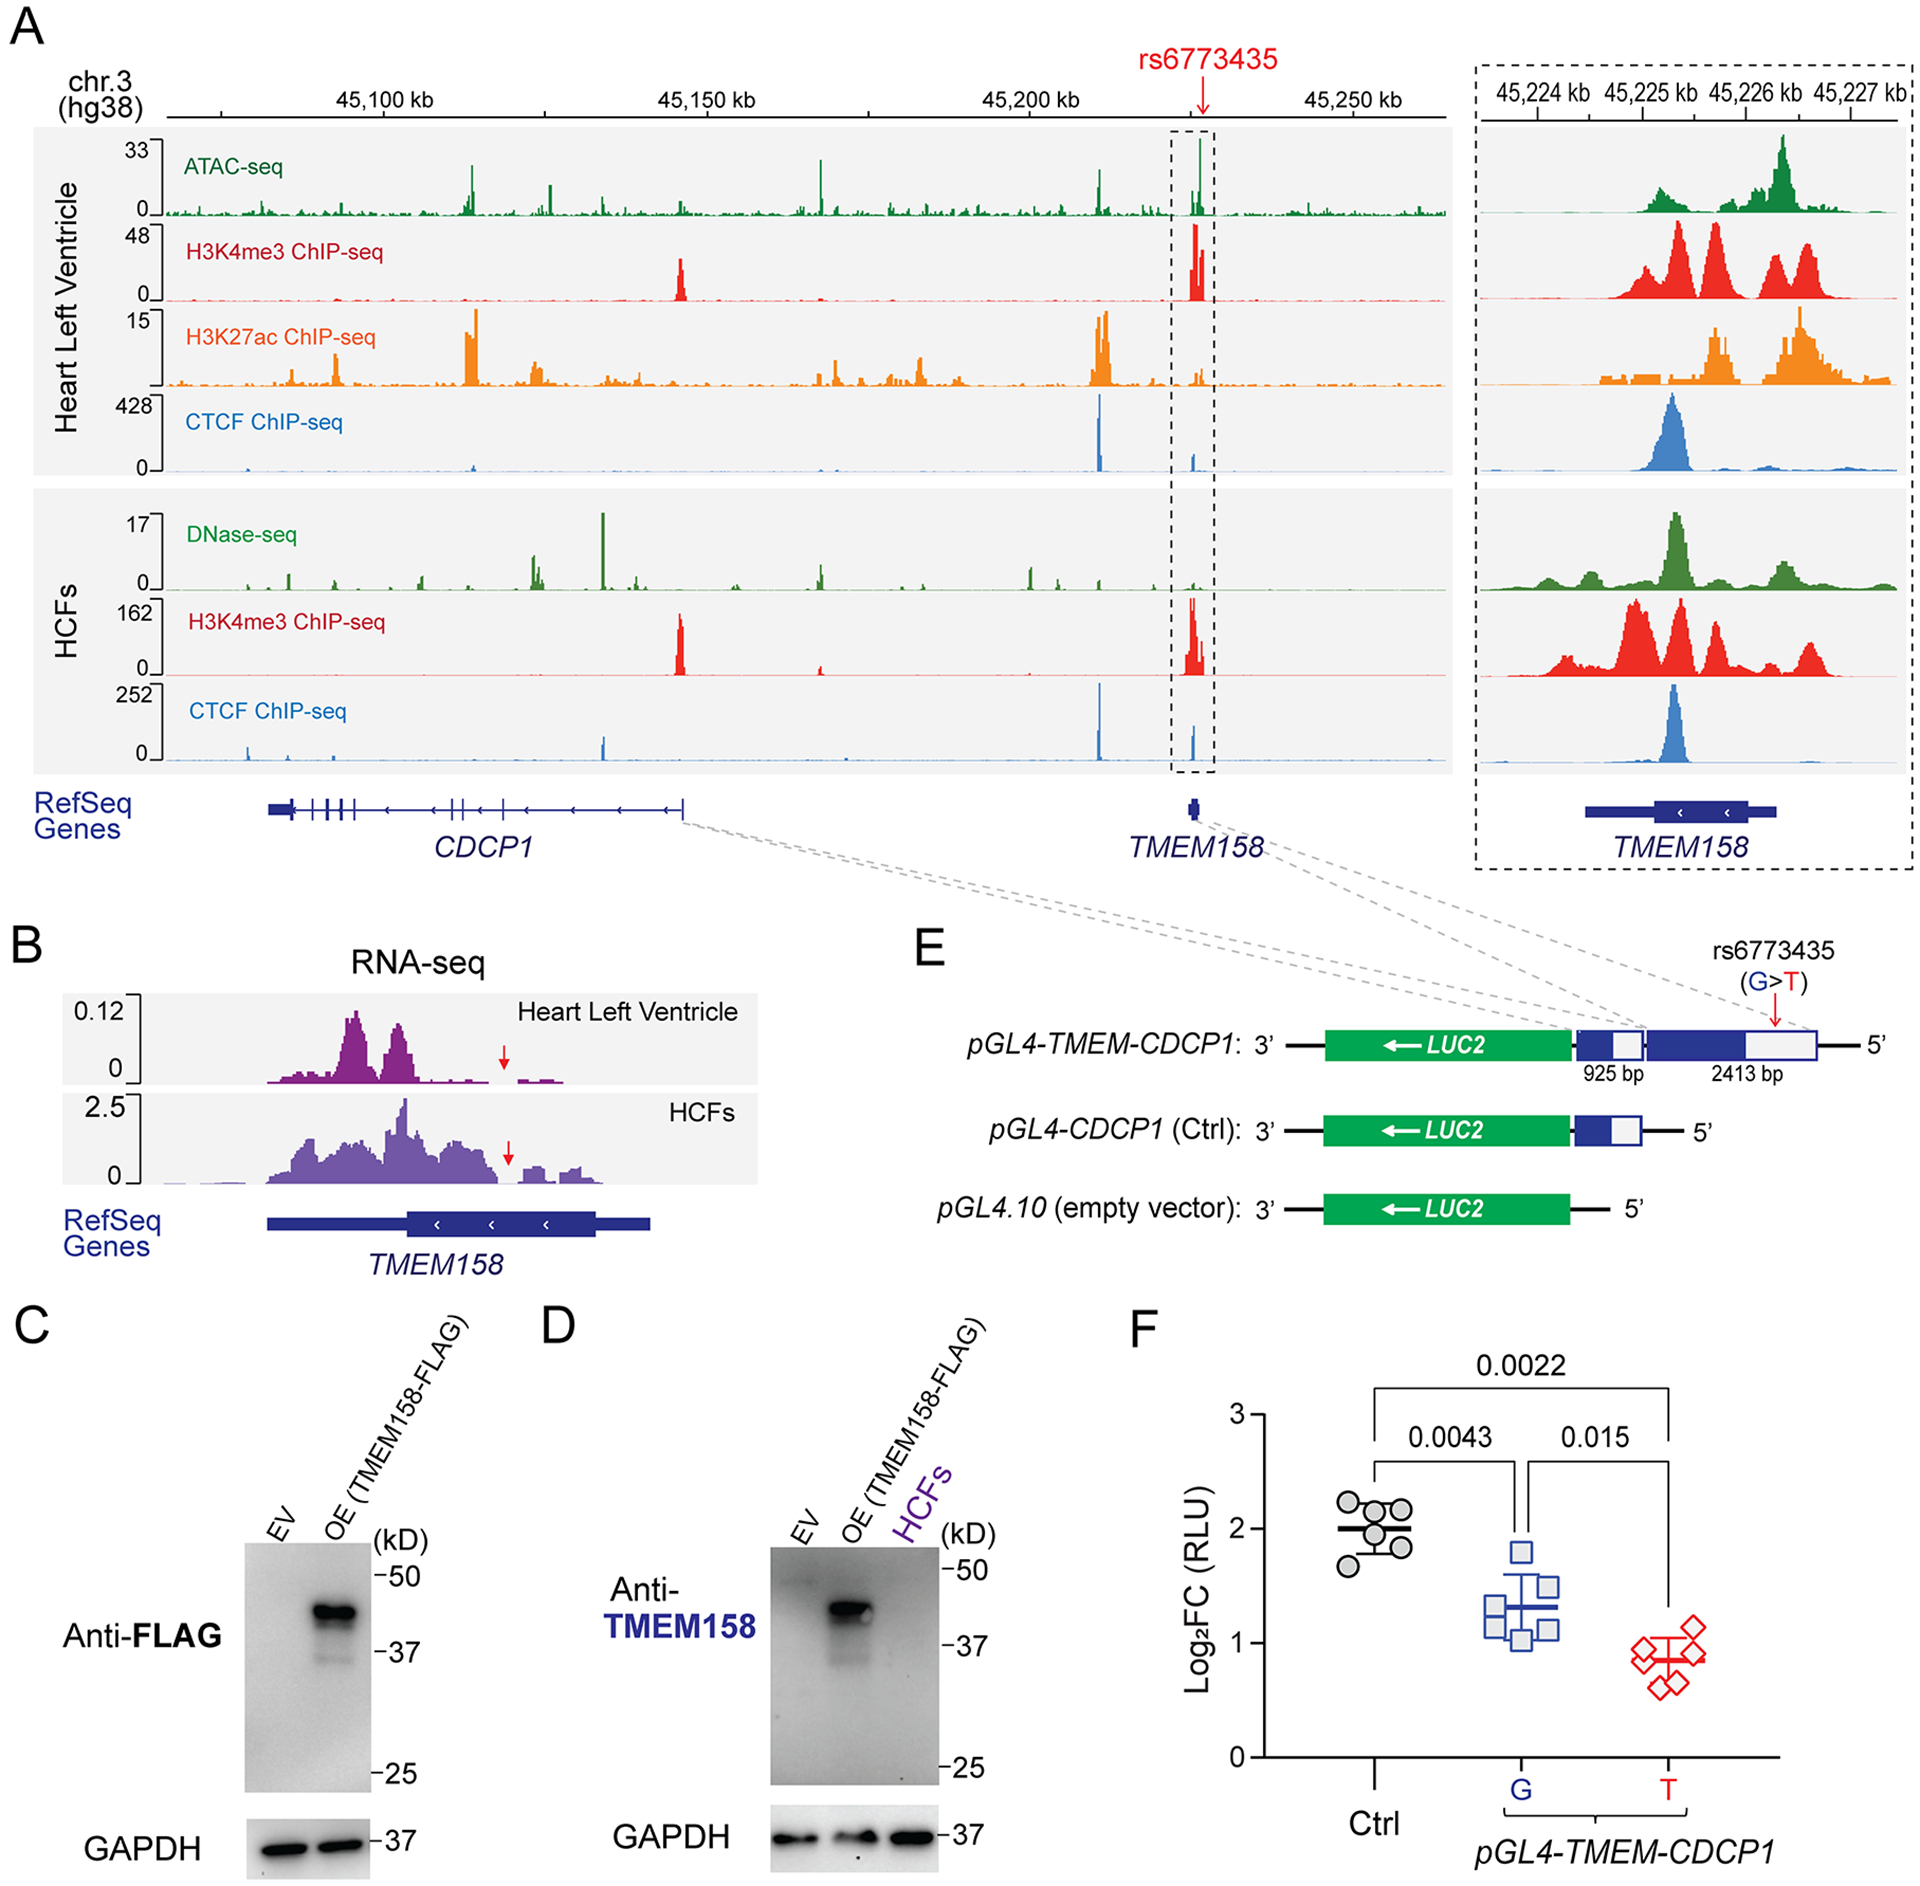
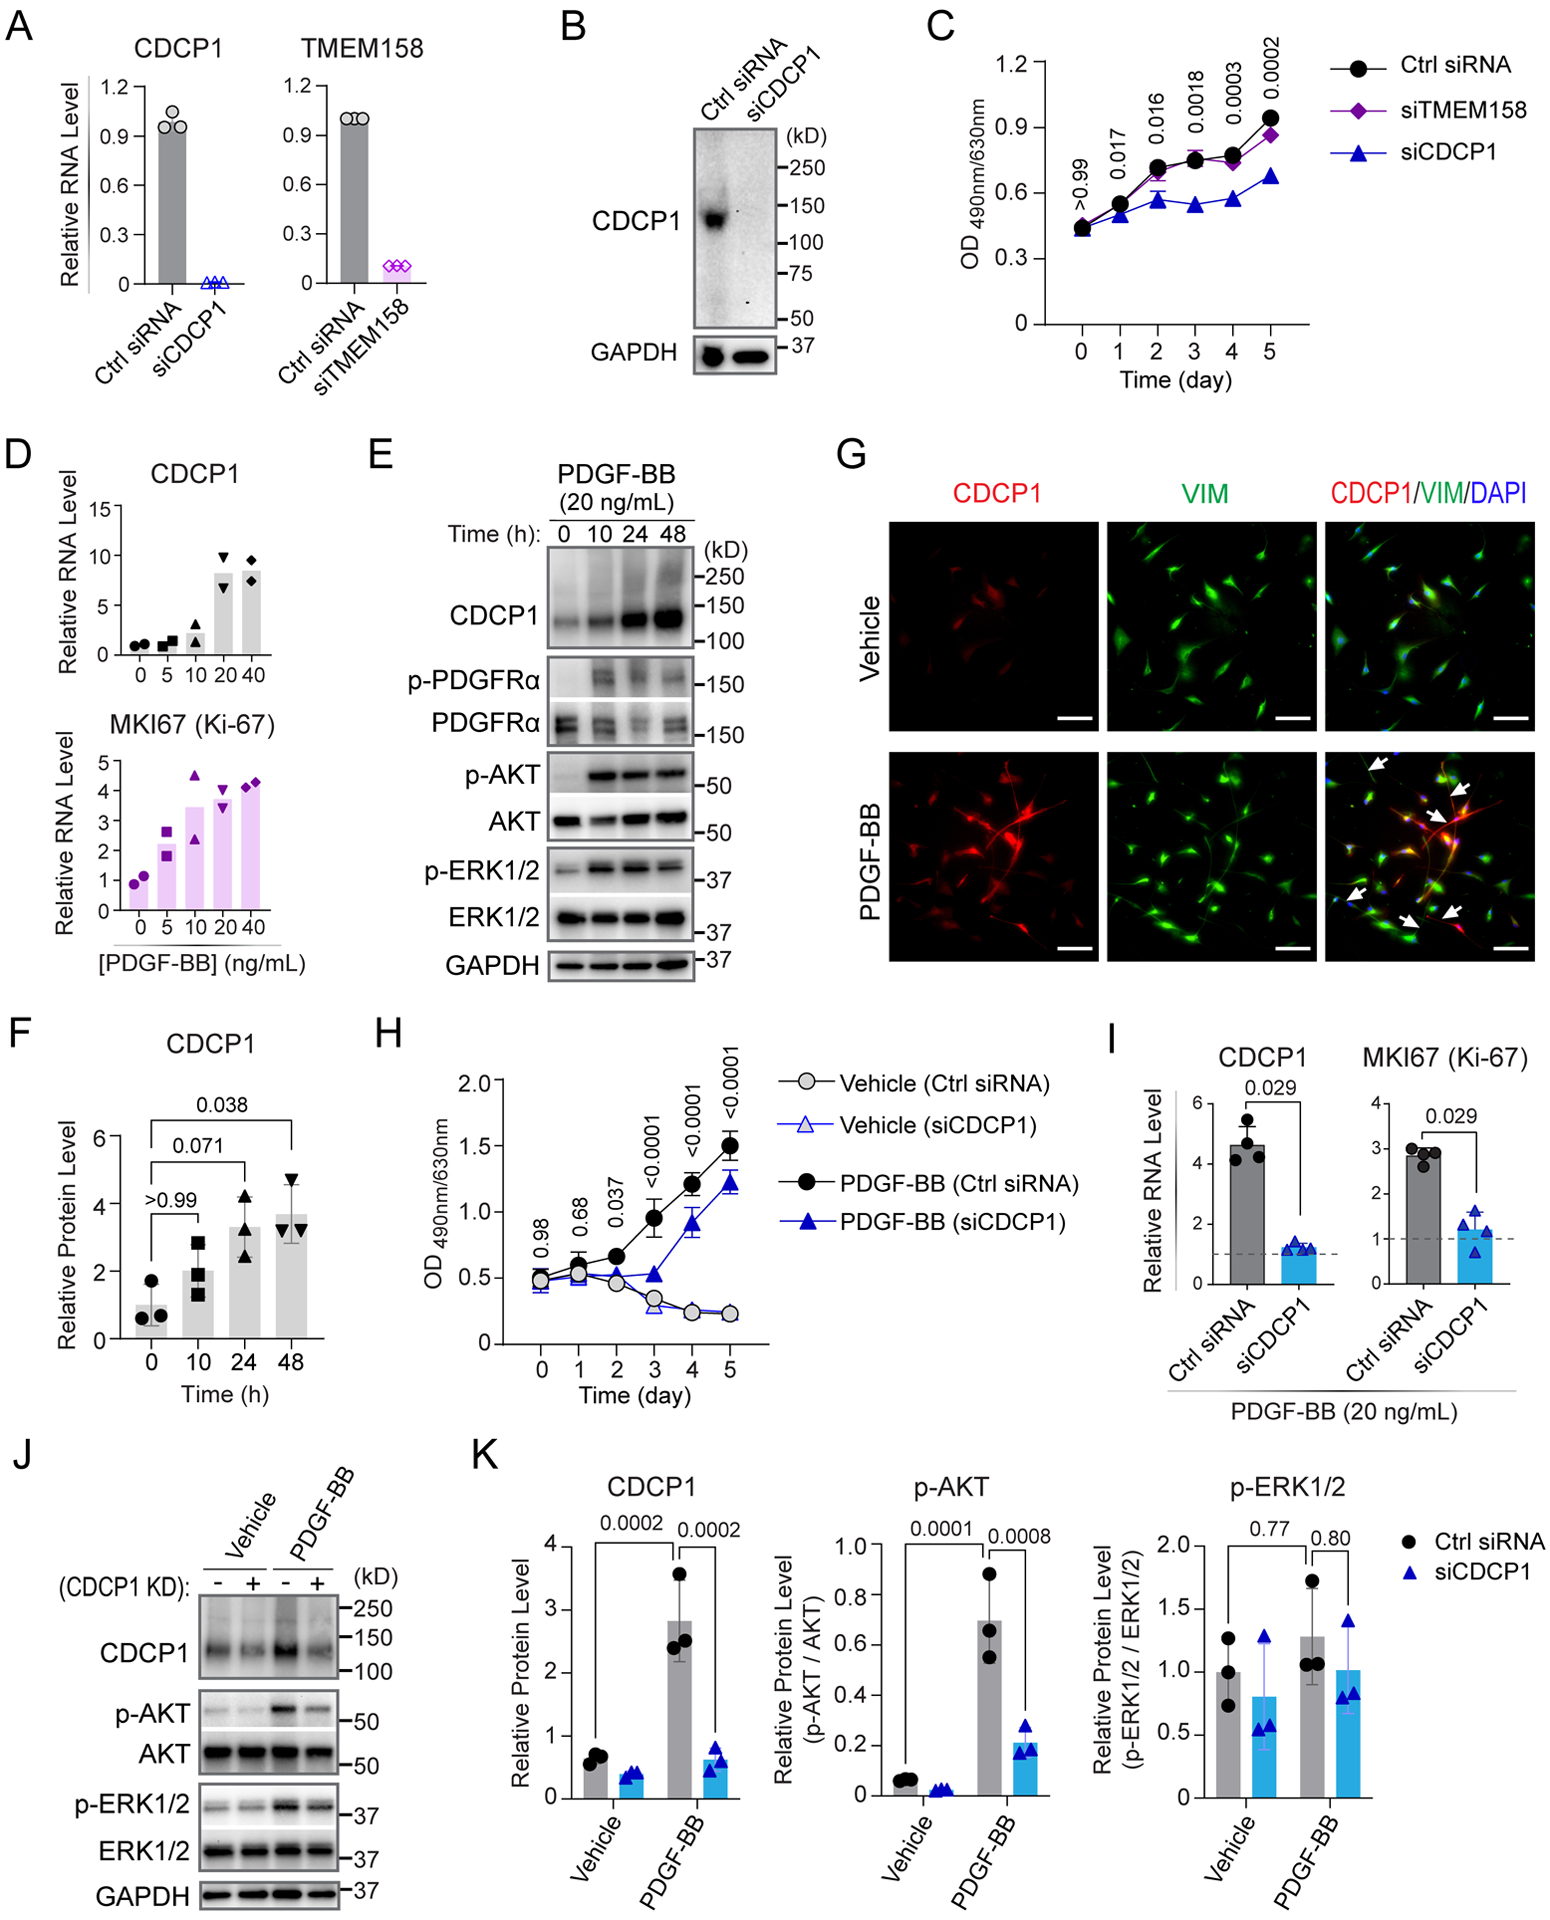
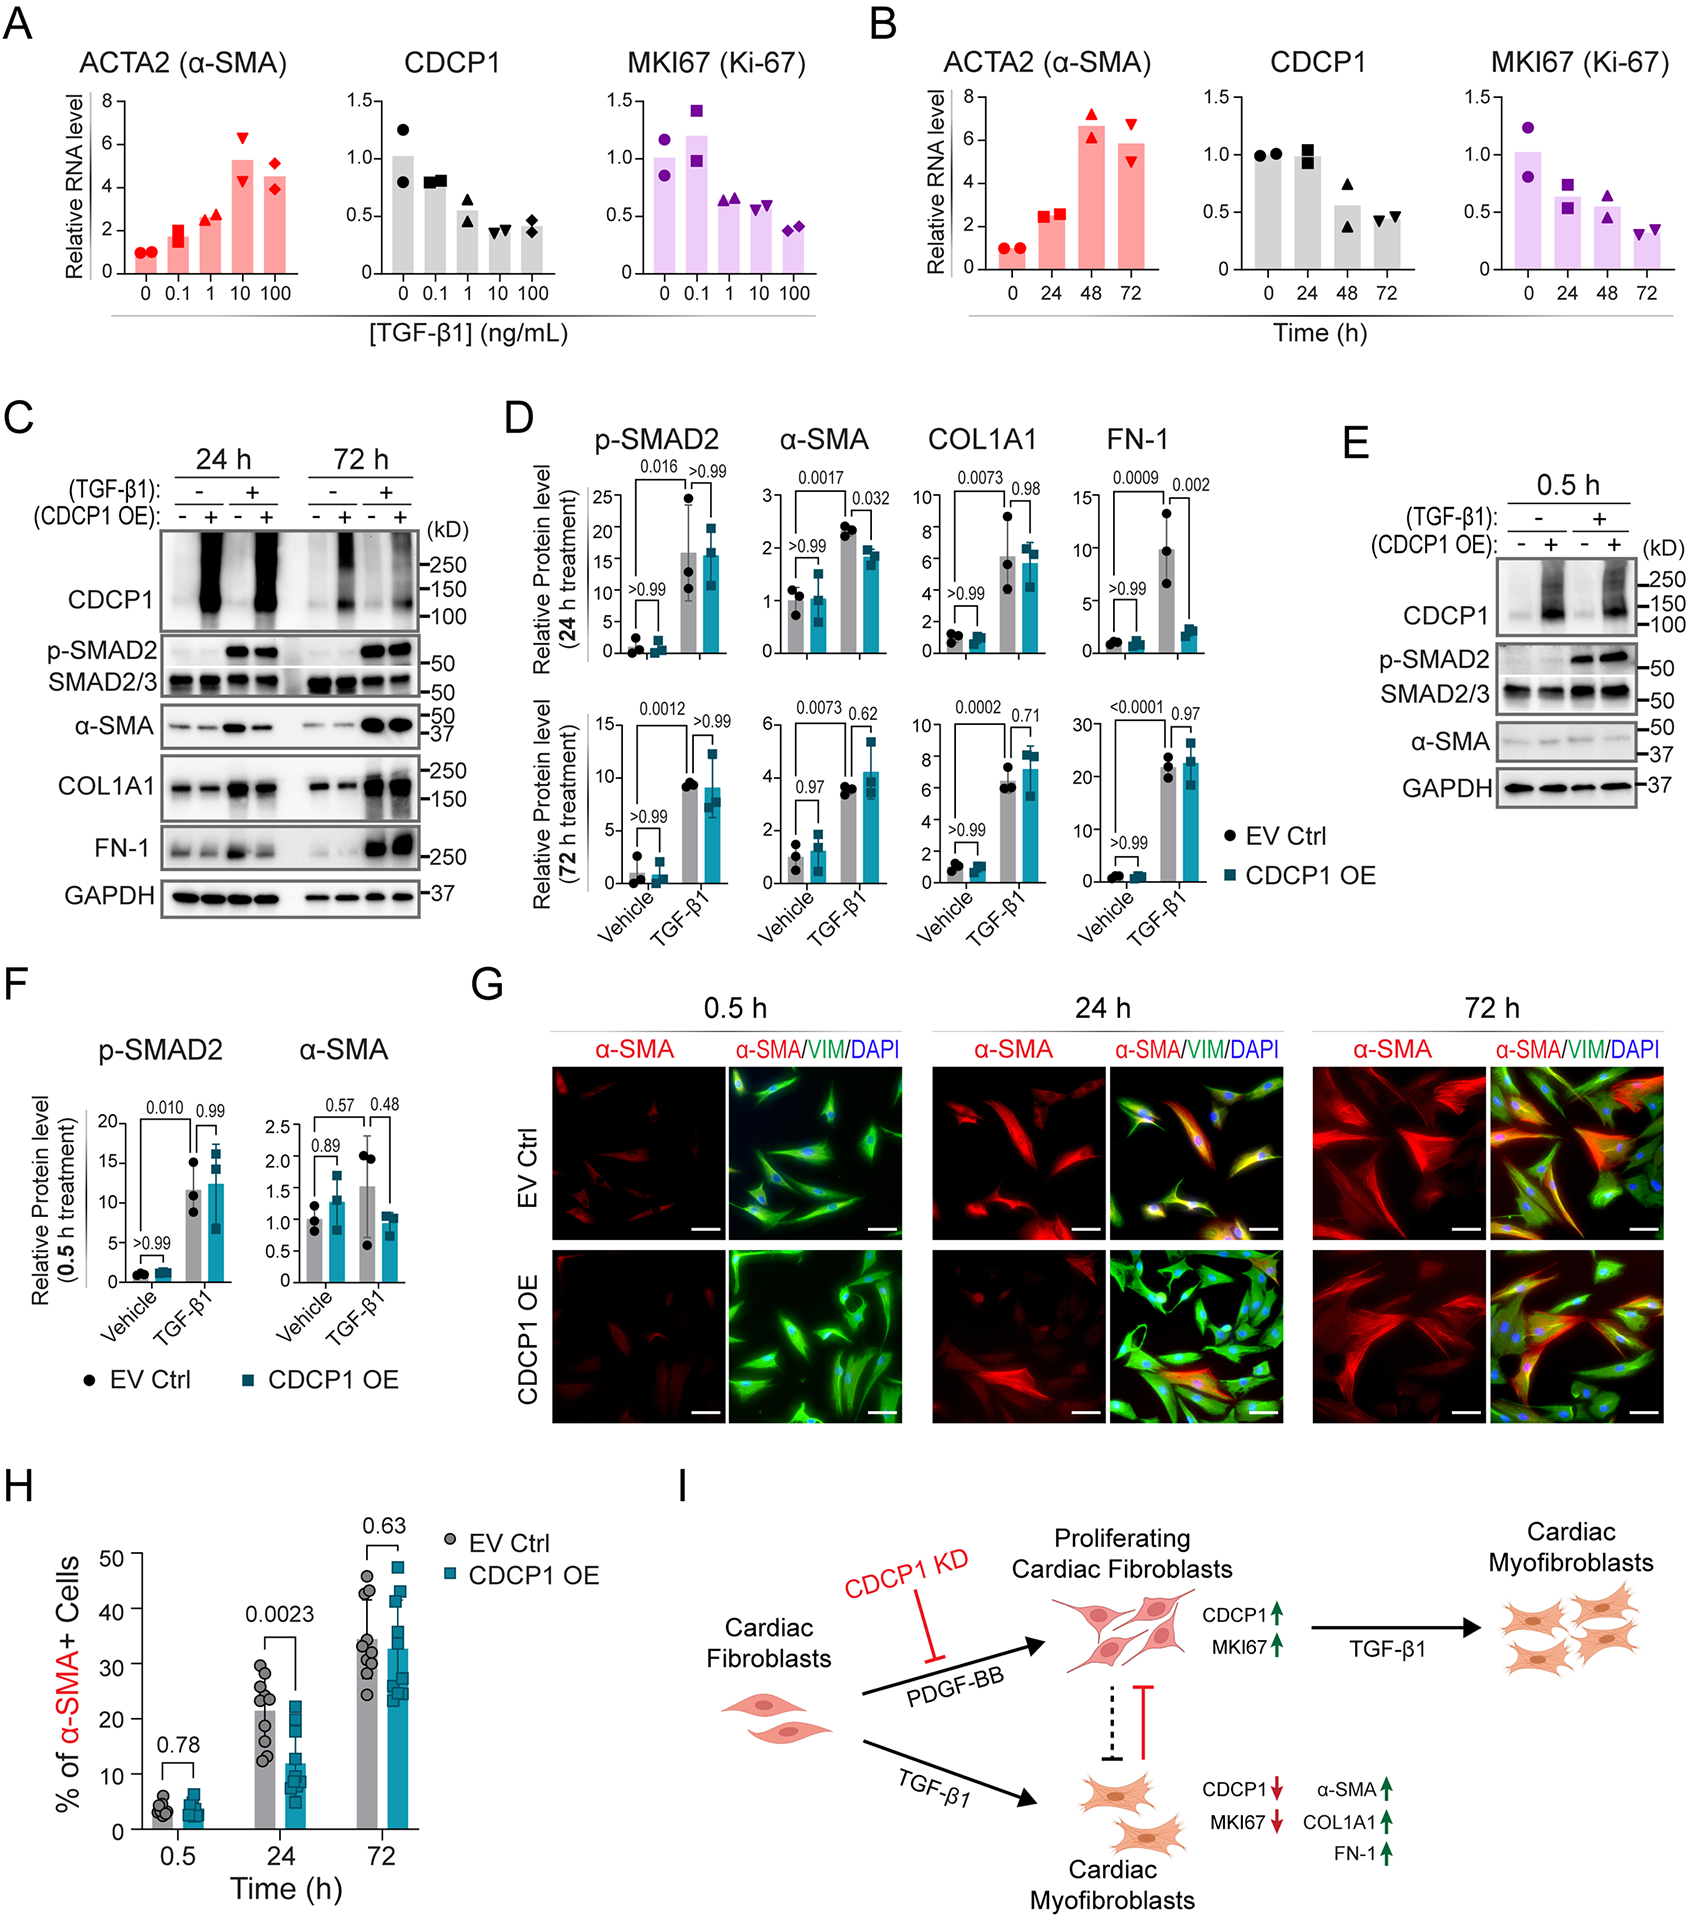
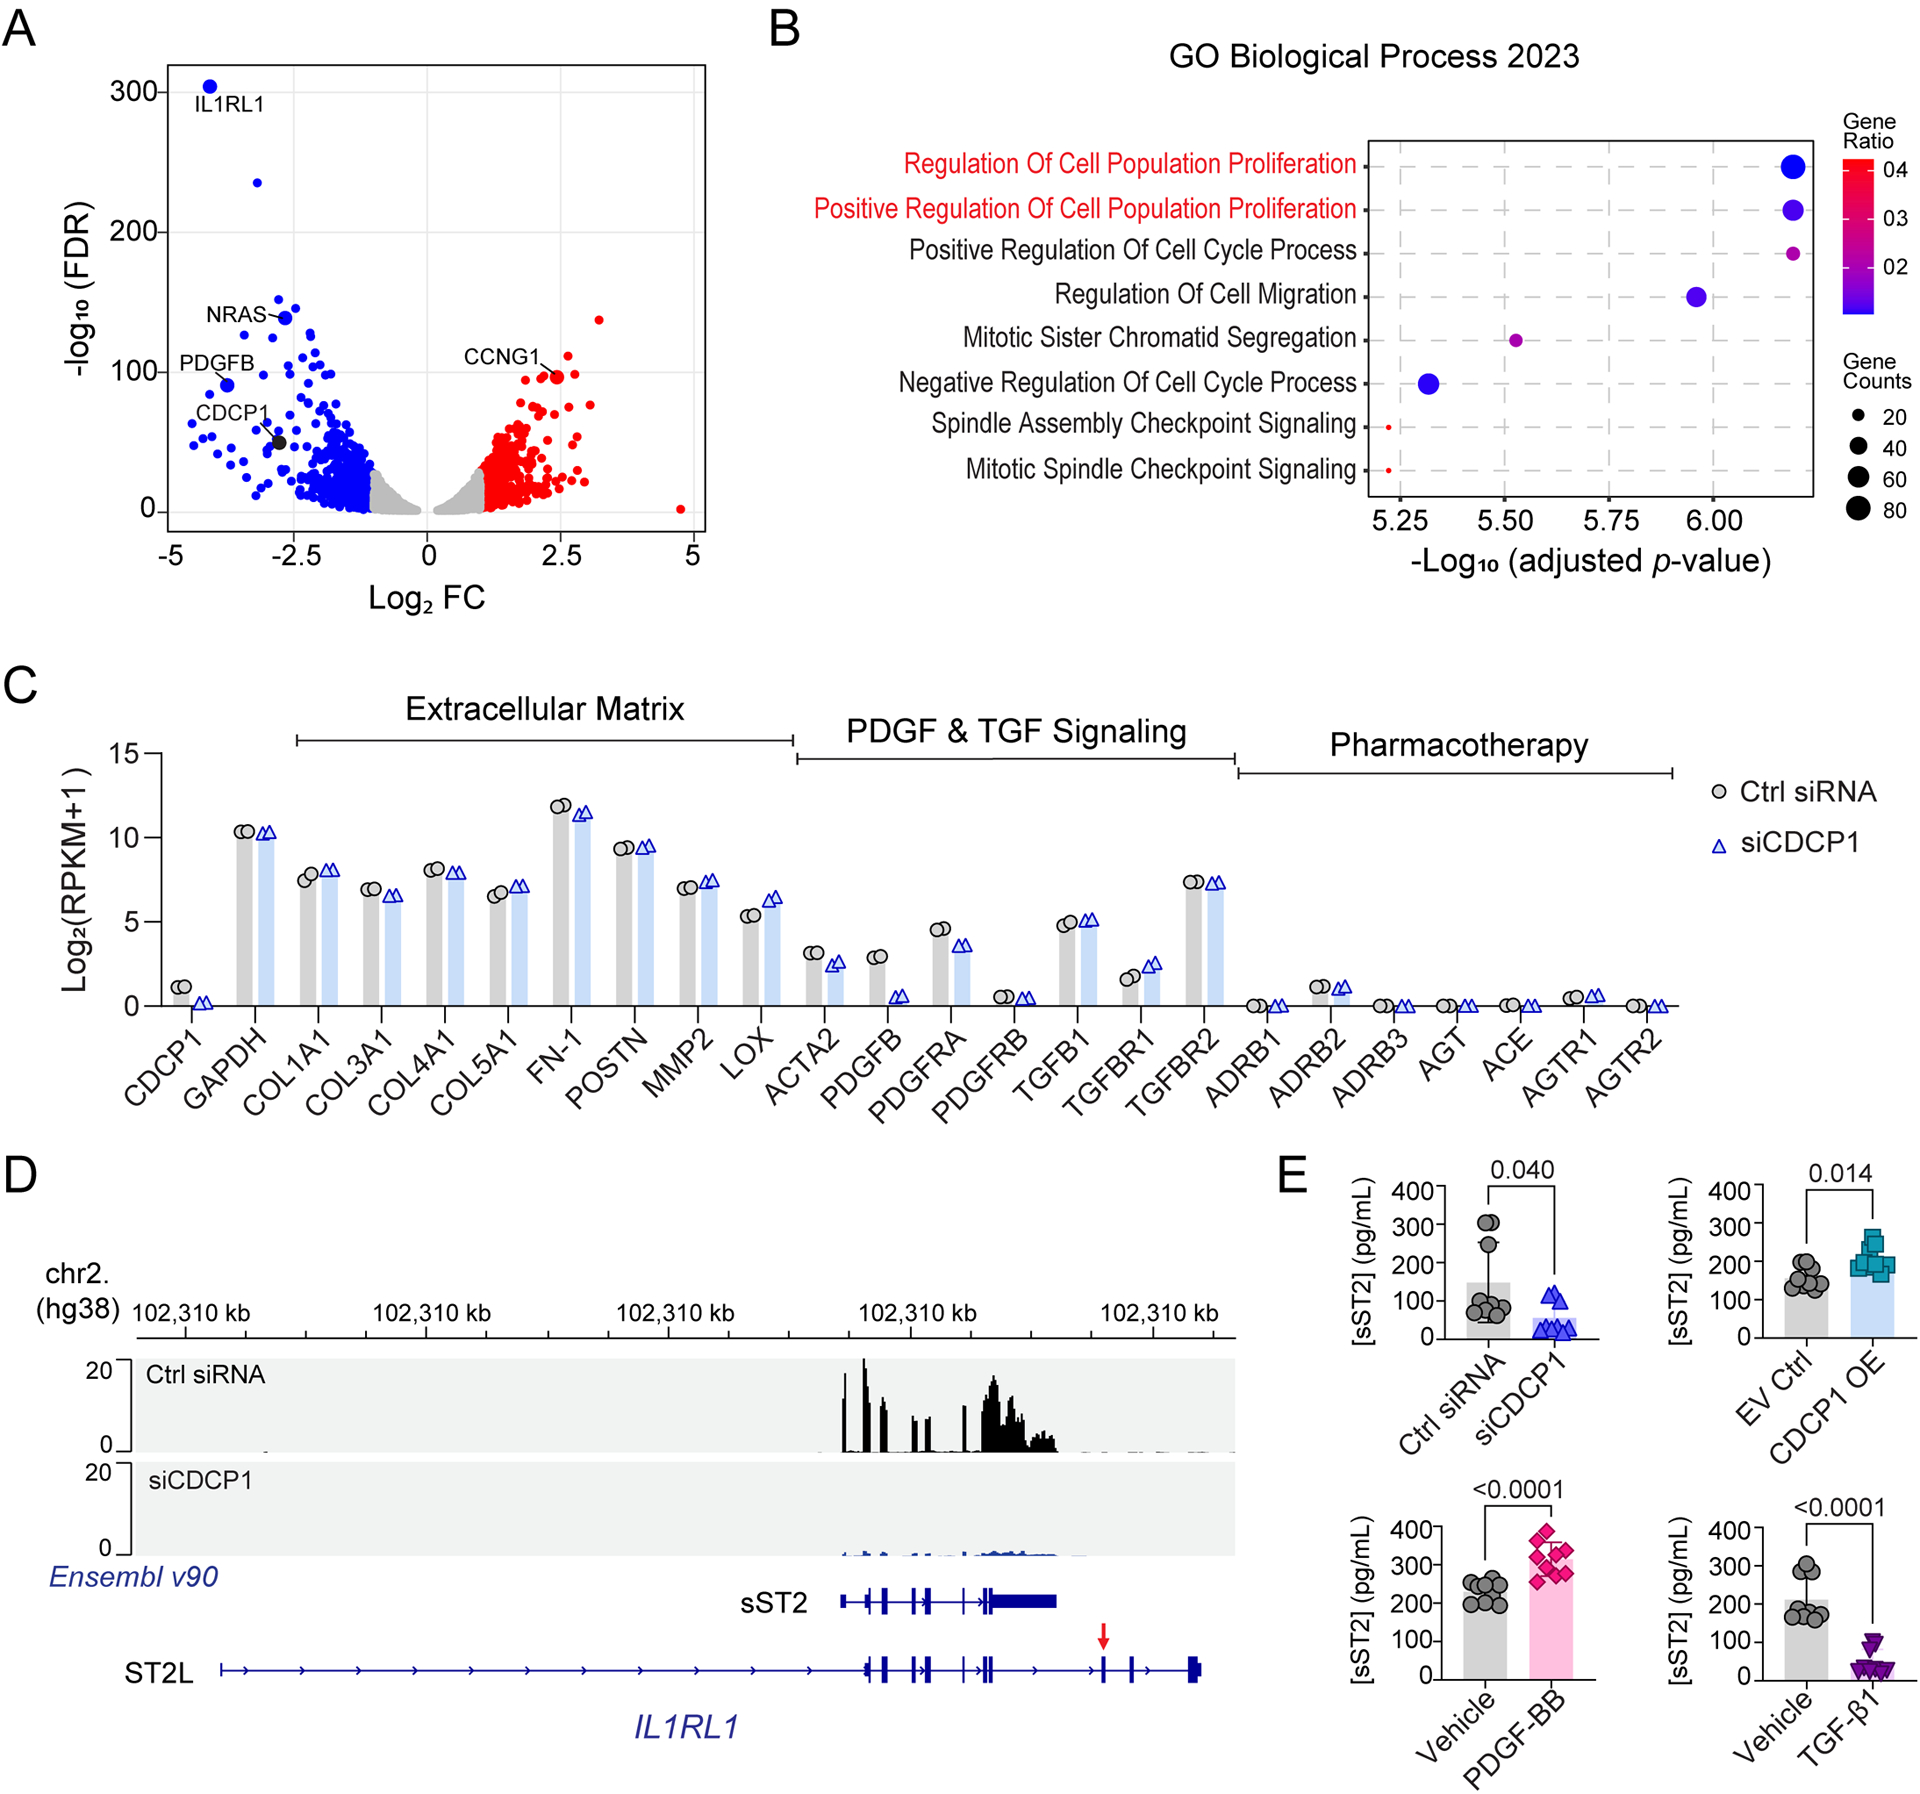
Results: The genome-wide association study identified a highly suggestive locus that mapped to the 5'-flanking region of the CDCP1 (CUB [complement C1r/C1s, Uegf, and Bmp1] domain containing protein 1) gene (rs6773435; P=7.12×10⁻⁷). The variant allele was associated with improved cardiac function and decreased CDCP1 transcription. CDCP1 expression was significantly upregulated in human cardiac fibroblasts (HCFs) in response to the PDGF (platelet-derived growth factor) signaling, and knockdown of CDCP1 significantly repressed HCF proliferation and decreased AKT (protein kinase B) phosphorylation. Transcriptomic profiling after CDCP1 knockdown in HCFs supported the conclusion that CDCP1 regulates HCF proliferation and mitosis. In addition, CDCP1 knockdown in HCFs resulted in significantly decreased expression of soluble ST2 (suppression of tumorigenicity-2), a prognostic biomarker for heart failure and inductor of cardiac fibrosis.

Conclusions: CDCP1 may play an important role in myocardial recovery in recent-onset DCM and mediates its effect primarily by attenuating cardiac fibrosis.

Keywords: cardiomyopathy, dilated; fibrosis; genetics; genome-wide association study; heart failure; humans; ventricular remodeling.


Conflict of interest statement

Disclosures R.M. Weinshilboum is a cofounder of and stockholder in OneOme, LLC. The other authors report no conflicts.

Figures

Figure 1.
Figure 1.. Myocardial Recovery in Recent Onset DCM Measured by LVEF.
(A) Violin plots that show left ventricle ejection fraction (LVEF) data for 686 DCM patients at baseline (V1) and at follow-up after pharmacotherapy (V2). Each line in the middle of the plot links LVEF data for an individual patient at V1 and V2. Many of patients had their LVEFs increase, but for some patients LVEF values did not change or decreased after pharmacotherapy. (B) Distribution of changes in LVEFs in these 686 patients after pharmacotherapy.
Figure 2.
Figure 2.. GWAS for Changes in LVEF in DCM.
(A) Manhattan plots for the GWAS of changes in LVEFs in 686 DCM patients who received pharmacotherapy. Two “top” SNPs on chromosome 12 and chromosome 3 have been highlighted. (B) Regional association (Locus Zoom) plot for the chromosome 3 SNP signal. The color of each SNP represents its’ linkage disequilibrium (LD) in a European population (the 1000 Genomics Project) with the reference SNP, rs6773435, which is colored purple. MAF = minor allele frequency.
Figure 3.
Figure 3.. Functional annotation of the chromosome 3 SNP locus.
(A) Visualization of the ENCODE epigenomic dataset in the interactive genome viewer (IGV). Panels (from top to bottom) show the physical position of the rs6773435 SNP locus on chromosome 3 based on human genome assembly (hg38); ATAC-seq to assess genome-wide chromatin accessibility, ChIP-seq for H3K4me3 (promoter marker), for H3K27ac (enhancer and promoter marker), and for CTCF (chromatin looping marker) that were generated using human left ventricle tissues; DNase-seq to assess genome-wide chromatin accessibility, ChIP-seq for H3K4me3, and for CTCF that were generated using HCFs. (ATAC-seq and H3K27ac ChIP-seq data are not available for the HCFs). Genes were annotated by the NCBI human genome RefSeq. Both the TMEM158 and CDCP1 genes are transcribed from the negative DNA strand. The dashed box on the right panel is a “zoom-in” of the SNP locus. Sequencing peaks are map to the SNP locus, which indicates that the locus is likely a transcriptional activating site. (B) RNA-seq reads generated from human heart left ventricular tissue and HCFs which map to the TMEM158 gene annotated by RefSeq. The TMEM158 open reading frame (ORF) and untranslated region (UTR) were depicted by thick and thin lines, respectively. Red arrows indicate a region of the TMEM158 ORF where no RNA-seq reads were mapped. (C) Western blots using an anti-FLAG antibody for the putative TMEM158-FLAG fusion protein after overexpression (OE) in HEK-293T cells. Empty vector (EV) control sample was obtained from cells transfected with pCMV-Entry plasmid. (D) Western blot using anti-TMEM158 antibody for endogenous TMEM158 protein in HCFs. Overexpressed TMEM158-FLAG fusion protein sample, as same as which is blotted in (C) with anti-FLAG antibody, was blotted with the anti-TMEM158 antibody, which successfully detects overexpressed TMEM158-FLAG fusion protein. However, no endogenous TMEM158 protein was detected in protein lysates from HCFs. (E) Construction of reporter gene plasmids. The pGL4.10 plasmid which includes a LUC2 reporter gene was used as the backbone construct and served as an empty vector control. The CDCP1 promoter region (925 bp) was cloned into the 5′-end of the LUC2 reporter gene and was used as positive control plasmid (pGL4-CDCP1) for CDCP1 transcriptional activity. To test the effect of the rs6773435 SNP locus on CDCP1 transcription, DNA fragments that included the rs6773435 SNP/TMEM158 locus (2413 bp) were cloned into the 5’-end of the pGL4-CDCP1 (pGL4-TMEM-CDCP1). The pGL4-TMEM-CDCP1 plasmid containing the rs6773435 SNP “G” allele was compared with that containing the “T” allele. (F) Comparison of luciferase activities in HCFs transfected with pGL4.10 (empty vector), pGL4-CDCP1 (Ctrl), pGL4-TMEM-CDCP1 “G” and pGL4-TMEM-CDCP1 “T”. Data are log2 fold change (FC) in relative light units (RLUs) when compared to pGL4.10 alone (empty vector) from biological replicates (n=6) showing as mean values ± SD. Mann-Whitney test was used to calculate the presented p-values.
Figure 4.
Figure 4.. CDCP1 is required for human cardiac fibroblast (HCF) proliferation.
(A) RT-qPCR quantification of CDCP1 and TMEM158 mRNA levels in HCFs 48 hours after knock-down by specific siRNAs. GAPDH mRNA level were quantified as internal control. Data showing are triplicate quantification of same samples. (B) Western blot assay for CDCP1 in HCFs transfected with CDCP1 siRNA (siCDCP1). GAPDH was blotted as an internal control. (C) HCF cell proliferation assays. Cells were transfected with siRNAs at day 0 and cell viability was measured by an MTS assay every 24 hours until day 5. Each dot is a mean value for three independent experiments (n=3). Error bars represent standard deviations. Statistical analysis by 2-way ANOVA with Tukey’s multiple comparisons test. P-values are shown for comparisons of Ctrl siRNA to siCDCP1 groups. (D) CDCP1 and MKI67 mRNA levels were quantified by RT-qPCR in HCFs after 24-hour treatments with PDGF-BB at different concentrations. Plots are showing duplicate RT-qPCR assays using GAPDH as internal control. (E) Western blot assay for CDCP1 in HCFs incubated with 20 ng/mL of PDGF-BB at different time points. Phosphorylated PDGFRα (p-PDGFRα) was blotted as control of PDGF-BB treatment. Two known PDGFR downstream signaling proteins, phosphorylated AKT (p-AKT) and phosphorylated ERK1/2 (p-ERK1/2) were also blotted. GAPDH was blotted as internal control. (F) CDCP1 protein level quantified from independent Western blot experiments (n=3) as represented in (E). CDCP1 bands were normalize to that of GAPDH, and then control treatment (0 h). P-values were calculated by Kruskal-Wallis test with Dunn’s multiple comparisons to 0 h of PDGF-BB treatment. (G) Immunofluorescent staining of CDCP1 and HCF marker, vimentin (VIM), in HCFs after 24-hour treatments with vehicle or PDGF-BB. HCFs morphology was changed with long “fibers” (arrow heads) can be seen after PDGF-BB treatment. Scale bars represent 200 μm. (H) HCF cell proliferation in “starving” (serum-deprived) media supplied without (Vehicle) or with 20 ng/mL of PDGF-BB. Cells were transfected with siRNAs at day 0 and cell viability was measured by an MTS assay every 24 hours until day 5. Each dot is a mean value for three independent assays. Error bars represent standard deviation. Statistical analysis by 2-way ANOVA with Tukey’s multiple comparisons test. P-values are shown for comparisons of Ctrl siRNA to siCDCP1 in the PDGF-BB treatment groups. (I) CDCP1 and MKI67 mRNA levels were quantified by RT-qPCR in HCFs 48-hour after CDCP1 knock-down and PDGF-BB treatment, with GAPDH mRNA level as internal control. RNA levels were normalized to vehicle treatment (dashed line). Data are mean values ± S.D. for independent experiments (n=4). Mann-Whitney test was used to calculate the presented p-values. (J) Western blot assay for CDCP1 and PDGFR downstream signaling proteins (p-AKT and p-ERK1/2) in HCFs with CDCP1 knock-down (KD) and 20 ng/mL of PDGF-BB treatment. GAPDH was blotted as internal control. (K) Protein levels quantified from three independent samples by Western blot assays as represented in (J). Protein bands were normalized to that of GAPDH. Levels of p-AKT and p-ERK1/2 were showed as ratios to their total protein level. P-values were calculated by ordinary one-way ANOVA with Tukey’s multiple comparisons test.
Figure 5.
Figure 5.. CDCP1 and TGF-β1-induced cardiac fibroblast-to-myofibroblast transdifferentiation.
(A) Relative mRNA levels of ACTA2, CDCP1 and MKI67 in HCFs after 48-hour treatment of TGF-β1 at different concentrations, and (B) after 10 ng/mL of TGF-β1 treatment at different time (hours). RNA levels were quantified by RT-qPCR with GAPDH level as internal control from duplicate assays. (C) Western blot for CDCP1 and other protein markers in HCFs with or without CDCP1 overexpression (OE), and with or without TGF-β1 treatment (10 ng/mL) at two time points (24 and 72 hours of treatment). Phosphorylated SMAD2 (p-SMAD2) and α-SMA were blotted for control of TGF-β1 treatment and myofibroblast transdifferentiation, respectively. Extracellular matrix (ECM) proteins including collagen type I alpha 1 chain (COL1A1), and fibronectin 1 (FN-1) were also blotted. GAPDH were blotted as internal control. (D) Relative protein level quantified from three independent samples by Western blot assays as represented in (C). Protein levels were normalized to GAPDH level and then to vehicle and empty vector control (EV Ctrl) sample. Error bars represent standard deviations of triplicate assays. P-values were calculated by ordinary one-way ANOVA with Tukey’s multiple comparisons test. (E) Western blot for CDCP1, p-SMAD2 and α-SMA in HCFs with or without CDCP1 overexpression (OE), and with or without half hour of TGF-β1 treatment (10 ng/mL). (F) Relative protein level quantified from three independent samples by Western blot assays as represented in (E). Protein levels were normalized to GAPDH level and then to vehicle and empty vector control (EV Ctrl) sample. Error bars represent standard deviations of triplicate assays. P-values were calculated by ordinary one-way ANOVA with Tukey’s multiple comparisons test. (G) Immunofluorescent (IF) staining of α-SMA and vimentin (VIM) in HCFs transfected with empty vector (EV Ctrl) and CDCP1 cDNA plasmid (CDCP1 OE) and TGF-β1 treatment (10 ng/mL) at 0.5, 24 and 72 hours. Scale bars represent 100 μm. (H) Percentage of α-SMA positive (α-SMA+) cells based on the IF staining as represented in (G). Total cell number was counted by DAPI staining. For each condition, α-SMA+ cells were counted from 10 different fields in triplicate independent wells. P-values were calculated by multiple unpaired t tests. (I) CDCP1 function in cardiac fibroblasts. PDGF-BB stimulates cardiac fibroblasts proliferation, as well as upregulation of the Maker of Proliferation Ki-67 (MKI67). Expression of CDCP1, was upregulated in PDGF-BB-stimulated proliferating cardiac fibroblasts. TGF-β1 stimulates cardiac fibroblasts-to-myofibroblasts transdifferentiation which, meanwhile, stops cardiac fibroblasts proliferation, as indicated by downregulation of MKI67 and upregulation of α-SMA (also known as Cell Growth-Inhibiting Gene 46 Protein) in cardiac myofibroblasts. Extracellular matrix genes, including COL1A1 and FN-1, were up-regulated in myofibroblasts. CDCP1 knock-down (KD) inhibits cardiac fibroblasts cell proliferation which could lead to less transdifferentiated myofibroblasts.
Figure 6.
Figure 6.. Transcriptome profiling of CDCP1 knock-down (KD) in HCFs.
(A) Volcano plot for RNA-seq identified differentially expressed genes (DEGs) in HCFs after CDCP1 KD. The X-axis is log2 fold change (FC) in RNA level when comparing the HCFs transfected with CDCP1 siRNAs (siCDCP1) to the non-target control siRNAs (Ctrl siRNA). The Y-axis is −log10 false discovery rate (FDR) calculated from duplicates. Two biological replicate RNA samples from each experiment groups were sequenced. Each dot represents a gene quantified by the RNA-seq. (B) Top pathways enriched by DEGs after CDCP1 KD (FC > 2.0; FDR < 0.05) in the Gene Ontology (GO) enrichment analysis of Biological Process. The p-value for pathway enrichment was computed from the Fisher exact test and adjusted by using the Benjamini-Hochberg method for correction for multiple hypotheses testing. (C) Gene expression level in HCFs quantified by RNA-seq. RNA level of CDCP1, GAPDH, and genes function in extracellular matrix, PDGF and TGF signaling, and genes involved in the mechanism of actions of standard DCM pharmacotherapy were plotted. RPKM = Reads Per Kilobase of transcript, per Million mapped reads. (D) RNA-seq reads mapping to the IL1RL1 gene in HCFs. Panels (from top to bottom) are physical position of the IL1RL1 gene on chromosome 2 based on the human genome assembly hg38; RNA-seq reads mapped to the IL1RL1 gene in HCFs transfected with non-targeting control (Ctrl siRNA) and CDCP1 siRNA (siCDCP1); Two Ensembl (v90) annotated IL1RL1 transcript variants which encode soluble ST2 (sST2) and membrane-bound ST2 (ST2L). The red arrow indicates the exon which encodes the transmembrane domain of ST2L. RNA-seq reads mapped to the IL1RL1 exons which encode sST2, and those RNA-seq reads are significantly less in CDCP1 KD (siCDCP1) sample. (E) sST2 protein levels in HCF culture media quantified by ELISA assay. HCFs were transfected with siCDCP1 for KD (up left), CDCP1 cDNA plasmid for OE (up right), and treated with 20 ng/mL of PDGF-BB (down left), or 10 ng/uL of TGF-β1 (down right) for 48, 72 and 96 hours. For each group, three biological replicates were quantified at three time points (n=9). Data are presented as mean values ± S.D. Mann-Whitney test was used to calculate the presented p-values.

References

    1. Go AS, Mozaffarian D, Roger VL, Benjamin EJ, Berry JD, Blaha MJ, Dai S, Ford ES, Fox CS, Franco S, et al. Heart Disease and Stroke Statistics—2014 Update: A Report From the American Heart Association. Circulation. 2014;129:e28–e292. doi: 10.1161/01.cir.0000441139.02102.80 - DOI - PMC - PubMed
    1. Rosenbaum AN, Agre KE, Pereira NL. Genetics of dilated cardiomyopathy: practical implications for heart failure management. Nat Rev Cardiol. 2020;17:286–297. doi: 10.1038/s41569-019-0284-0 - DOI - PubMed
    1. McMurray JJ, Packer M, Desai AS, Gong J, Lefkowitz MP, Rizkala AR, Rouleau JL, Shi VC, Solomon SD, Swedberg K, et al. Angiotensin-neprilysin inhibition versus enalapril in heart failure. N Engl J Med. 2014;371:993–1004. doi: 10.1056/NEJMoa1409077 - DOI - PubMed
    1. McNamara DM, Starling RC, Cooper LT, Boehmer JP, Mather PJ, Janosko KM, Gorcsan J 3rd, Kip KE, Dec GW, Investigators I. Clinical and demographic predictors of outcomes in recent onset dilated cardiomyopathy: results of the IMAC (Intervention in Myocarditis and Acute Cardiomyopathy)-2 study. J Am Coll Cardiol. 2011;58:1112–1118. doi: 10.1016/j.jacc.2011.05.033 - DOI - PMC - PubMed
    1. Kramer DG, Trikalinos TA, Kent DM, Antonopoulos GV, Konstam MA, Udelson JE. Quantitative evaluation of drug or device effects on ventricular remodeling as predictors of therapeutic effects on mortality in patients with heart failure and reduced ejection fraction: a meta-analytic approach. J Am Coll Cardiol. 2010;56:392–406. doi: 10.1016/j.jacc.2010.05.011 - DOI - PMC - PubMed

Publication types