. 2023 Dec 12;11(6):e0529222.
doi: 10.1128/spectrum.05292-22. Epub 2023 Oct 6.

Dimethylpolysulfides production as the major mechanism behind wheat fungal pathogen biocontrol, by Arthrobacter and Microbacterium actinomycetes

Affiliations

Dimethylpolysulfides production as the major mechanism behind wheat fungal pathogen biocontrol, by Arthrobacter and Microbacterium actinomycetes

Aline Ballot et al. Microbiol Spectr. .

Abstract

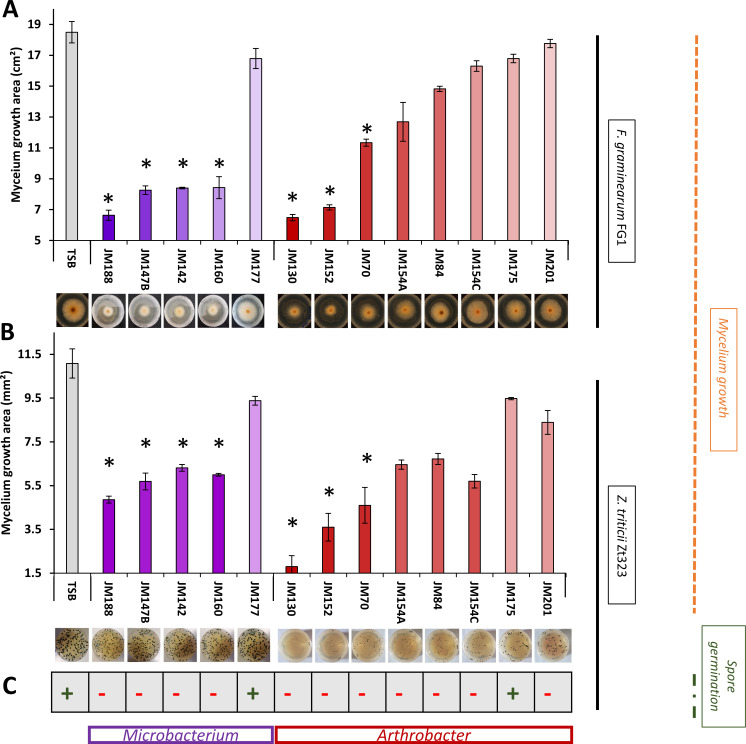
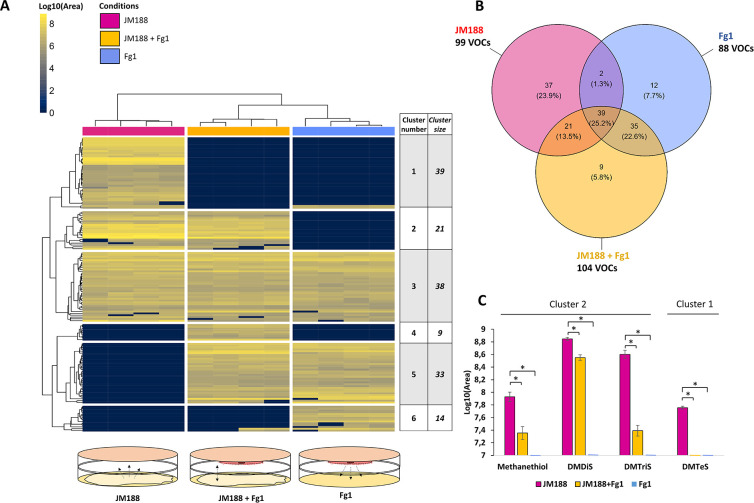
As the management of wheat fungal diseases becomes increasingly challenging, the use of bacterial agents with biocontrol potential against the two major wheat phytopathogens, Fusarium graminearum and Zymoseptoria tritici, may prove to be an interesting alternative to conventional pest management. Here, we have shown that dimethylpolysulfide volatiles are ubiquitously and predominantly produced by wheat-associated Microbacterium and Arthrobacter actinomycetes, displaying antifungal activity against both pathogens. By limiting pathogen growth and DON virulence factor production, the use of such DMPS-producing strains as soil biocontrol inoculants could limit the supply of pathogen inocula in soil and plant residues, providing an attractive alternative to dimethyldisulfide fumigant, which has many non-targeted toxicities. Notably, this study demonstrates the importance of bacterial volatile organic compound uptake by inhibited F. graminearum, providing new insights for the study of volatiles-mediated toxicity mechanisms within bacteria-fungus signaling crosstalk.

Keywords: Arthrobacter; Bacteria-fungus interactions; Microbacterium; biocontrol; mycotoxins; volatile organic compounds (VOCs); wheat fungal pathogens.


Conflict of interest statement

The authors declare no conflict of interest.

Figures

Fig 1
Fig 1
In vitro mycelial growth and spore germination inhibition effects by volatiles from Microbacterium and Arthrobacter rhizobacteria on F. graminearum Fg1 and Z. tritici IPO323. (A) Mycelial growth area of F. graminearum Fg1 (mean ± SE, n = 3), (B) Mycelial growth area of Z. tritici IPO323 (mean ± SE, n = 3), (C) Presence (+) or absence (−) of spore germination of Z. tritici IPO323. TSB: mycelial growth of pathogens exposed to sterile TSB medium (negative control). Asterisks indicate statistically significant differences based on pairwise comparisons between bacterial VOCs-exposed and TSB-exposed fungal cultures (Student’s t test, P < 0.05).
Fig 2
Fig 2
Comparison of volatilomic profiles across rhizobacteria strains with contrasted antifungal activities. (A and B) PCA were performed on integrated SPME/GC-MS peaks from Microbacterium (A) and Arthrobacter strains (B). Ellipses indicate the confidence interval at 0.95. (C and D) Venn diagram representing the number of unique and shared VOCs in each of the two Microbacterium groups of strains (C) and Arthrobacter groups of strains (D). (E) List of VOCs detected only in Microbacterium or Arthrobacter antifungal strains, annotated based on their mass spectra and calculated linear Kovats retention indices (RIs), and given with their molecular formula, identification (ID) score levels in % and CAS number. For each VOC, the number of strains producing it within the high antifungal (+) or low antifungal (−) group genera is indicated. #VOCs present exclusively in high antifungal strains from both genera.
Fig 3
Fig 3
DMPS volatile peak areas detected in the headspace of the cultures of the five Microbacterium and nine Arthrobacter strains by SPME/GC-MS. (A) Peak areas of methanethiol, (B) peak areas of dimethyl disulfide (DMDiS), (C) peak areas of dimethyl trisulfide (DMTriS), and (D) peak areas of dimethyl tetrasulfide (DMTeS). Error bars represent mean ± SE, n = 3–4. Different letters show statistically significant differences (Kruskal-Wallis test, Dunn’s test post hoc test, P < 0.05) between strains of the same bacterial genus. Juxtaposed gradients indicate relative levels of fungal-growth inhibition of the respective strains.
Fig 4
Fig 4
In vitro mycelial growth inhibition effects by pure DMDiS and DMTriS volatiles on F. graminearum Fg1 and Z. tritici IPO323. (A) Radial growth inhibition (%) on Fg1 and IPO323 mycelium by increasing concentrations of DMDiS ranging from 11.7 to 352.5 nmol/cm3. (B) Radial growth inhibition (%) on Fg1 and IPO323 mycelium by increasing concentrations of DMTriS ranging from 1.2 to 58.7 nmol/cm3. (C) Table indicating minimum inhibitory concentration (MIC) values of both DMPS on Fg1 and IPO323. (D) Radial growth inhibition (%) on Fg1 mycelium by three combinations of DMDiS and DMTriS concentrations: [C1 + C1′] = 11.7 + 1.2, [C2 + C2′] = 82.2 + 11.7, and [C3 + C3′] = 117.5 + 18.8 nmol/cm3 (dark gray), compared with added inhibitory effects of single DMDiS and DMTriS corresponding concentrations (stacked gray bars). Error bars represent mean − SE (A AND B) or mean ± SE (D), n = 3.
Fig 5
Fig 5
VOCs produced by JM188 and Fg1 alone or in confrontation. (A) Hierarchical clustering and heat map analyses of VOC profiles from JM188 and Fg1 control conditions and from confrontation conditions (JM188 + Fg1). Columns represent VOC profiles from four replicates per condition. Rows represent the peak area of each VOC (peak area in log10). The juxtaposed table indicates the cluster number from 1 to 6 and the number of VOCs included in each cluster. (B) Venn diagram representing shared and specific VOCs from the three conditions in number and percentage of total VOCs. (C) Quantification of DMPS peaks areas (mean ± SE, n = 4) for methanethiol, DMDiS, DMTriS, and DMTeS in JM188 and Fg1 controls, and in JM188 + Fg1 confrontation. Asterisks indicate statistically significant differences with the JM188 control condition (Student’s t test, P < 0.05).
Fig 6
Fig 6
Mycotoxins concentrations in Fg1 metabolite crude extract of non-exposed (control) and M188 volatile exposed conditions. (A) DON and 3 of the 15 ADON mycotoxins concentrations in crude secondary metabolite extracts of Fg1. Bars represent means ± standard error (SE), n = 4. (B) Summary of mycotoxin detection parameters in LC-MS.
Fig 7
Fig 7
Quantification by SPME/GC-MS of DMDiS, DMTriS after 3 days in petri headspace, in presence or absence of Fg1. (A) Experimental setup for exposing Fg1 mycelium to DMPS volatile synthetic compounds in vitro. (B) Quantification of DMPS peak areas (mean ± SE, n = 4) in petri dishes for PDA control and Fg1 mycelium culture conditions. Equivalents of 82.2 and 11.7 nmol/cm3 of DMDiS and DMTriS were added in petri dish assemblages at J0 (each concentration corresponds to inhibitory concentration of Fg1 mycelial growth). Asterisks indicate statistically significant differences based on pairwise comparisons between control and Fg1 culture conditions (Wilcoxon test, P < 0.05). (C) Quantification of DMPS peak areas (mean ± SE, n = 4) in petri dishes for PDA control and Fg1 mycelium culture conditions. Equivalents of 0.94 and 0.47 nmol/cm3 of DMDiS and DMTriS were added in petri dish assemblages at J0. They are both under inhibitory concentrations of Fg1 mycelial growth and under saturation concentrations in GC-MS.

References

    1. Simón MR, Börner A, Struik PC. 2021. Editorial: fungal wheat diseases: etiology, breeding, and integrated management. Front Plant Sci 12:671060. doi: 10.3389/fpls.2021.671060 - DOI - PMC - PubMed
    1. Turner JA, Chantry T, Taylor MC, Kennedy MC. 2021. Changes in agronomic practices and incidence and severity of diseases in winter wheat in England and Wales between 1999 and 2019. Plant Pathology 70:1759–1778. doi: 10.1111/ppa.13433 - DOI
    1. Goswami RS, Kistler HC. 2004. Heading for disaster: Fusarium graminearum on cereal crops. Mol Plant Pathol 5:515–525. doi: 10.1111/j.1364-3703.2004.00252.x - DOI - PubMed
    1. Fones H, Gurr S. 2015. The impact of septoria tritici blotch disease on wheat: an EU perspective. Fungal Genet Biol 79:3–7. doi: 10.1016/j.fgb.2015.04.004 - DOI - PMC - PubMed
    1. Sutton JC. 1982. Epidemiology of wheat head blight and maize ear rot caused by Fusarium graminearum. Can J Plant Pathol 4:195–209. doi: 10.1080/07060668209501326 - DOI

LinkOut - more resources