Gain without pain: adaptation and increased virulence of Zika virus in vertebrate host without fitness cost in mosquito vector
- PMID: 37800949
- PMCID: PMC10653995
- DOI: 10.1128/jvi.01162-23
Gain without pain: adaptation and increased virulence of Zika virus in vertebrate host without fitness cost in mosquito vector
Abstract
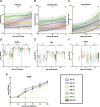
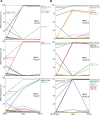
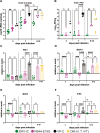
Previously, we modeled direct transmission chains of Zika virus (ZIKV) by serially passaging ZIKV in mice and mosquitoes and found that direct mouse transmission chains selected for viruses with increased virulence in mice and the acquisition of non-synonymous amino acid substitutions. Here, we show that these same mouse-passaged viruses also maintain fitness and transmission capacity in mosquitoes. We used infectious clone-derived viruses to demonstrate that the substitution in nonstructural protein 4A contributes to increased virulence in mice.
Keywords: Zika virus; arbovirus; evolution; pathogenesis; transmission.
Conflict of interest statement
The authors declare no conflict of interest.
Figures


Update of
-
Gain without pain: Adaptation and increased virulence of Zika virus in vertebrate host without fitness cost in mosquito vector.bioRxiv [Preprint]. 2023 Mar 20:2023.03.20.533515. doi: 10.1101/2023.03.20.533515. bioRxiv. 2023. Update in: J Virol. 2023 Oct 31;97(10):e0116223. doi: 10.1128/jvi.01162-23. PMID: 36993525 Free PMC article. Updated. Preprint.
Similar articles
-
An accumulated mutation gained in mosquito cells enhances Zika virus virulence and fitness in mice.J Virol. 2024 Nov 19;98(11):e0125124. doi: 10.1128/jvi.01251-24. Epub 2024 Oct 16. J Virol. 2024. PMID: 39412258 Free PMC article.
-
Infection, dissemination, and transmission efficiencies of Zika virus in Aedes aegypti after serial passage in mosquito or mammalian cell lines or alternating passage in both cell types.Parasit Vectors. 2021 May 18;14(1):261. doi: 10.1186/s13071-021-04726-1. Parasit Vectors. 2021. PMID: 34006306 Free PMC article.
-
Vector competence of Aedes aegypti, Culex tarsalis, and Culex quinquefasciatus from California for Zika virus.PLoS Negl Trop Dis. 2018 Jun 21;12(6):e0006524. doi: 10.1371/journal.pntd.0006524. eCollection 2018 Jun. PLoS Negl Trop Dis. 2018. PMID: 29927940 Free PMC article.
-
Non-vector-borne transmission of Zika virus: A systematic review.Travel Med Infect Dis. 2016 Jul-Aug;14(4):313-30. doi: 10.1016/j.tmaid.2016.07.002. Epub 2016 Jul 15. Travel Med Infect Dis. 2016. PMID: 27425793
-
Zika virus: An updated review of competent or naturally infected mosquitoes.PLoS Negl Trop Dis. 2017 Nov 16;11(11):e0005933. doi: 10.1371/journal.pntd.0005933. eCollection 2017 Nov. PLoS Negl Trop Dis. 2017. PMID: 29145400 Free PMC article.
Cited by
-
Dengue and Zika virus NS4B proteins differ in topology and in determinants of ER membrane protein complex dependency.J Virol. 2025 Feb 25;99(2):e0144324. doi: 10.1128/jvi.01443-24. Epub 2024 Dec 31. J Virol. 2025. PMID: 39745435 Free PMC article.
-
Zika virus-induced fetal demise is triggered by strain- and dose-specific RLR-driven activation of the interferon response in the decidua, placenta, and fetus in Ifnar1-/- mice.J Virol. 2025 Jun 17;99(6):e0066625. doi: 10.1128/jvi.00666-25. Epub 2025 May 22. J Virol. 2025. PMID: 40401980 Free PMC article.
-
Zika virus-induced fetal demise is driven by strain- and dose-specific RLR-driven activation of the interferon response in the decidua, placenta, and fetus in Ifnar1 -/- mice.bioRxiv [Preprint]. 2025 Feb 13:2025.02.12.637947. doi: 10.1101/2025.02.12.637947. bioRxiv. 2025. Update in: J Virol. 2025 Jun 17;99(6):e0066625. doi: 10.1128/jvi.00666-25. PMID: 39990459 Free PMC article. Updated. Preprint.
-
Artificial intelligence-based prediction of pathogen emergence and evolution in the world of synthetic biology.Microb Biotechnol. 2024 Oct;17(10):e70014. doi: 10.1111/1751-7915.70014. Microb Biotechnol. 2024. PMID: 39364593 Free PMC article. Review.
-
Fitness adaptations of Japanese encephalitis virus in pigs following vector-free serial passaging.PLoS Pathog. 2024 Aug 26;20(8):e1012059. doi: 10.1371/journal.ppat.1012059. eCollection 2024 Aug. PLoS Pathog. 2024. PMID: 39186783 Free PMC article.
References
Publication types
MeSH terms
Grants and funding
LinkOut - more resources
Full Text Sources
Medical

