. 2023 Dec 1;325(6):H1337-H1353.
doi: 10.1152/ajpheart.00337.2023. Epub 2023 Oct 6.

Neuraminidase inhibition improves endothelial function in diabetic mice

Affiliations

Neuraminidase inhibition improves endothelial function in diabetic mice

Christopher A Foote et al. Am J Physiol Heart Circ Physiol. .

Abstract

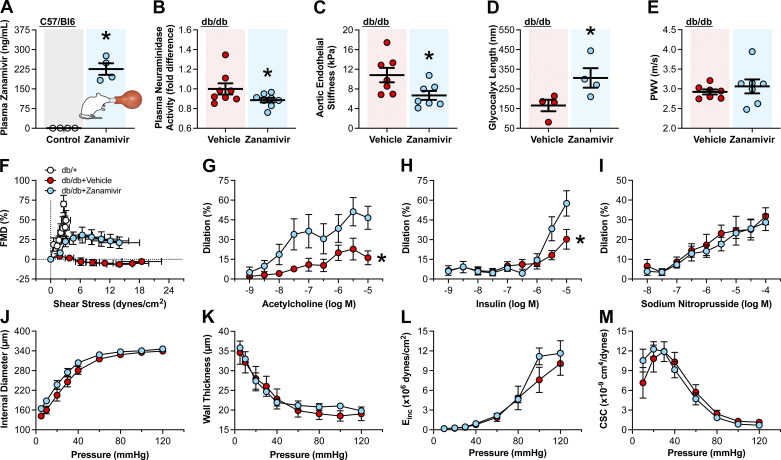
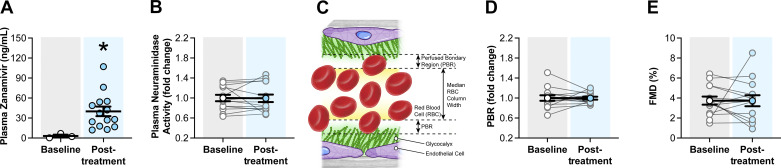
Neuraminidases cleave sialic acids from glycocalyx structures and plasma neuraminidase activity is elevated in type 2 diabetes (T2D). Therefore, we hypothesize circulating neuraminidase degrades the endothelial glycocalyx and diminishes flow-mediated dilation (FMD), whereas its inhibition restores shear mechanosensation and endothelial function in T2D settings. We found that compared with controls, subjects with T2D have higher plasma neuraminidase activity, reduced plasma nitrite concentrations, and diminished FMD. Ex vivo and in vivo neuraminidase exposure diminished FMD and reduced endothelial glycocalyx presence in mouse arteries. In cultured endothelial cells, neuraminidase reduced glycocalyx coverage. Inhalation of the neuraminidase inhibitor, zanamivir, reduced plasma neuraminidase activity, enhanced endothelial glycocalyx length, and improved FMD in diabetic mice. In humans, a single-arm trial (NCT04867707) of zanamivir inhalation did not reduce plasma neuraminidase activity, improved glycocalyx length, or enhanced FMD. Although zanamivir plasma concentrations in mice reached 225.8 ± 22.0 ng/mL, in humans were only 40.0 ± 7.2 ng/mL. These results highlight the potential of neuraminidase inhibition for ameliorating endothelial dysfunction in T2D and suggest the current Food and Drug Administration-approved inhaled dosage of zanamivir is insufficient to achieve desired outcomes in humans.NEW & NOTEWORTHY This work identifies neuraminidase as a key mediator of endothelial dysfunction in type 2 diabetes that may serve as a biomarker for impaired endothelial function and predictive of development and progression of cardiovascular pathologies associated with type 2 diabetes (T2D). Data show that intervention with the neuraminidase inhibitor zanamivir at effective plasma concentrations may represent a novel pharmacological strategy for restoring the glycocalyx and ameliorating endothelial dysfunction.

Keywords: flow-mediated dilation; glycocalyx; type 2 diabetes; zanamivir.


Conflict of interest statement

The authors declare the following financial interests/personal relationships which may be considered as potential competing interests: Pending US patent Application, Serial No. 16/754,814. Entitled: Neuraminidase Inhibition to Improve Glycocalyx Volume and Function to Ameliorate Cardiovascular Diseases in Pathologies Associated with Glycocalyx Damage (filed, 9 April 2020; Ref. No. 17UMC103).

Figures

None
Graphical abstract
Figure 1.
Figure 1.
Human subjects with type 2 diabetes (T2D) have increased plasma neuraminidase activity and decreased endothelial function. A: plasma neuraminidase activity expressed as fold difference from healthy controls (open circles, n = 20) and subjects with T2D (red circles, n = 18, plasma samples from two subjects were completely used in previous assays). B: plasma nitrite concentration in healthy controls (open circles, n = 12, plasma samples from eight subjects had been completely used in previous assays) and subjects with T2D (red circles, n = 15, plasma samples from five subjects had been completely used in previous assays). C: femoral artery flow-mediated dilation (FMD) expressed as percent change in arterial diameter in healthy controls (open circles, n = 20) and subjects with T2D (red circles, n = 15, borders of the arterial wall for 5 subjects were not sufficiently resolved for accurate diameter measurements). D–F: Pearson correlations between plasma neuraminidase activity with FMD (D), plasma neuraminidase activity with plasma nitrite (E), and plasma nitrite with FMD (F). Data are expressed as means ± SE or Pearson’s coefficient (r). *P ≤ 0.05, T2D vs. healthy controls as determined by unpaired two-tailed Student’s t test (A and C) and Mann–Whitney U test (B).
Figure 2.
Figure 2.
Exposure to exogenous neuraminidase blunts arterial flow-mediated dilation (FMD). A: cannulated and pressurized small mesenteric arteries isolated from C57BL/6J male mice were exposed intraluminally to either vehicle (control, n = 5, 1 isolated vessel did not respond to preconstriction with phenylephrine) or neuraminidase (Neu, n = 6) for 1 h and subsequently preconstricted with phenylephrine and subjected to increasing intraluminal flow rates to augment wall shear stress and induce FMD. FMD at each intraluminal flow rate (mL/h) is expressed as percent dilation from the maximal phenylephrine preconstriction. B: same FMD data as in A, plotted against the shear stress achieved at each intraluminal flow rate used. C and D: vasodilatory responses of the same mesenteric arteries, preconstricted with phenylephrine and exposed to increasing concentrations of acetylcholine (C) or sodium nitroprusside (D). E: cannulated and pressurized femoral arteries isolated from C57BL/6J male mice (n = 4) were subjected to increasing levels of intraluminal flow before (pretreatment) and after (posttreatment) a 1-h exposure to neuraminidase (Neu). Femoral FMD at each intraluminal flow rate (mL/h) is expressed as percent dilation from the maximal phenylephrine preconstriction in response to increasing levels of flow rate. F: same FMD data as in E, plotted against the shear stress achieved at each intraluminal flow rate used. G: representative images taken before (pretreatment) and after (posttreatment) a 1-h intraluminal exposure to neuraminidase in which the glycocalyx was stained with wheat germ agglutinin (WGA, green at top, and white at bottom), and the internal elastic lamina was stained with Alexa Fluor 633 hydrazide (red); scale bar = 50 µm (n = 5). Image contrast was adjusted equally for visualization purposes, and analyses were performed using raw data. H: quantification of change in WGA content is expressed as fold difference from control in the same femoral arteries as in G. I: C57BL/6J male mice were injected twice over 48 h with either a bolus of 16.6 U/mL of Clostridium perfringens Neu (n = 6) or vehicle control (n = 6) and euthanized 24 h after the second injection. Their isolated mesenteric arteries were cannulated, pressurized, and subsequently preconstricted with phenylephrine and exposed to increasing intraluminal flow rates to augment wall shear stress and induce FMD. FMD at each intraluminal flow rate (mL/h) is expressed as percent dilation from the maximal phenylephrine preconstriction. One isolated vessel from each group did not respond to preconstriction with phenylephrine. J: same FMD data as in I, plotted against the shear stress achieved at each intraluminal flow rate used. K: schematic representation of atomic force microscopy (AFM) generated force curves used to measure glycocalyx length of aortic en face samples from the same mice as in I. L: endothelial glycocalyx length as assessed by AFM in aortic explants isolated from the same mice as in I. Data are expressed as means ± SE. *P ≤ 0.05, Neu vs. vehicle or control as determined by two-way ANOVA (repeated measurements) main effect of treatment (A, E, and I) or by two-tailed, paired (H) or unpaired (L) Student’s t test.
Figure 3.
Figure 3.
Exposure of cultured endothelial cells to neuraminidase (Neu) reduces presence of cell surface glycocalyx structures. A: representative fluorescence images of glycocalyx stained with wheat germ agglutinin (WGA, green) and nuclei stained with 4′,6-diamidino-2-phenylindole (DAPI, blue) in human endothelial cells; scale bar = 50 µm. Cells were treated for 1 h with either vehicle (control, n = 5), or neuraminidase (Neu, n = 5). B: quantification of WGA fluorescence intensities normalized by the number of cells and expressed as fold difference from control. C: representative fluorescence images of glycocalyx sialic acid stained with Maackia amunrensis lectin 1 and 2 (MAA/MAL I + II, green) and nuclei stained with DAPI (blue); scale bar = 50 µm. Cells were treated for 1 h with either vehicle (control, n = 5), or neuraminidase (Neu, n = 5). D: quantification of MAA/MAL I + II fluorescence intensities normalized by the number of cells and expressed as fold difference from control. E: representative fluorescence images of glycocalyx hyaluronan stained with hyaluronan acid binding protein (HABP, green) and nuclei stained with DAPI (blue); scale bar = 50 µm. Cells were treated for 1 h with either vehicle (control, n = 5), or neuraminidase (Neu, n = 5). F: quantification of HABP fluorescence intensities normalized by the number of cells and expressed as fold difference from control. G: representative images of immunofluorescence staining of syndecan-1 (SDC1, green) and nuclei staining with DAPI (blue), scale bar = 50 µm. Cells were treated for 1 h with either vehicle (control, n = 12) or neuraminidase (Neu, n = 12) and subsequently exposed to 15 dyn/cm2 shear stress for 1 h. H: quantification of SDC1 fluorescence intensities normalized by the number of cells and expressed as fold difference from Control. Data are expressed as means ± SE. *P ≤ 0.05, neuraminidase vs. control as determined by unpaired two-tailed Student’s t test (B, D, and F) or Mann–Whitney U test (H).
Figure 4.
Figure 4.
In vivo neuraminidase inhibition improves endothelial function in a mouse model of type 2 diabetes. A: plasma zanamivir concentrations as assessed by liquid chromatography-mass spectrometry in male C57BL/6J mice exposed (zanamivir, n = 4) or not (control, n = 4) to two doses of 5 mg zanamivir inhalation 12 h apart. B: plasma neuraminidase activity in male db/db mice administered zanamivir (n = 8) or vehicle (n = 8) via inhalation for 5 days. Plasma neuraminidase activity is expressed as fold difference from vehicle. C: endothelial stiffness in aortic explants isolated from zanamivir-treated mice (n = 7) and vehicle-treated controls (n = 7), as assessed by atomic force microscopy (AFM). D: glycocalyx length in aortic explants isolated from zanamivir-treated mice (n = 4) and vehicle-treated controls (n = 4) as assessed by AFM. E: aortic pulse wave velocity (PWV) in zanamivir-treated mice (n = 7) and vehicle-treated controls (n = 7). F–I: isolated femoral artery vasodilatory responses to intraluminal flow-induced shear stress (F), acetylcholine (G), insulin (H), or sodium nitroprusside (I). Vasodilation is expressed as percent change in diameter from the preconstriction induced by phenylephrine in arteries isolated from zanamivir-treated mice (n = 5–7) and vehicle-treated controls (n = 6–7). J–M: zanamivir treatment does not affect the mechanical characteristics of femoral arteries isolated from db/db mice and tested under passive conditions. J: internal diameter. K: mean wall thickness. L: incremental modulus of elasticity (Einc). M: cross-sectional compliance (CSC). Vehicle (n = 7)- and zanamivir (n = 7)-treated mice. Data are expressed as means ± SE. *P ≤ 0.05, zanamivir vs. control (vehicle) as determined by unpaired two-tailed Student’s t test (A, C, and D), one-tailed Mann–Whitney U test (B), and two-way ANOVA (repeated measurements) for the interaction between main effects followed by Bonferroni’s post hoc test (G and H).
Figure 5.
Figure 5.
Inhaled zanamivir does not decrease plasma neuraminidase activity or improve noninvasive measurements of vascular function in humans with type 2 diabetes (T2D). A: plasma zanamivir concentrations as assessed with liquid chromatography-mass spectrometry in subjects with T2D before treatment (baseline, open circles, n = 3) and following treatment (posttreatment, blue circles, n = 14) with inhaled zanamivir. B: plasma neuraminidase activity in subjects with T2D before treatment (baseline, open circles, n = 14) and following treatment (posttreatment, blue circles, n = 14). Plasma neuraminidase activity is expressed as fold change from baseline. C: schematic illustration of the perfused boundary region (PBR) created by the separation between the endothelial glycocalyx and flowing red blood cells in the lumen of an artery. D: PBR as determined with side-stream dark field video microscopy in subjects with T2D before treatment (baseline, open circles, n = 14) and following treatment (posttreatment, blue circles, n = 14) with inhaled zanamivir. PBR is expressed as fold change from baseline. E: brachial artery flow-mediated dilation (FMD) expressed as percent change in arterial diameter in subjects with T2D before treatment (baseline, open circles, n = 14) and following treatment (posttreatment, blue circles, n = 14) with inhaled zanamivir. Data are expressed as means ± SE. *P ≤ 0.05, posttreatment vs. baseline as determined by two-tailed Mann–Whitney U test (A).
Figure 6.
Figure 6.
Schematic representation of the model whereby increased plasma neuraminidase activity in type 2 diabetes (T2D) causes endothelial dysfunction. A: increased plasma neuraminidase activity in T2D sheds sialic acid from the luminal surface of the endothelium and favors glycocalyx degradation over glycocalyx synthesis. B: representative confocal image of the endothelial glycocalyx stained with fluorescently tagged wheat germ agglutinin (WGA, green) and cell nuclei with 4′,6-diamidino-2-phenylindole (DAPI, blue) in a control mouse mesenteric artery and an artery treated intraluminally with exogenous neuraminidase; scale bar = 50 µm. The decreased amount of glycocalyx caused by neuraminidase activity is proposed to reduce the mechanosensation capacity of the endothelium to blood flow-induced shear stress and thus diminish shear generated nitric oxide and flow-mediated dilation in T2D.

References

    1. Forbes JM, Cooper ME. Mechanisms of diabetic complications. Physiol Rev 93: 137–188, 2013. doi:10.1152/physrev.00045.2011. - DOI - PubMed
    1. Brownlee M. The pathobiology of diabetic complications: a unifying mechanism. Diabetes 54: 1615–1625, 2005. doi:10.2337/diabetes.54.6.1615. - DOI - PubMed
    1. Laakso M. Cardiovascular disease in type 2 diabetes: challenge for treatment and prevention. J Intern Med 249: 225–235, 2001. doi:10.1046/j.1365-2796.2001.00789.x. - DOI - PubMed
    1. Laakso M. Cardiovascular disease in type 2 diabetes from population to man to mechanisms: the Kelly West Award Lecture 2008. Diabetes Care 33: 442–449, 2010. doi:10.2337/dc09-0749. - DOI - PMC - PubMed
    1. Roberts AC, Porter KE. Cellular and molecular mechanisms of endothelial dysfunction in diabetes. Diab Vasc Dis Res 10: 472–482, 2013. doi:10.1177/1479164113500680. - DOI - PubMed

Publication types

Associated data