. 2023 Oct 6;80(11):316.
doi: 10.1007/s00018-023-04968-5.

Mechanical stress confers nuclear and functional changes in derived leukemia cells from persistent confined migration

Affiliations

Mechanical stress confers nuclear and functional changes in derived leukemia cells from persistent confined migration

Ana de Lope-Planelles et al. Cell Mol Life Sci. .

Abstract

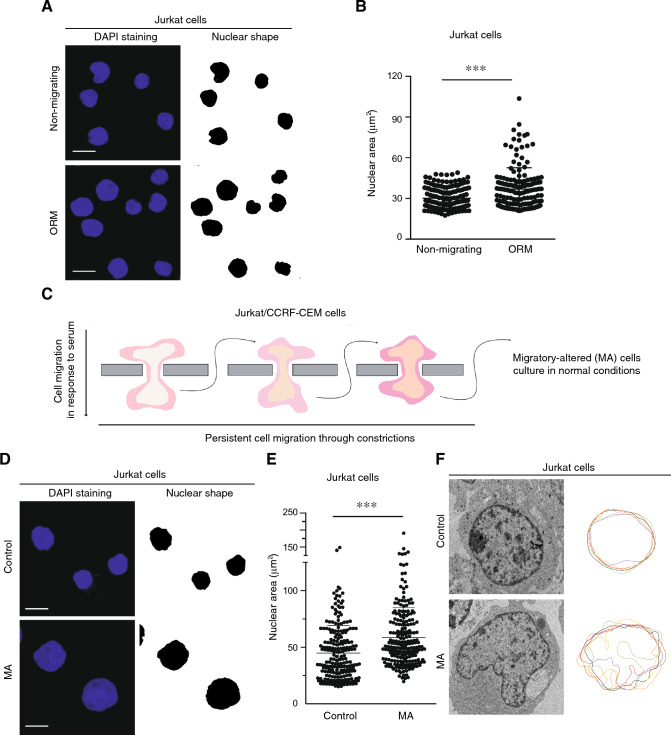
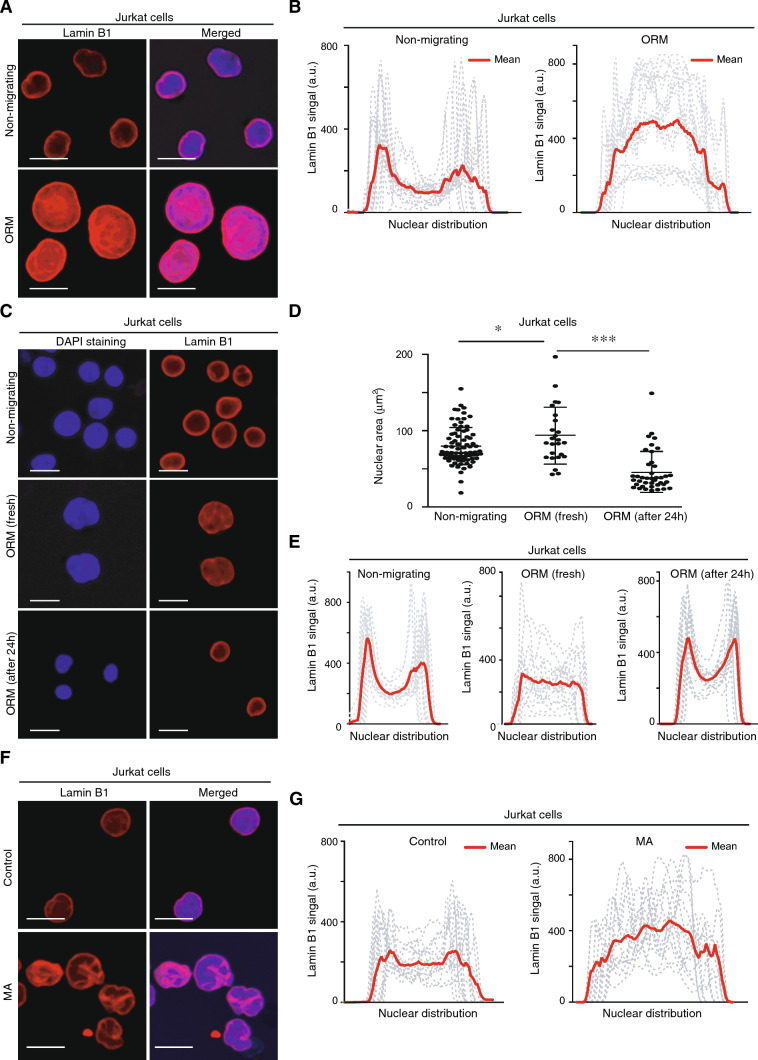
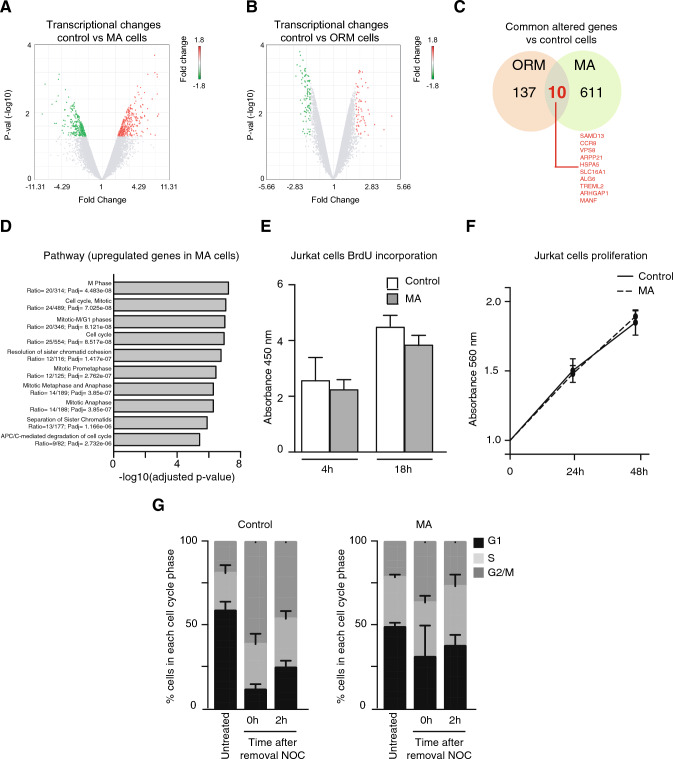
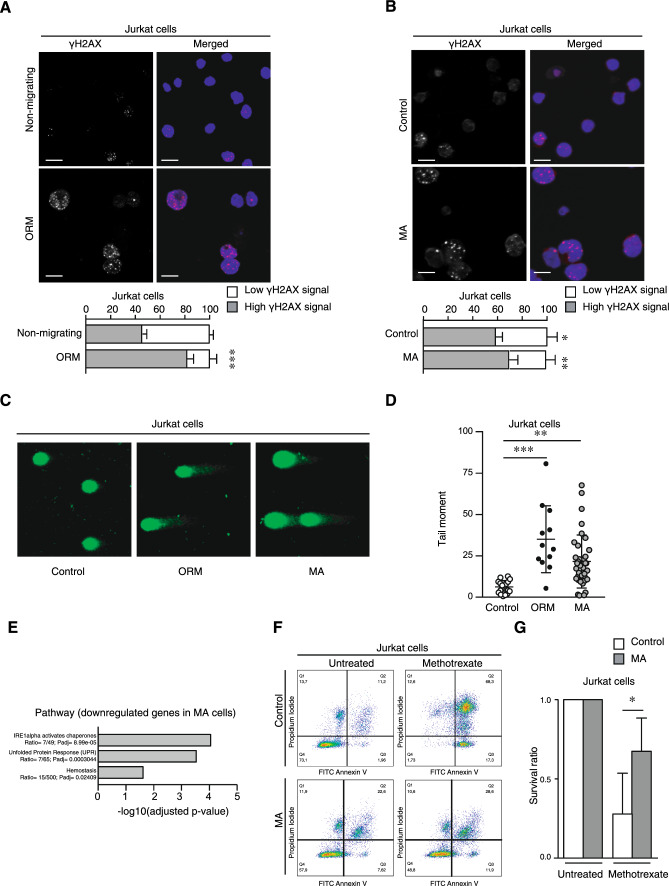
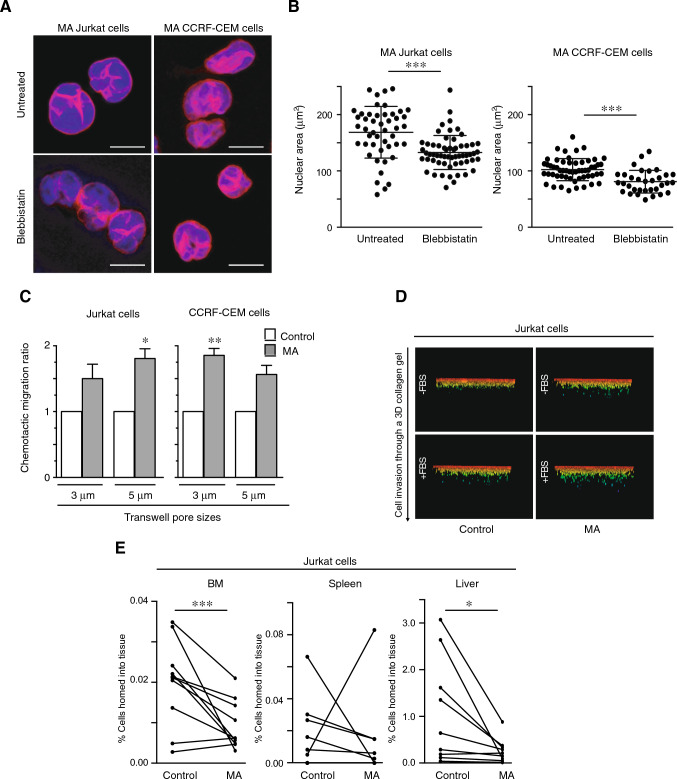
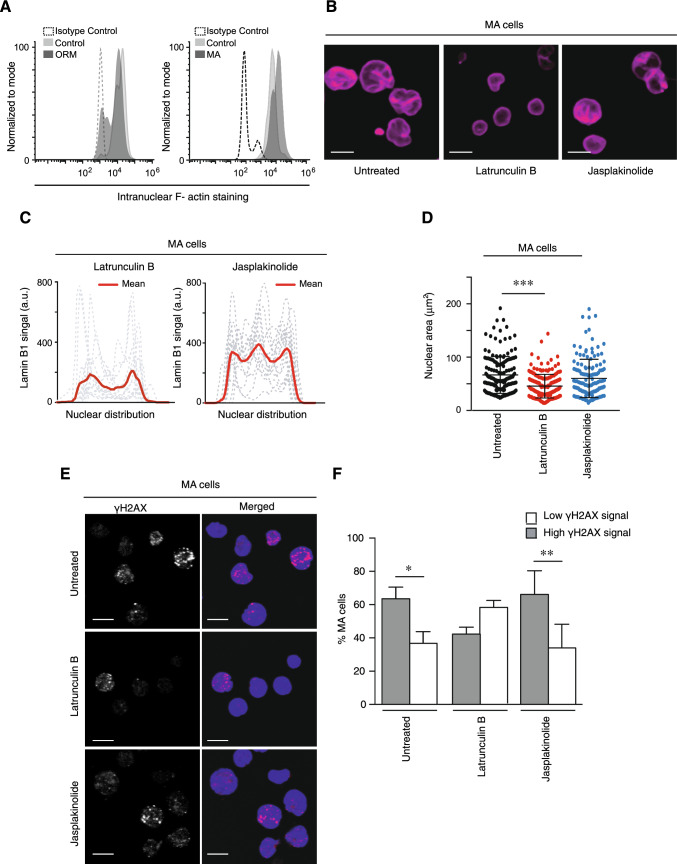
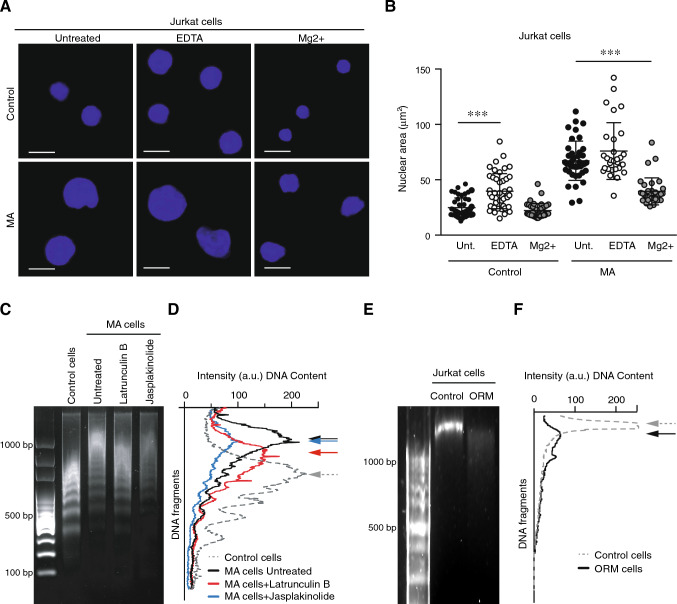
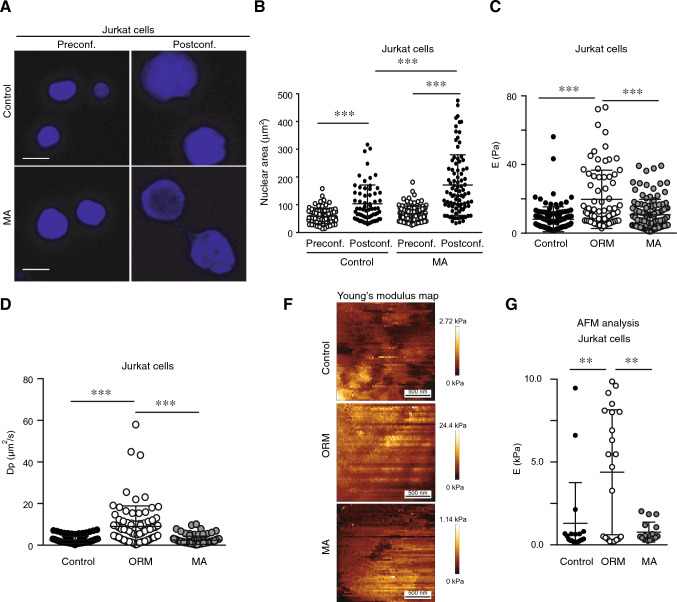
Nuclear deformability plays a critical role in cell migration. During this process, the remodeling of internal components of the nucleus has a direct impact on DNA damage and cell behavior; however, how persistent migration promotes nuclear changes leading to phenotypical and functional consequences remains poorly understood. Here, we described that the persistent migration through physical barriers was sufficient to promote permanent modifications in migratory-altered cells. We found that derived cells from confined migration showed changes in lamin B1 localization, cell morphology and transcription. Further analysis confirmed that migratory-altered cells showed functional differences in DNA repair, cell response to chemotherapy and cell migration in vivo homing experiments. Experimental modulation of actin polymerization affected the redistribution of lamin B1, and the basal levels of DNA damage in migratory-altered cells. Finally, since major nuclear changes were present in migratory-altered cells, we applied a multidisciplinary biochemical and biophysical approach to identify that confined conditions promoted a different biomechanical response of the nucleus in migratory-altered cells. Our observations suggest that mechanical compression during persistent cell migration has a role in stable nuclear and genomic alterations that might handle the genetic instability and cellular heterogeneity in aging diseases and cancer.

Keywords: Cell migration; DNA damage; Lamin; Mechanobiology; Nuclear deformability.


Conflict of interest statement

Authors declare no competing interests.

Figures

Fig. 1
Fig. 1
Cell migration through constrictions governs nuclear changes in leukemia cells. A Jurkat cells were allowed to migrate across 3 μm transwell inserts for 24 h. Non-migrating and one-round migrated (ORM) cells were collected from the upper and bottom chambers, respectively, sedimented on poly-L-lysine coated coverslips, fixed and stained with DAPI (blue) for their analysis by confocal microscopy. Right panels indicate in black the area of the nuclei. Bar 10 μm. B Graph shows changes in the nuclear area of Jurkat cells upon one-round of migration through constrictions. Mean n = 157 cells ± SD (3 replicates). C Jurkat and CCRF-CEM cells were forced to migrate three repeated rounds through 3 μm transwell inserts. Then, migrated cells were collected as migratory-altered (MA) cells, expanded and kept in culture conditions. D Control and MA Jurkat cells were sedimented on poly-L-lysine coated coverslips, fixed and stained with DAPI. Right panels indicate in black the area of the nuclei. Bar 10 μm. E Graph shows changes in the nuclear area of control and MA cells. Mean n = 216 cells ± SD (5 replicates). F Control and MA Jurkat cells were collected and processed for thin section electron microscopy to visualize the nuclear morphology. Plot shows changes in the nuclear circularity of control and MA Jurkat cells (n = 6 representative cells). (***) P < 0.001
Fig. 2
Fig. 2
Confined migration alters the lamin B1 distribution of moving cells. A Non-migrating and ORM Jurkat cells were seeded on poly-L-lysine-coated glasses and stained with DAPI (blue) and anti-lamin B1 antibody (red) for their analysis by confocal microscopy. Bar 10 μm. B Line plots show the signal profile of lamin B1 from 15 representative nuclei. Red line indicates the mean intensity of the profiles analyzed. C Control, fresh ORM, and ORM Jurkat cells collected and cultured in suspension for an additional 24 h were seeded on poly-L-lysine-coated glasses and analyzed by confocal microscopy. Bar 10 μm. D Graph shows changes in the nuclear area of the cells from (C). Mean n = 25–92 cells ± SD (2 independent replicates). E Line plots show the signal profile of lamin B1 from 15 representative nuclei of the cells from (C). F Control and MA Jurkat cells were seeded on poly-L-lysine-coated glasses and analyzed by confocal microscopy. Bar 10 μm. G Line plots show the signal profile of lamin B1 from 15 representative nuclei of control and MA Jurkat cells. The red line indicates the mean intensity of the profiles analyzed. (*) P < 0.05, (***) P < 0.001
Fig. 3
Fig. 3
Persistent migration induces changes in the transcriptional profile of migrating cells. A mRNA from control and MA Jurkat cells was isolated and the number of differentially expressed genes was analyzed by microarray. Volcano plot shows significant changes of gene transcripts in control and MA cells. B Control and ORM Jurkat cells were lysed, and the number of differentially expressed genes was analyzed by microarray. Volcano plot shows significant changes of gene transcripts in control and ORM cells. C Venn diagram representation of common transcriptional changes (10 transcripts, labeled in red) between ORM and MA cells compared to control cells. D Pathway enrichment analysis based on differentially upregulated genes in MA Jurkat cells. E Control and MA Jurkat cells were incubated with BrdU for 4 and 18 h. Then, cells were fixed and BrdU incorporation quantified. Mean n = 6 replicates ± SD. F Control (dark line) and MA (dashed line) Jurkat cells were cultured at indicated times and cell proliferation was quantified by MTT assay. Mean n = 3 replicates ± SD. G Control and MA cells were cultured in the presence or not of nocodazole (100 ng/ml) for 16 h. Then, cells were washed and the cell cycle was determined at indicated times. Bar graph shows the cell cycle profile analysis of control and MA cells following release from nocodazole inhibition. Mean n = 3 replicates ± SD
Fig. 4
Fig. 4
Confined migration leads to aberrant DNA damage response of moving cells. A Non-migrating and ORM Jurkat cells were seeded on poly-L-lysine-coated glasses and stained with DAPI (blue) and anti-γH2AX antibody (red) for their analysis by confocal microscopy. Bar 10 μm. Graph shows the percentage of cells with more than 2 visible foci for γH2AX (dark grey, as high γH2AX signal). Mean n = 116–118 ± SD (3 replicates). B Control and MA Jurkat cells were seeded on poly-L-lysine-coated glasses, stained, and analyzed by confocal microscopy. Bar 10 μm. Graph shows the percentage of control and MA Jurkat cells with more than 2 visible foci for γH2AX. Mean n = 28–35 cells ± SD (2 replicates). C Control, ORM, and MA Jurkat cells were embedded in agarose and lysed. Alkaline comet assay by electrophoresis was performed to visualize the DNA by fluorescence microscopy. D Graph shows the tail moment analysis of the comet assay in (C). Mean n = 32–60 cells ± SD (3 replicates). E Pathway enrichment analysis based on differentially downregulated genes in MA Jurkat cells. F Control and MA Jurkat cells were cultured in the presence or not of methotrexate (1 μM) for 24 h. Then, cells were collected and stained with annexin V-FITC and propidium iodide for their flow cytometry analysis. (G) Graph shows the survival ratio of control and MA Jurkat cells upon normalization to their untreated conditions. Mean n = 3 ± SD. (*) P < 0.05, (**) P < 0.001, (***) P < 0.001
Fig. 5
Fig. 5
Confined migration has a dual impact on the chemotactic response and in vivo invasiveness of moving cells. A MA Jurkat cells were cultured in the presence or absence of blebbistatin (1 μg/mL) for 1 h at 37 ºC. Then, cells were seeded on poly-L-lysine coated coverslips, fixed and analyzed by confocal microscopy. Bar 10 μm. B Graph shows the nuclear area from cells in (A). Mean n = 132–158 isolated nuclei ± SD. C Control and MA Jurkat and CCRF-CEM cells were seeded on the top of Transwell chambers and allowed to migrate in response to serum (FBS). Cells were collected from the bottom chamber after 24 h and quantified. Mean n = 3 replicates ± SD. D Control and MA Jurkat cells were seeded on the top of a collagen matrix and allowed to penetrate into the collagen in response to serum (FBS, fetal bovine serum) for 24 h. Cells were fixed, stained with propidium iodide and serial confocal sections were captured. Images show the cell penetrability into the collagen. E Control (Cell Tracker Far Red +) and MA (CFSE +) Jurkat cells were mixed and injected into the tail vein of 10 NSG mice. After 24 h, labeled cells in spleen, liver and bone marrow were determined by flow cytometry. Graph shows the percentage of control and the MA cells analyzed in each animal. Mean n = 10. (*) P < 0.05,(**) P < 0.001, (***) P < 0.001
Fig. 6
Fig. 6
Actin polymerization balance regulates the nuclear changes described for MA cells. A Flow cytometry expression of F-actin in the isolated nuclei of control, ORM and MA cells. B MA Jurkat cells were cultured in the presence or absence of latrunculin B (1 μg/mL) and jasplakinolide (1 μg/mL) for 1 h at 37ºC. Then, cells were seeded on poly-L-lysine coated coverslips, fixed and analyzed by confocal microscopy. Bar 10 μm. C Line plots show the signal profile of lamin B1 from 15 representative nuclei. The red line indicates the mean intensity of the profiles analyzed. D Graph shows changes in the nuclear area of MA Jurkat cells under indicated treatments. Mean n = 145–185 nuclei ± SD (3 replicates). E Control and MA Jurkat cells were treated or not with latrunculin B or jasplakinolide for 1 h. Cells were fixed, permeabilized and stained with DAPI (blue) and γH2AX (red) for their analysis by confocal microscopy. Bar 10 μm. F Graph shows the percentage of cells with more than 2 visible foci for γH2AX from (E). Mean n = 53–82 nuclei ± SD (3 replicates). (*) P < 0.05,(**) P < 0.001, (***) P < 0.001
Fig. 7
Fig. 7
Confined migration promotes changes in the global chromatin configuration of moving cells. A Isolated nuclei from control and MA Jurkat cells were seeded on poly-lysine coated glasses. Then, osmotic stress conditions were induced by the addition of EDTA (swelling conditions) or MgCl2 (shrinking conditions). Nuclei were fixed, permeabilized and stained with DAPI for their analysis by confocal microscopy. Bar 10 μm. B Graph shows the nuclear area quantified from (C). Mean n = 29–46 isolated nuclei ± SD (2 replicates). C Control and MA Jurkat cells were treated or not with latrunculin B or jasplakinolide for 1 h. Then, cells were collected, and their DNA was digested with DNAse for 15 min and resolved in an agarose gel. D Graph shows the nucleosomal releasing profile from control (dashed line) and MA Jurkat cells as in (C). Arrows indicate the maxima DNA peaks in each cell population. E Control and ORM Jurkat cells were collected, and their DNA was digested with DNAse for 15 min and resolved in an agarose gel. F Graph shows the nucleosomal releasing profile from control (dashed line) and ORM Jurkat. Arrows indicate the maxima DNA peaks in each cell population. (***) P < 0.001
Fig. 8
Fig. 8
The nucleus alters its biomechanical behavior and compression in response to confined migration. A Isolated nuclei from control and MA Jurkat cells were stained with DAPI and seeded on poly-L-lysine-coated coverslips. Confocal sections of the nuclei were taken before (Preconf.) and after (Postconf.) confinement. Bar 10 μm. B Graph shows the nuclear area from cells in (A). Mean n = 66–89 isolated nuclei ± SD (3 replicates). C, D Isolated nuclei from control and MA Jurkat cells were seeded on polylysine-coated glasses and subject to indentation by optical tweezers. Graphs show the values of the stiffness (E) and the poroelastic diffusivity coefficient (Dp) calculated based on the nuclear indentation data for nuclei of control, ORM and MA cells. Mean n = 76–122 isolated nuclei ± SD (3 replicates). E Isolated nuclei from control, ORM, and MA cells were seeded on polylysine-coated dishes and imaged by AFM (Atomic Force Microscopy). PeakForce Tapping image of a representative nucleus for each condition captured with a maximum indentation force of 0.3 nN. Bar 500 nm. F Graph shows the Young's modulus values for isolated nuclei from control, ORM, and MA cells. Each point corresponds to the average value for a nucleus, calculated from at least 4000 force curves. Mean n = 17–22 isolated nuclei (4 replicates) ± SD. (***) P < 0.001.

References

    1. te Boekhorst V, Preziosi P, Friedl P. Plasticity of cell migration in vivo and in silico. Annu Rev Cell Dev Biol. 2016;32:491–526. doi: 10.1146/annurev-cellbio-111315-125201. - DOI - PubMed
    1. Paul CD, Shea DJ, Mahoney MR, Chai A, Laney V, Hung WC, Konstantopoulos K. Interplay of the physical microenvironment, contact guidance and intracellular signaling in cell decision making. FASEB J. 2016;30:2161–2170. doi: 10.1096/fj.201500199R. - DOI - PMC - PubMed
    1. Vining KH, Mooney DJ. Mechanical forces direct stem cell behaviour in development and regeneration. Nat Rev Mol Cell Bio. 2017;18:728–742. doi: 10.1038/nrm.2017.108. - DOI - PMC - PubMed
    1. Burke B, Stewart CL. Functional architecture of the cell's nucleus in development, aging, disease. Curr Top Dev Biol. 2014;109:1–52. doi: 10.1016/B978-0-12-397920-9.00006-8. - DOI - PubMed
    1. Kirby TJ, Lammerding J. Emerging views of the nucleus as a cellular mechanosensor. Nat Cell Biol. 2018;20:373–381. doi: 10.1038/s41556-018-0038-y. - DOI - PMC - PubMed