

Durvalumab ± Tremelimumab + Platinum-Etoposide in Extensive-Stage Small Cell Lung Cancer (CASPIAN): Outcomes by PD-L1 Expression and Tissue Tumor Mutational Burden
- PMID: 37801329
- PMCID: PMC10870117
- DOI: 10.1158/1078-0432.CCR-23-1689
Durvalumab ± Tremelimumab + Platinum-Etoposide in Extensive-Stage Small Cell Lung Cancer (CASPIAN): Outcomes by PD-L1 Expression and Tissue Tumor Mutational Burden
Abstract
Purpose: In the CASPIAN trial, first-line durvalumab plus platinum-etoposide (EP) significantly improved overall survival (OS) versus EP alone in extensive-stage small cell lung cancer (ES-SCLC). We report exploratory analyses of CASPIAN outcomes by programmed cell death ligand-1 (PD-L1) expression and tissue tumor mutational burden (tTMB).
Experimental design: Patients were randomized (1:1:1) to durvalumab (1,500 mg) plus EP, durvalumab plus tremelimumab (75 mg) plus EP, or EP alone. Treatment effects in PD-L1 and tTMB subgroups were estimated using an unstratified Cox proportional hazards model.
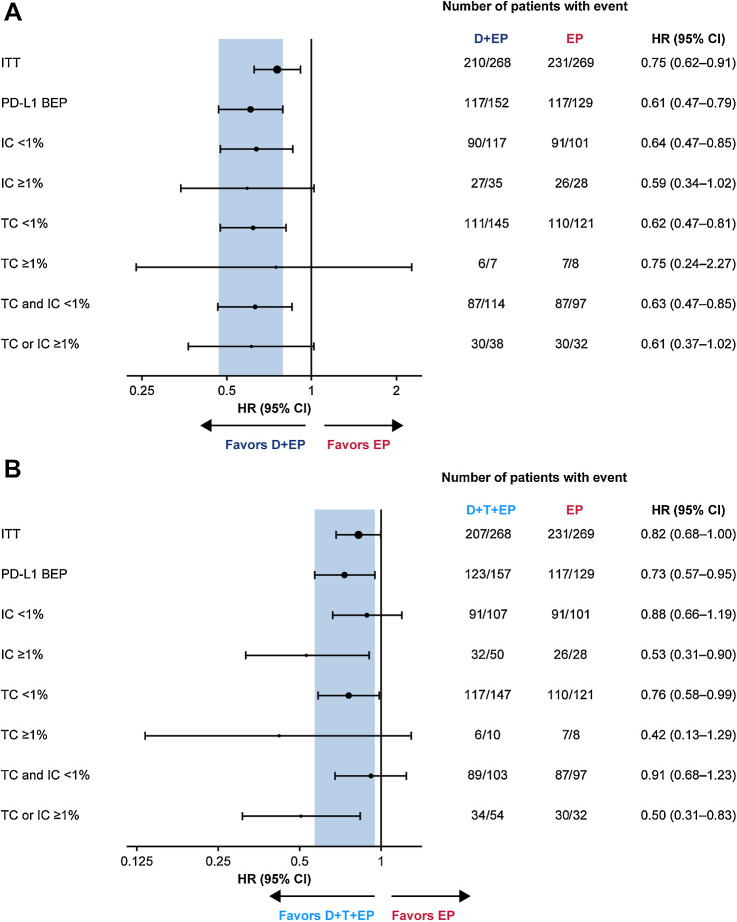
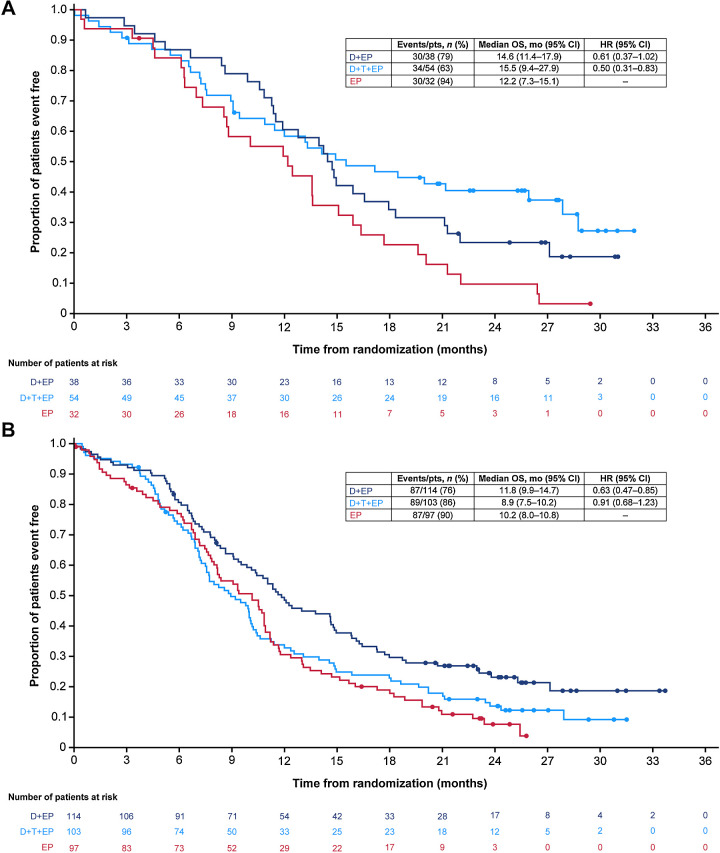
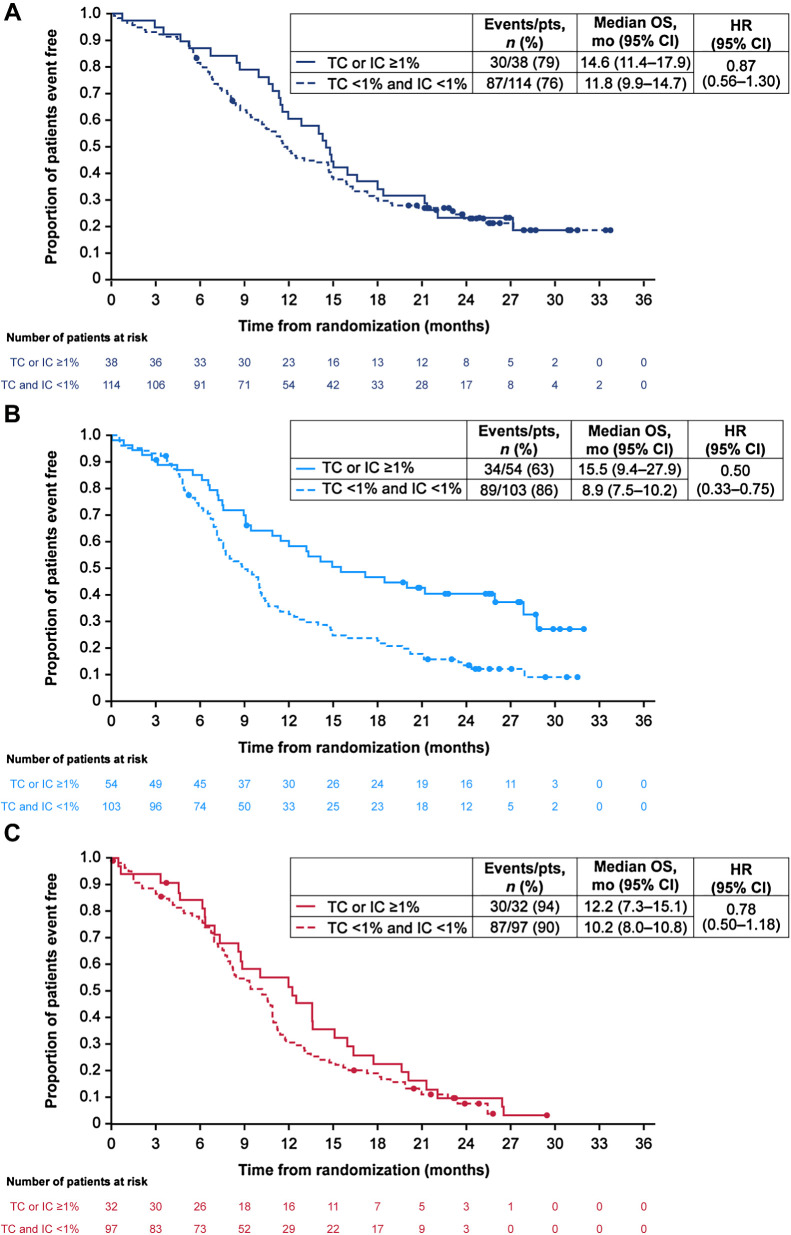
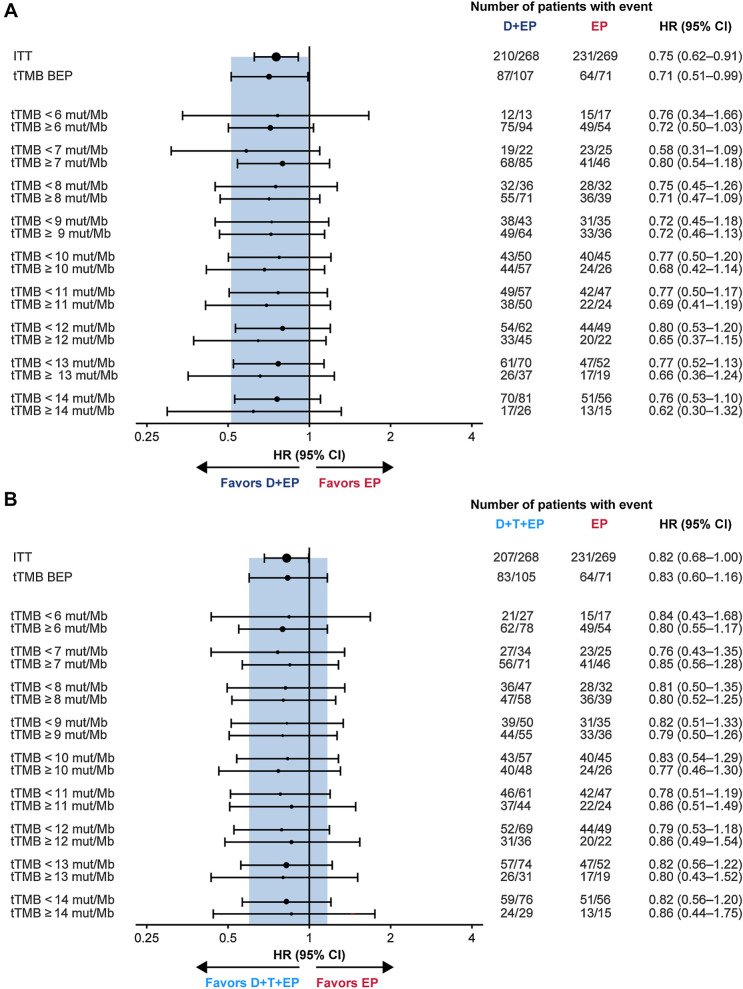
Results: The PD-L1 and tTMB biomarker-evaluable populations (BEP) comprised 54.4% (438/805) and 35.2% (283/805) of the intention-to-treat population, respectively. PD-L1 prevalence was low: 5.7%, 25.8%, and 28.3% had PD-L1 expression on ≥1% tumor cells (TC), ≥1% immune cells (IC), and ≥1% TCs or ICs, respectively. OS benefit with durvalumab plus EP versus EP was similar across PD-L1 subgroups, with HRs all falling within the 95% confidence interval (CI) for the PD-L1 BEP (0.47‒0.79). OS benefit with durvalumab plus tremelimumab plus EP versus EP was greater in PD-L1 ≥1% versus <1% subgroups, although CIs overlapped. There was no evidence of an interaction between tTMB and treatment effect on OS (durvalumab plus EP vs. EP, P = 0.916; durvalumab plus tremelimumab plus EP vs. EP, P = 0.672).
Conclusions: OS benefit with first-line durvalumab plus EP in patients with ES-SCLC was observed regardless of PD-L1 or tTMB status. PD-L1 expression may prove to be a useful biomarker for combined treatment with PD-(L)1 and CTLA-4 inhibition, although this requires confirmation with an independent dataset. See related commentary by Rolfo and Russo, p. 652.
©2023 The Authors; Published by the American Association for Cancer Research.
Figures
Comment in
-
In Search of Lost Biomarker for Immunotherapy in Small Cell Lung Cancer.Clin Cancer Res. 2024 Feb 16;30(4):652-654. doi: 10.1158/1078-0432.CCR-23-3087. Clin Cancer Res. 2024. PMID: 38085269
-
On the precipice of a new generation of biomarkers for immunotherapy in small cell lung cancer.Transl Cancer Res. 2025 Jan 31;14(1):24-28. doi: 10.21037/tcr-24-1711. Epub 2025 Jan 23. Transl Cancer Res. 2025. PMID: 39974403 Free PMC article. No abstract available.
References
-
- Horn L, Mansfield AS, Szczesna A, Havel L, Krzakowski M, Hochmair MJ, et al. . First-line atezolizumab plus chemotherapy in extensive-stage small-cell lung cancer. N Engl J Med 2018;379:2220–9. - PubMed
-
- Paz-Ares L, Dvorkin M, Chen Y, Reinmuth N, Hotta K, Trukhin D, et al. . Durvalumab plus platinum-etoposide versus platinum-etoposide in first-line treatment of extensive-stage small-cell lung cancer (CASPIAN): a randomised, controlled, open-label, phase 3 trial. Lancet 2019;394:1929–39. - PubMed
-
- Goldman JW, Garassino MC, Chen Y, Ozguroglu M, Dvorkin M, Trukhin D, et al. . Patient-reported outcomes with first-line durvalumab plus platinum-etoposide versus platinum-etoposide in extensive-stage small-cell lung cancer (CASPIAN): a randomized, controlled, open-label, phase III study. Lung Cancer 2020;149:46–52. - PubMed
Publication types
MeSH terms
Substances
LinkOut - more resources
Full Text Sources
Medical
Research Materials
